Introduction: Obesity is an alarming problem worldwide and it antedates insulin resistance (IR) as well as inflammation. Considering financial condition of Bangladesh, TyG index can be used for assessment of insulin resistance. As CRP and ferritin usually respond to any inflammatory condition, they are expected to be raised in obesity. Early detection of association between TyG index and inflammatory markers (CRP & ferritin) can help in prediction of severity of obesity induced health risks. Materials and Methods: A cross sectional analytical study was conducted in the Department of Biochemistry and Molecular Biology, (BSMMU) from March, 2022 to February, 2023. BMI was calculated, and individuals were classified into three obesity phenotypes: phenotype A (obese BMI, non-obese WC), phenotype B (non-obese BMI, obese WC), and phenotype C (obese BMI, obese WC). The Triglyceride-Glucose (TyG) index, serum ferritin, and CRP were assessed, and their correlations were analyzed across different obesity phenotypes. Results: TyG index was significantly higher in phenotype C compared to A & B. Plasma CRP and ferritin level were found to be highest in phenotype C in comparison to phenotype A and phenotype B. A moderate positive correlation was found between TyG index and serum ferritin but not with CRP in subjects belonging phenotype B. Very low positive correlation was found between CRP and ferritin in subjects of phenotype C. Conclusion: A significant association was shown between TyG index and serum ferritin among phenotype B. Plasma CRP showed no significant association with TyG index among different obesity phenotypes.
This is an Open Access article, distributed under the terms of the Creative Commons Attribution 4.0 International License (http://creativecommons.org/licenses/by/4.0/), which permits unrestricted use, distribution and reproduction in any medium or format, provided the original work is properly cited.
Obesity is a worldwide alarming issue for public health. It is assumed that 51 % of the total population will be obese by the year, 2030
[1]
Finkelstein E. A, et al. Obesity and severe obesity forecasts through 20 Am. J. Prev. Med. 2012; 42(6): 563–570.
[1]
. Obesity is a complex disease consisting of an excess or abnormal distribution or both of fat containing ad- ipose tissue which give rise to metabolic and endocrine al- terations and changes in the immune system and ultimately results in increased morbidity and lower life expectancy
[2]
Haslam D, James W. Obesity, (2005), Lancet, 366(9492): 1197–209.
[2]
. Obesity antedates the insulin resistance (IR) and inflamma- tion which ultimately increases the risk of diabetes mellitus as well as various cardiovascular outcome
[3]
World Health Organization. Obesity and Overweight—Fact Sheet,
The most used method for prediction of IR is homeostasis model assessment of insulin resistance (HOMA-IR). Measure- ment of fasting insulin is required to calculate HOMA-IR which is so expensive and not a routine test for obese individuals. Therefore many primary health care centers may not afford this
[5]
Wallace TM, Levy JC, Matthews DR, Use and abuse of HOMA modeling. Diabetes Care; 2004; 27: 1487–95.
[5]
. So considering financial condition, for developing countries, like Bangladesh, alternative tool for assessing IR is essential instead of HOMA-IR. The triglyceride/glucose index (TyG index), a formula formed by fasting triglyceride (TG) and glucose, can be used as an alternative tool to estimate IR instead of the HOMA-IR as triglyceride and blood glucose estimation are routinely done in our country. The cut off value for IR in the overall population is 8.8 for the TyG index
[6]
Unger Gisela, Silvia Fabiana Benozzi, Fernando Perruzza, Graciela Laura Pennacchiotti, Triglycerides and glucose index: a useful indicator of insulin resistance; Endonu- 2014; 621; No. of Pages 8;
. Use of TyG index reduces costs of screening with expanding its coverage.
In obese individuals ectopic fat deposition in different organs causes excess production of reactive oxygen species and pro-inflammation
[7]
Longo M., et al. Adipose tissue dysfunction as determinant of obesity-associated metabolic complications. Int. J. Mol. Sci. 2019; 20(9).
[7]
. C reactive protein (CRP) is the earliest markers for any inflammatory condition and the normal con- centration is less than or equal to 5 mg/L
[8]
Belfki, H., Ben Ali, S., Bougatef, S., Ben Ahmed, D., Haddad, N., Jmal, A. et al. Association between C-reactive protein and type 2 diabetes in a Tunisian population. Inflammation. 2012; 35(2): 684–6.
. Certain recent studies suggested that obesity induced chronic inflammatory reaction causes increased serum ferritin level which is not just because of an increased in iron stores
[10]
Zafon C, Lecube A, Simo R. Iron in obesity. An ancient mi- cronutrient for a modern disease. Obes Rev.2010; (11): 322-328.
[10]
. Normal ferritin level is usually 30 to 300 ng/ml are considered normal for men, and 10–200 ng/ml for women
[11]
Kratz A, Ferraro M, Sluss PM, Lewandrowski KB. Case rec- ords of the Massachusetts General Hospital. Weekly clinico- pathological exercises. Laboratory reference values. N Engl J Med. 2004; 351: 1548–15.
[11]
.
According to WHO criteria for Asia-Pacific region (WHO, 2000) individuals with BMI ≥25.0 kg/m2 are considered as gen- erally obese and WC ≥90 cm (men) and ≥80 cm (women) are considered as centrally obese. Several researchers showed that WC, coupled with BMI, predicts health risk better than BMI alone
[12]
Ardern, C. I., Katzmarzyk, P. T., Janssen, I. and Ross, R, (2003), Discrimination of health risk by combined body mass index and waist circumference. Obesity research, 11(1), 135-1
. Therefore in this study obesity phenotypes are classified based on both BMI and WC. This study aims to find out any association between inflammatory markers (CRP and Ferritin) and TyG index in different phenotypes of obesity which will help in early detection and prevention of obesity induced health risks.
2. Materials and Methods
A cross sectional analytical study was conducted in the De- partment of Biochemistry and Molecular Biology, Bangabandhu Sheikh Mujib Medical University (BSMMU) from March, 2022 to February, 2023 among 512 participants after getting approval from Institutional Review Board (IRB). Participants included for the study were nondiabetic, either sex (25-65 years) having BMI ≥18.5 kg/m2. Individuals who had chronic diseases, cardiovascular diseases, malignancy, history of taking lipid lowering drugs, NSAID, steroids and pregnant women were excluded from the study groups. Subjects (non-obese and obese individuals) from the outpatient department of BSMMU, who match the inclusion and exclusion criteria, were enrolled in the study by non-probability sampling technique. The participants were divided into non-obese (reference) and obese group on the basis of body mass index (BMI) and waist circumference (WC). Individuals with either obese BMI or obese WC or both were included into obese group. A written informed consent was taken from all who agreed to participate in the study.
After giving proper instruction fasting blood sample and an- other blood sample at 2 hours after 75 gm glucose were collected for estimation of fasting lipid profile, fasting plasma glucose, serum creatinine, plasma CRP, serum ferritin, SGPT and post load blood glucose. Obese individuals were classified into three phenotypes which were determined as phenotype A (obese BMI, non-obese WC), phenotype B (non-obese BMI, obese WC) and phenotype C (obese BMI, obese WC) considering BMI ≥25.0 kg/m2 as obese and waist circumference (WC) ≥90 cm as obese in men and ≥80 cm as obese in women. Then TyG index was calculated. Finally association between TyG index with CRP and ferritin was observed among different obesity phenotypes.
Data were cleaned, entered and analyzed by Statistical Package for the Social Sciences (SPSS) software version 26.0. Spearman rank correlation test was done. According to data as needed to achieve level of significance. P-value ≤ 0.05 was considered sta- tistically significant.
3. Results
Table 1. Distribution of subjects with respect to obesity.
Total subjects
Non-obese group (reference group)
Obese Group
Total Obese
Phenotype A
Phenotype B
Phenotype C
512
149
49
92
222
363 (71%)
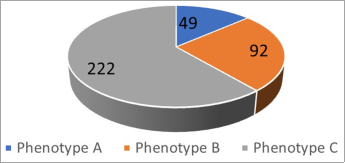
Table 1 shows the distribution of subjects based on obesity, with 512 total subjects, 149 in the non-obese group, and 363 (71%) in the obese group. The obese group is further divided into three phenotypes: A (49 subjects), B (92 subjects), and C (222 subjects).
Figure 1. Distribution of subjects in respect of obesity.
Table 2. Mean±SD of Triglyceride glucose (TyG) index between different obesity phenotypes.
Parameter
Obesity Phenotypes (n = 363)
A (n = 49)
B (n = 92)
C (n = 222)
TyG
8.8 ± 0.4
8.9 ± 0.4
9.2 ± 0.6
Table 2 shows TyG index was elevated in phenotype C in comparison to phenotype A and phenotype B.
Table 3. Mean±SD of CRP between different obesity phenotypes.
Parameter
Obesity Phenotypes (n = 363)
A (n = 49)
B (n = 92)
C (n = 222)
CRP
2.64 ± 2.28
3.32 ± 3.47
6.41 ± 9.43
In Table 3 CRP was elevated in phenotype C in comparison to phenotype A and phenotype B.
Table 4. Mean±SD of ferritin between different obesity phenotypes.
Parameter
Obesity Phenotypes (n = 363)
A (n = 49)
B (n = 92)
C (n = 222)
Ferritin
85.78 ± 91.2
86.89 ± 84.8
149.63 ± 166.2
Table 4 found Ferritin was elevated in phenotype C in comparison to phenotype A and phenotype B.
Table 5. TyG index and inflammatory markers in obesity phenotype A.
Parameters
Correlation Coefficient
p-value
TyG index
CRP
-0.152
0.297
Ferritin
-0.015
0.916
CRP
Ferritin
-0.098
0.503
Spearman rank correlation was done
Table 5 shows, in obesity phenotype A, no significant correlation was found between TyG index and inflammatory markers.
Table 6. TyG index and inflammatory markers in obesity phenotype B.
Parameters
Correlation Coefficient
p-value
TyG index
CRP
-0.010
0.922
Ferritin
0.314
0.002
CRP
Ferritin
-0.087
0.409
Spearman rank correlation was done
Table 6 shows, in obesity phenotype B, a strong positive correlation was found between TyG index and serum ferritin. No significant correlation was found between TyG index and CRP.
Table 7. TyG index and inflammatory markers in obesity phenotype C.
Parameters
Correlation Coefficient
p-value
TyG index
CRP
-0.051
0.447
Ferritin
0.116
0.084
CRP
Ferritin
0.142
0.035
Spearman rank correlation was done
Table 7 shows, in obesity phenotype C, no significant correlation was found between TyG index and inflammatory markers. Very low positive correlation was found between CRP and ferritin.
4. Discussion
Obesity is one of the most challenging public health prob- lems of the 21st century
[13]
World Health Organization (WHO). Obesity and Overweight. Fact Sheet N◦3 20 Available online:
. It has been identified as the fifth leading risk for global deaths
[14]
World Health Organization, Obesity and overweight Fact sheet N°311, (2014).
[14]
. It is one of the major health issues in both developed and developing countries like Bangladesh. The World Health Organization (WHO) Expert Consultation on Obesity has already warned about the escalation of obesity prevalence in developing countries
[15]
Harbuwono Dante S., Laurentius A. Pramono, Em Yunir, Imam Subekti. Obesity and central obesity in Indonesia: evi- dence from a national health survey. Med J Indones.2018; 27: 114.
. Obesity is associated with many co morbidities like, diabetes, hypertension, respiratory diseases, cardiovascular diseases etc. All of these conditions ultimately leads to increased mortality and morbidity.
At present, body mass index (BMI) and waist circumfer- ence (WC) are widely used to define obesity. In our study, we classified different obesity phenotypes according to WHO (2000) criteria for Asia-Pacific region on the basis of BMI and WC
[16]
Gyllenhammer, L. E., Alderete, T. L., Toledo-Corral, C. M., Weigensberg, M., and Goran, M. I. (2016). Saturation of sub- cutaneous adipose tissue expansion and accumulation of ec- topic fat associated with metabolic dysfunction during late and post-pubertal growth. International journal of obesity (2005), 40(4), 601–6.
. Different metabolic risks are associated with different obesity phenotypes. Certain phenotypes are at higher risk than other phenotypes because of variation in insulin sensitivity/ resistance and various inflammatory markers. This study aims to find out the association between TyG index (insulin resistance index) and inflammatory markers (CRP & ferritin).
With this purpose, 512 nondiabetic, normotensive and otherwise apparently healthy individuals were selected from outpatient department of BSMMU. We found, among 512 total study subjects 363 (71%) were obese possessing an obese BMI or an obese WC or both together. This indicates a very high proportion of obese individuals among our study subjects. This might be due to enrollment of subjects from hospital outpatient department (not from general population) where people with obesity related medical problems fre- quently attend.
Among all the obesity phenotypes in this study, TyG index was highest in phenotype C in comparison to phenotype A & B. Subcutaneous adipose tissue in contrast to visceral adipose tissue shows saturation of adipose tissue expansion. Beyond the saturation point, subcutaneous adipose tissue cannot ex- pand anymore and spillover fat for deposition in undesirable non adipose tissue ectopic sites (eg: liver, pancreas etc). This ectopic fat depots results in adverse metabolic profile and insulin resistance
[17]
Park, H. S., and Lee, K. Greater beneficial effects of visceral fat reduction compared with subcutaneous fat reduction on parameters of the metabolic syndrome: a study of weight re- duction programmes in subjects with visceral and subcutane- ous obesity. Diabetic medicine: a journal of the British Dia- betic Association.2005; 22(3), 266–2.
. Individuals in phenotype B associated with higher amount of visceral fat with little subcutaneous fat. Visceral fat increases lipolysis, increases hepatic gluconeo- genesis and glycogenolysis and increases pancreatic insulin secretion resulting in hyperglycemia and hepatic triglyceride production which increases TyG index in phenotype B. TyG index was highest phenotype C in comparison to other phe- notypes because of combined elevation of general and vis- ceral adiposity. In this study, among all the obesity phenotypes, individuals with phenotype C showed higher level of in- flammatory markers (CRP and ferritin). Plasma CRP and serum ferritin level were found to be highest in phenotype C, compared to phenotype A and phenotype B. In subjects of phenotype B, the accumulation of visceral adipose tissue is responsible for the up-regulation of low-grade chronic in- flammation and increases plasma CRP and ferritin
[17]
Park, H. S., and Lee, K. Greater beneficial effects of visceral fat reduction compared with subcutaneous fat reduction on parameters of the metabolic syndrome: a study of weight re- duction programmes in subjects with visceral and subcutane- ous obesity. Diabetic medicine: a journal of the British Dia- betic Association.2005; 22(3), 266–2.
. Ferritin and CRP found to be highest in phenotype C in comparison to other phenotypes because of combined effect of both general and abdominal obesity.
In our study, we observed that there was a moderate posi- tive correlation between TyG index and serum ferritin but not with CRP in subjects in phenotype B. It was due to high vis- ceral fat that increases lipolysis causing hypertriglyceremia as well as altered glucose metabolism and inducing ferritin to act as acute phase protein. Studies have shown that iron regulates the role of insulin in healthy people
[18]
J. M. Fernandez-Real, A. Lopez-Bermejo, and W. Ricart, “Crosstalk between iron metabolism and diabetes,” Diabetes, vol. 51, no. 8, pp. 2348–2354, 2002.
[18]
. Very low positive correlation was found between CRP and ferritin in subjects of phenotype C. This was due to obesity induced low grade inflammation which induces CRP and ferritin to act as acute phase proteins. Again, high ferritin levels without significant iron overload may alter glucose homeostasis, leading to insu- lin resistance and inflammatory changes resulting in elevated CRP levels
[19]
F. Alam, F. Fatima, S. Orakzai, N. Iqbal, and S. S. Fatima, “Ele vated levels of ferritin and hs-CRP in type 2 diabetes,” Journal of the Pakistan Medical Association, vol. 64, no. 12, pp. 1389 1391, 2014.
[19]
. Yu et al., (2020) found that with the increase of the serum ferritin level, the CRP level increased obviously
[20]
Yu L, Yan J, Zhang Q, Lin H, Zhu L, Liu Q, Zhao C. Associa- tion between Serum Ferritin and Blood Lipids: Influence of Diabetes and hs-CRP Levels. J Diabetes Res. 2020 Mar 24; 2020: 41386
The study was conducted in a single hospital with a rela- tively small sample size, which may limit the generalizability of the results to the broader community. Additionally, more accurate methods for measuring body fat, such as MRI or CT scans, were not used, preventing the differentiation of visceral fat from subcutaneous fat in categorizing obesity phenotypes.
6. Conclusion
Phenotype B was found to show significant association of TyG index with serum ferritin. No significant association was found between TyG index and CRP among phenotype A, phenotype B and phenotype C.
Abbreviations
BMI
Body Mass Index
TyG index
Triglyceride-Glucose Index
WC
Waist Circumference
CRP
C-reactive Protein
Acknowledgments
I would like to express my sincere gratitude for the inval- uable support and cooperation provided by the staff, partici- pants, and my co-authors/colleagues who contributed to this study.
Ethical Approval
The study was approved by the Institutional Ethics Com- mittee.
Wallace TM, Levy JC, Matthews DR, Use and abuse of HOMA modeling. Diabetes Care; 2004; 27: 1487–95.
[6]
Unger Gisela, Silvia Fabiana Benozzi, Fernando Perruzza, Graciela Laura Pennacchiotti, Triglycerides and glucose index: a useful indicator of insulin resistance; Endonu- 2014; 621; No. of Pages 8;
Longo M., et al. Adipose tissue dysfunction as determinant of obesity-associated metabolic complications. Int. J. Mol. Sci. 2019; 20(9).
[8]
Belfki, H., Ben Ali, S., Bougatef, S., Ben Ahmed, D., Haddad, N., Jmal, A. et al. Association between C-reactive protein and type 2 diabetes in a Tunisian population. Inflammation. 2012; 35(2): 684–6.
Zafon C, Lecube A, Simo R. Iron in obesity. An ancient mi- cronutrient for a modern disease. Obes Rev.2010; (11): 322-328.
[11]
Kratz A, Ferraro M, Sluss PM, Lewandrowski KB. Case rec- ords of the Massachusetts General Hospital. Weekly clinico- pathological exercises. Laboratory reference values. N Engl J Med. 2004; 351: 1548–15.
[12]
Ardern, C. I., Katzmarzyk, P. T., Janssen, I. and Ross, R, (2003), Discrimination of health risk by combined body mass index and waist circumference. Obesity research, 11(1), 135-1
World Health Organization, Obesity and overweight Fact sheet N°311, (2014).
[15]
Harbuwono Dante S., Laurentius A. Pramono, Em Yunir, Imam Subekti. Obesity and central obesity in Indonesia: evi- dence from a national health survey. Med J Indones.2018; 27: 114.
Gyllenhammer, L. E., Alderete, T. L., Toledo-Corral, C. M., Weigensberg, M., and Goran, M. I. (2016). Saturation of sub- cutaneous adipose tissue expansion and accumulation of ec- topic fat associated with metabolic dysfunction during late and post-pubertal growth. International journal of obesity (2005), 40(4), 601–6.
Park, H. S., and Lee, K. Greater beneficial effects of visceral fat reduction compared with subcutaneous fat reduction on parameters of the metabolic syndrome: a study of weight re- duction programmes in subjects with visceral and subcutane- ous obesity. Diabetic medicine: a journal of the British Dia- betic Association.2005; 22(3), 266–2.
J. M. Fernandez-Real, A. Lopez-Bermejo, and W. Ricart, “Crosstalk between iron metabolism and diabetes,” Diabetes, vol. 51, no. 8, pp. 2348–2354, 2002.
[19]
F. Alam, F. Fatima, S. Orakzai, N. Iqbal, and S. S. Fatima, “Ele vated levels of ferritin and hs-CRP in type 2 diabetes,” Journal of the Pakistan Medical Association, vol. 64, no. 12, pp. 1389 1391, 2014.
[20]
Yu L, Yan J, Zhang Q, Lin H, Zhu L, Liu Q, Zhao C. Associa- tion between Serum Ferritin and Blood Lipids: Influence of Diabetes and hs-CRP Levels. J Diabetes Res. 2020 Mar 24; 2020: 41386
Brishti, T. W., Hoque, M., Moyenullah, M., Alam, A. (2024). Association of Triglyceride/Glucose Index with CRP and Ferritin Among Different Obesity Phenotypes of Non-diabetic Adult Bangladeshi. Advances in Biochemistry, 12(3), 112-117. https://doi.org/10.11648/j.ab.20241203.14
Brishti, T. W.; Hoque, M.; Moyenullah, M.; Alam, A. Association of Triglyceride/Glucose Index with CRP and Ferritin Among Different Obesity Phenotypes of Non-diabetic Adult Bangladeshi. Adv. Biochem.2024, 12(3), 112-117. doi: 10.11648/j.ab.20241203.14
Brishti TW, Hoque M, Moyenullah M, Alam A. Association of Triglyceride/Glucose Index with CRP and Ferritin Among Different Obesity Phenotypes of Non-diabetic Adult Bangladeshi. Adv Biochem. 2024;12(3):112-117. doi: 10.11648/j.ab.20241203.14
@article{10.11648/j.ab.20241203.14,
  author = {Tanha Waheed Brishti and Mozammel Hoque and Mohammad Moyenullah and Azmeri Alam},
  title = {Association of Triglyceride/Glucose Index with CRP and Ferritin Among Different Obesity Phenotypes of Non-diabetic Adult Bangladeshi
},
  journal = {Advances in Biochemistry},
  volume = {12},
  number = {3},
  pages = {112-117},
  doi = {10.11648/j.ab.20241203.14},
  url = {https://doi.org/10.11648/j.ab.20241203.14},
  eprint = {https://article.sciencepublishinggroup.com/pdf/10.11648.j.ab.20241203.14},
  abstract = {Introduction: Obesity is an alarming problem worldwide and it antedates insulin resistance (IR) as well as inflammation. Considering financial condition of Bangladesh, TyG index can be used for assessment of insulin resistance. As CRP and ferritin usually respond to any inflammatory condition, they are expected to be raised in obesity. Early detection of association between TyG index and inflammatory markers (CRP & ferritin) can help in prediction of severity of obesity induced health risks. Materials and Methods: A cross sectional analytical study was conducted in the Department of Biochemistry and Molecular Biology, (BSMMU) from March, 2022 to February, 2023. BMI was calculated, and individuals were classified into three obesity phenotypes: phenotype A (obese BMI, non-obese WC), phenotype B (non-obese BMI, obese WC), and phenotype C (obese BMI, obese WC). The Triglyceride-Glucose (TyG) index, serum ferritin, and CRP were assessed, and their correlations were analyzed across different obesity phenotypes. Results: TyG index was significantly higher in phenotype C compared to A & B. Plasma CRP and ferritin level were found to be highest in phenotype C in comparison to phenotype A and phenotype B. A moderate positive correlation was found between TyG index and serum ferritin but not with CRP in subjects belonging phenotype B. Very low positive correlation was found between CRP and ferritin in subjects of phenotype C. Conclusion: A significant association was shown between TyG index and serum ferritin among phenotype B. Plasma CRP showed no significant association with TyG index among different obesity phenotypes.
},
 year = {2024}
}
TY  - JOUR
T1  - Association of Triglyceride/Glucose Index with CRP and Ferritin Among Different Obesity Phenotypes of Non-diabetic Adult Bangladeshi

AU  - Tanha Waheed Brishti
AU  - Mozammel Hoque
AU  - Mohammad Moyenullah
AU  - Azmeri Alam
Y1  - 2024/09/26
PY  - 2024
N1  - https://doi.org/10.11648/j.ab.20241203.14
DO  - 10.11648/j.ab.20241203.14
T2  - Advances in Biochemistry
JF  - Advances in Biochemistry
JO  - Advances in Biochemistry
SP  - 112
EP  - 117
PB  - Science Publishing Group
SN  - 2329-0862
UR  - https://doi.org/10.11648/j.ab.20241203.14
AB  - Introduction: Obesity is an alarming problem worldwide and it antedates insulin resistance (IR) as well as inflammation. Considering financial condition of Bangladesh, TyG index can be used for assessment of insulin resistance. As CRP and ferritin usually respond to any inflammatory condition, they are expected to be raised in obesity. Early detection of association between TyG index and inflammatory markers (CRP & ferritin) can help in prediction of severity of obesity induced health risks. Materials and Methods: A cross sectional analytical study was conducted in the Department of Biochemistry and Molecular Biology, (BSMMU) from March, 2022 to February, 2023. BMI was calculated, and individuals were classified into three obesity phenotypes: phenotype A (obese BMI, non-obese WC), phenotype B (non-obese BMI, obese WC), and phenotype C (obese BMI, obese WC). The Triglyceride-Glucose (TyG) index, serum ferritin, and CRP were assessed, and their correlations were analyzed across different obesity phenotypes. Results: TyG index was significantly higher in phenotype C compared to A & B. Plasma CRP and ferritin level were found to be highest in phenotype C in comparison to phenotype A and phenotype B. A moderate positive correlation was found between TyG index and serum ferritin but not with CRP in subjects belonging phenotype B. Very low positive correlation was found between CRP and ferritin in subjects of phenotype C. Conclusion: A significant association was shown between TyG index and serum ferritin among phenotype B. Plasma CRP showed no significant association with TyG index among different obesity phenotypes.

VL  - 12
IS  - 3
ER  -
Department of Biochemistry, Green Life Medical College and Hospital, Dhaka, Bangladesh
Research Fields:
Tanha Waheed Brishti: Bangabandhu Sheikh Mujib Medical University, Dhaka, Bangladesh, Green Life Medical College & Hospital, Dhaka, Bangladesh
Department of Biochemistry, Bangabandhu Sheikh Mujib Medical University, Dhaka, Bangladesh
Research Fields:
Mozammel Hoque: Bangabandhu Sheikh Mujib Medical Uni- versity, Dhaka, Bangladesh, Green Life Medical College & Hospi- tal, Dhaka, Bangladesh
Department of Burn and Plastic surgery, Dhaka Medical College Hospital, Dhaka, Bangladesh
Research Fields:
Mohammad Moyenullah: Bangabandhu Sheikh Mujib Medical University, Dhaka, Bangladesh, Green Life Medical College & Hospital, Dhaka, Bangladesh
Brishti, T. W., Hoque, M., Moyenullah, M., Alam, A. (2024). Association of Triglyceride/Glucose Index with CRP and Ferritin Among Different Obesity Phenotypes of Non-diabetic Adult Bangladeshi. Advances in Biochemistry, 12(3), 112-117. https://doi.org/10.11648/j.ab.20241203.14
Brishti, T. W.; Hoque, M.; Moyenullah, M.; Alam, A. Association of Triglyceride/Glucose Index with CRP and Ferritin Among Different Obesity Phenotypes of Non-diabetic Adult Bangladeshi. Adv. Biochem.2024, 12(3), 112-117. doi: 10.11648/j.ab.20241203.14
Brishti TW, Hoque M, Moyenullah M, Alam A. Association of Triglyceride/Glucose Index with CRP and Ferritin Among Different Obesity Phenotypes of Non-diabetic Adult Bangladeshi. Adv Biochem. 2024;12(3):112-117. doi: 10.11648/j.ab.20241203.14
@article{10.11648/j.ab.20241203.14,
  author = {Tanha Waheed Brishti and Mozammel Hoque and Mohammad Moyenullah and Azmeri Alam},
  title = {Association of Triglyceride/Glucose Index with CRP and Ferritin Among Different Obesity Phenotypes of Non-diabetic Adult Bangladeshi
},
  journal = {Advances in Biochemistry},
  volume = {12},
  number = {3},
  pages = {112-117},
  doi = {10.11648/j.ab.20241203.14},
  url = {https://doi.org/10.11648/j.ab.20241203.14},
  eprint = {https://article.sciencepublishinggroup.com/pdf/10.11648.j.ab.20241203.14},
  abstract = {Introduction: Obesity is an alarming problem worldwide and it antedates insulin resistance (IR) as well as inflammation. Considering financial condition of Bangladesh, TyG index can be used for assessment of insulin resistance. As CRP and ferritin usually respond to any inflammatory condition, they are expected to be raised in obesity. Early detection of association between TyG index and inflammatory markers (CRP & ferritin) can help in prediction of severity of obesity induced health risks. Materials and Methods: A cross sectional analytical study was conducted in the Department of Biochemistry and Molecular Biology, (BSMMU) from March, 2022 to February, 2023. BMI was calculated, and individuals were classified into three obesity phenotypes: phenotype A (obese BMI, non-obese WC), phenotype B (non-obese BMI, obese WC), and phenotype C (obese BMI, obese WC). The Triglyceride-Glucose (TyG) index, serum ferritin, and CRP were assessed, and their correlations were analyzed across different obesity phenotypes. Results: TyG index was significantly higher in phenotype C compared to A & B. Plasma CRP and ferritin level were found to be highest in phenotype C in comparison to phenotype A and phenotype B. A moderate positive correlation was found between TyG index and serum ferritin but not with CRP in subjects belonging phenotype B. Very low positive correlation was found between CRP and ferritin in subjects of phenotype C. Conclusion: A significant association was shown between TyG index and serum ferritin among phenotype B. Plasma CRP showed no significant association with TyG index among different obesity phenotypes.
},
 year = {2024}
}
TY  - JOUR
T1  - Association of Triglyceride/Glucose Index with CRP and Ferritin Among Different Obesity Phenotypes of Non-diabetic Adult Bangladeshi

AU  - Tanha Waheed Brishti
AU  - Mozammel Hoque
AU  - Mohammad Moyenullah
AU  - Azmeri Alam
Y1  - 2024/09/26
PY  - 2024
N1  - https://doi.org/10.11648/j.ab.20241203.14
DO  - 10.11648/j.ab.20241203.14
T2  - Advances in Biochemistry
JF  - Advances in Biochemistry
JO  - Advances in Biochemistry
SP  - 112
EP  - 117
PB  - Science Publishing Group
SN  - 2329-0862
UR  - https://doi.org/10.11648/j.ab.20241203.14
AB  - Introduction: Obesity is an alarming problem worldwide and it antedates insulin resistance (IR) as well as inflammation. Considering financial condition of Bangladesh, TyG index can be used for assessment of insulin resistance. As CRP and ferritin usually respond to any inflammatory condition, they are expected to be raised in obesity. Early detection of association between TyG index and inflammatory markers (CRP & ferritin) can help in prediction of severity of obesity induced health risks. Materials and Methods: A cross sectional analytical study was conducted in the Department of Biochemistry and Molecular Biology, (BSMMU) from March, 2022 to February, 2023. BMI was calculated, and individuals were classified into three obesity phenotypes: phenotype A (obese BMI, non-obese WC), phenotype B (non-obese BMI, obese WC), and phenotype C (obese BMI, obese WC). The Triglyceride-Glucose (TyG) index, serum ferritin, and CRP were assessed, and their correlations were analyzed across different obesity phenotypes. Results: TyG index was significantly higher in phenotype C compared to A & B. Plasma CRP and ferritin level were found to be highest in phenotype C in comparison to phenotype A and phenotype B. A moderate positive correlation was found between TyG index and serum ferritin but not with CRP in subjects belonging phenotype B. Very low positive correlation was found between CRP and ferritin in subjects of phenotype C. Conclusion: A significant association was shown between TyG index and serum ferritin among phenotype B. Plasma CRP showed no significant association with TyG index among different obesity phenotypes.

VL  - 12
IS  - 3
ER  -