One of the foundational tasks in statistical analysis is the design and implementation of sample surveys, which involve sampling error that affects the reliability and precision of the resulting estimates. Measures such as totals and means are insufficient on their own without corresponding indicators of statistical precision, such as confidence intervals. As such, any analytical method applied to survey data must accommodate data weighting, which is essential for producing valid and interpretable estimates. Within the field of economic research, income inequality represents a key application where the use of weighted data is critical. In this context, we introduce a weighted inequality index designed to improve the robustness of inequality measurement. To enhance its analytical rigor, the proposed index is accompanied by a non-parametric, bootstrap-based algorithm, designed to facilitate comparative assessments and statistical significance testing across various population subgroups (e.g., regions, countries, gender). A major advantage of this approach lies in its flexibility; it is suitable for both normally and non-normally distributed data, thereby broadening its applicability to real-world datasets that often deviate from standard distributional assumptions. To demonstrate the empirical utility and comparative performance of the proposed methodology, we applied it to household income data obtained from the Central Agency for Public Mobilization and Statistics (CAPMAS), based on nationally representative income and expenditure surveys conducted in 2015 and 2018. The empirical findings revealed a general decline in the values of the proposed inequality index across most Egyptian governorates between 2015 and 2018, indicating a modest trend toward greater income equality. This downward shift may be indicative of the effects of socioeconomic reform measures and targeted development policies aimed at reducing regional disparities. The results validate the practical relevance of the proposed index as a reliable tool for evaluating income inequality in diverse socioeconomic contexts.
| Published in | American Journal of Applied Mathematics (Volume 13, Issue 4) |
| DOI | 10.11648/j.ajam.20251304.13 |
| Page(s) | 256-273 |
| Creative Commons |
This is an Open Access article, distributed under the terms of the Creative Commons Attribution 4.0 International License (http://creativecommons.org/licenses/by/4.0/), which permits unrestricted use, distribution and reproduction in any medium or format, provided the original work is properly cited. |
| Copyright |
Copyright © The Author(s), 2025. Published by Science Publishing Group |
Weighted Data, Symmetry Index, Inequality Measurements
Governorates | n | Min | Q1 | Q2 | Mean | Q3 | Max | SD |
|---|---|---|---|---|---|---|---|---|
Cairo | 748 | 1336.1 | 7107.96 | 11280.12 | 19049.72 | 19866.25 | 916250.0 | 39696.90 |
Alexandria | 492 | 2173.67 | 7361.35 | 10336.42 | 14005.88 | 15334.68 | 130797.8 | 12291.76 |
Port Said | 495 | 3682.83 | 9608.19 | 14063.50 | 16980.28 | 19385.60 | 177975.0 | 13370.47 |
Suez | 476 | 3142.22 | 7332.88 | 10843.09 | 13862.48 | 16857.52 | 105000.0 | 10575.04 |
Damietta | 479 | 2120.35 | 6402.94 | 8711.80 | 10372.19 | 12112.13 | 52562.75 | 6111.36 |
Dakahlia | 624 | 3292.17 | 7557.79 | 10203.10 | 12730.41 | 14737.00 | 92822.0 | 9017.83 |
Sharqia | 610 | 2771.17 | 7586.75 | 9876.95 | 12377.54 | 14260.88 | 159408.0 | 9481.45 |
Qalyub | 501 | 2827.50 | 6848.30 | 9102.10 | 15877.66 | 12872.75 | 2354545.0 | 105048.92 |
Kafr el-Sheikh | 476 | 2628.57 | 6478.94 | 8797.78 | 10634.75 | 12274.15 | 68097.3 | 6993.60 |
Gharbia | 486 | 2956.98 | 6572.58 | 8938.17 | 11499.33 | 12375.38 | 112229.4 | 10213.32 |
Monufia | 502 | 3548.57 | 7518.55 | 10300.75 | 12354.97 | 14260.35 | 60910.5 | 7646.83 |
Beheira | 535 | 2985.00 | 6209.13 | 8385.37 | 9957.76 | 11901.14 | 62520.0 | 6200.92 |
Ismailia | 483 | 3081.17 | 6864.69 | 9449.08 | 12505.66 | 14469.63 | 306785.0 | 15541.47 |
Giza | 687 | 1599.00 | 5849.38 | 8054.70 | 10019.97 | 11768.52 | 81000.0 | 7257.17 |
Beni Suef | 495 | 2189.30 | 5286.45 | 7130.40 | 9076.13 | 10626.60 | 54267.1 | 6497.41 |
Fayyum | 497 | 2735.17 | 6002.17 | 7985.50 | 10183.84 | 11536.50 | 59863.0 | 7196.12 |
Al-Minya | 495 | 1925.57 | 4906.68 | 6684.17 | 8824.50 | 9706.48 | 162750.0 | 9745.50 |
Asyut | 487 | 1773.40 | 4601.38 | 6600.50 | 8135.51 | 9227.39 | 46698.50 | 5852.31 |
Sohag | 489 | 1280.41 | 3963.71 | 5666.38 | 6972.70 | 8127.59 | 33044.3 | 4754.03 |
Qena | 491 | 2161.79 | 5284.44 | 7241.80 | 9000.85 | 10829.68 | 53000.0 | 6143.10 |
Aswan | 474 | 2423.69 | 6188.77 | 8368.74 | 10206.74 | 12166.49 | 73900.0 | 7012.86 |
Luxor | 500 | 2923.58 | 5511.27 | 7228.02 | 8329.90 | 10001.84 | 32536.3 | 4195.18 |
Border cities in Egypt | 466 | 1794.77 | 7891.03 | 11295.66 | 13323.02 | 16036.86 | 61570.0 | 8220.54 |
Governorates | n | Min | Q1 | Q2 | Mean | Q3 | Max | SD |
|---|---|---|---|---|---|---|---|---|
Cairo | 1233 | 2771.88 | 9787.50 | 15249.75 | 23989.78 | 25225.50 | 1068571.0 | 43218.30 |
Alexandria | 523 | 3303.75 | 10861.52 | 15750.00 | 21921.01 | 23675.50 | 444000.0 | 26473.185 |
Port Said | 490 | 4535.83 | 14438.50 | 19958.63 | 26137.79 | 30291.12 | 675682.5 | 34286.308 |
Suez | 455 | 2337.88 | 9658.00 | 15626.00 | 20420.03 | 23996.67 | 148500.0 | 17739.371 |
Damietta | 482 | 4323.00 | 9588.75 | 12679.00 | 15191.59 | 17948.62 | 62633.0 | 8489.200 |
Dakahlia | 632 | 5328.75 | 11051.76 | 14435.63 | 17701.50 | 20195.80 | 204325.0 | 13121.02 |
Sharqia | 613 | 2982.50 | 10039.20 | 13087.50 | 17706.96 | 19287.50 | 435961.7 | 24826.65 |
Qalyub | 504 | 3508.00 | 9216.46 | 12713.00 | 15198.60 | 18172.87 | 122125.0 | 9763.45 |
Kafr el-Sheikh | 490 | 3409.57 | 10058.42 | 13804.35 | 17413.03 | 20183.50 | 267600.0 | 15758.17 |
Gharbia | 490 | 2469.00 | 11280.45 | 15368.45 | 18914.00 | 21979.00 | 104379.0 | 12828.95 |
Monufia | 513 | 3570.60 | 7898.75 | 10908.00 | 13454.73 | 16083.40 | 125896.0 | 10036.98 |
Beheira | 552 | 3604.20 | 7535.04 | 10082.78 | 13495.46 | 14824.95 | 491875.0 | 22109.64 |
Ismailia | 490 | 3457.60 | 8828.30 | 12050.00 | 14922.82 | 18096.65 | 83877.0 | 9455.73 |
Giza | 682 | 3974.17 | 9481.44 | 12853.30 | 15911.40 | 18176.50 | 167430.0 | 11916.45 |
Beni Suef | 497 | 3543.50 | 8603.71 | 11137.00 | 13792.62 | 15991.60 | 95562.5 | 9168.16 |
Fayyum | 484 | 2658.00 | 8695.70 | 11685.10 | 14137.78 | 16591.50 | 60989.0 | 8619.12 |
Al-Minya | 494 | 2567.11 | 7060.75 | 9728.50 | 12335.97 | 14318.70 | 107237.0 | 9437.94 |
Asyut | 492 | 1907.71 | 6007.25 | 8398.84 | 10860.15 | 13408.47 | 55215.0 | 7780.99 |
Sohag | 494 | 3308.33 | 6897.06 | 9493.75 | 11402.59 | 13248.38 | 86468.0 | 7404.11 |
Qena | 493 | 2735.78 | 7677.00 | 11131.20 | 13757.27 | 16425.80 | 229234.0 | 12863.13 |
Aswan | 492 | 2790.13 | 7496.40 | 10412.05 | 12617.66 | 15023.50 | 60602.0 | 8137.25 |
Luxor | 498 | 3218.71 | 7599.33 | 9739.85 | 11595.78 | 14237.00 | 65017.0 | 6031.05 |
Border cities in Egypt | 392 | 3063.09 | 8848.63 | 11965.57 | 15582.25 | 17533.75 | 117494.0 | 12762.65 |
Governorates | GI |
| AT | PI | AF | TT | TL | GE | LI |
|---|---|---|---|---|---|---|---|---|---|
Cairo | 0.496 | 2.243 | 0.339 | 3.043 | 0.026 | 0.588 | 0.414 | 0.456 | 0.667 |
Alexandria | 0.368 | 1.835 | 0.196 | 1.586 | 0.105 | 0.254 | 0.218 | 0.228 | 0.667 |
Port Said | 0.329 | 1.957 | 0.162 | 1.323 | 0.085 | 0.203 | 0.176 | 0.184 | 0.668 |
Suez | 0.346 | 1.696 | 0.176 | 1.403 | 0.126 | 0.212 | 0.193 | 0.197 | 0.668 |
Damietta | 0.288 | 1.484 | 0.125 | 1.045 | 0.161 | 0.142 | 0.134 | 0.136 | 0.667 |
Dakahlia | 0.311 | 1.634 | 0.144 | 1.195 | 0.117 | 0.178 | 0.155 | 0.163 | 0.668 |
Sharqia | 0.300 | 1.677 | 0.136 | 1.137 | 0.063 | 0.176 | 0.146 | 0.156 | 0.668 |
Qalyub | 0.508 | 2.388 | 0.388 | 3.039 | 0.008 | 1.365 | 0.490 | 0.687 | 0.667 |
Kafr el-Sheikh | 0.296 | 1.810 | 0.131 | 1.118 | 0.129 | 0.160 | 0.140 | 0.147 | 0.668 |
Gharbia | 0.339 | 1.802 | 0.171 | 1.402 | 0.092 | 0.233 | 0.188 | 0.203 | 0.667 |
Monufia | 0.294 | 1.698 | 0.129 | 1.094 | 0.172 | 0.151 | 0.138 | 0.142 | 0.668 |
Beheira | 0.281 | 1.587 | 0.119 | 1.019 | 0.126 | 0.143 | 0.127 | 0.132 | 0.668 |
Ismailia | 0.347 | 1.673 | 0.182 | 1.438 | 0.037 | 0.277 | 0.200 | 0.223 | 0.669 |
Giza | 0.322 | 1.629 | 0.156 | 1.245 | 0.109 | 0.187 | 0.169 | 0.174 | 0.667 |
Beni Suef | 0.320 | 1.694 | 0.151 | 1.258 | 0.148 | 0.186 | 0.164 | 0.171 | 0.668 |
Fayyum | 0.322 | 1.630 | 0.153 | 1.245 | 0.151 | 0.186 | 0.165 | 0.171 | 0.668 |
Al-Minya | 0.354 | 1.826 | 0.188 | 1.498 | 0.050 | 0.279 | 0.209 | 0.231 | 0.668 |
Asyut | 0.330 | 1.843 | 0.160 | 1.308 | 0.159 | 0.193 | 0.175 | 0.179 | 0.668 |
Sohag | 0.319 | 1.628 | 0.151 | 1.230 | 0.188 | 0.179 | 0.164 | 0.168 | 0.668 |
Qena | 0.310 | 1.524 | 0.144 | 1.174 | 0.148 | 0.173 | 0.155 | 0.160 | 0.667 |
Aswan | 0.310 | 1.593 | 0.144 | 1.170 | 0.120 | 0.172 | 0.156 | 0.160 | 0.668 |
Luxor | 0.251 | 1.582 | 0.094 | 0.872 | 0.194 | 0.106 | 0.099 | 0.101 | 0.669 |
Border cities in Egypt | 0.306 | 1.422 | 0.144 | 1.127 | 0.186 | 0.158 | 0.155 | 0.153 | 0.668 |
Governorates | Mean () | Lower CI | Upper CI |
|---|---|---|---|
Cairo | 2.23 | 1.89 | 2.60 |
Alexandria | 1.85 | 1.62 | 2.10 |
Port Said | 1.91 | 1.66 | 2.17 |
Suez | 1.69 | 1.49 | 1.92 |
Damietta | 1.48 | 1.32 | 1.66 |
Dakahlia | 1.63 | 1.46 | 1.82 |
Sharqia | 1.67 | 1.46 | 1.90 |
Qalyub | 2.15 | 1.45 | 2.74 |
Kafr el-Sheikh | 1.78 | 1.57 | 2.02 |
Gharbia | 1.84 | 1.60 | 2.08 |
Monufia | 1.70 | 1.46 | 1.91 |
Beheira | 1.59 | 1.40 | 1.79 |
Ismailia | 1.71 | 1.40 | 2.06 |
Giza | 1.61 | 1.43 | 1.80 |
Beni Suef | 1.68 | 1.48 | 1.90 |
Fayyum | 1.65 | 1.45 | 1.87 |
Al-Minya | 1.79 | 1.53 | 2.10 |
Asyut | 1.77 | 1.57 | 2.00 |
Sohag | 1.69 | 1.48 | 1.94 |
Qena | 1.56 | 1.36 | 1.77 |
Aswan | 1.57 | 1.36 | 1.79 |
Luxor | 1.55 | 1.37 | 1.78 |
Border cities in Egypt | 1.46 | 1.26 | 1.67 |
Governorates | GI | AT | PI | AF | TT | TL | GE | LI | |
|---|---|---|---|---|---|---|---|---|---|
Cairo | 0.469 | 2.104 | 0.309 | 2.674 | 0.027 | 0.510 | 0.370 | 0.404 | 0.664 |
Alexandria | 0.396 | 1.972 | 0.228 | 1.843 | 0.050 | 0.334 | 0.259 | 0.280 | 0.667 |
Port Said | 0.352 | 1.712 | 0.190 | 1.466 | 0.036 | 0.295 | 0.210 | 0.234 | 0.668 |
Suez | 0.378 | 1.789 | 0.209 | 1.670 | 0.140 | 0.259 | 0.234 | 0.239 | 0.667 |
Damietta | 0.276 | 1.541 | 0.113 | 0.993 | 0.196 | 0.129 | 0.120 | 0.123 | 0.668 |
Dakahlia | 0.291 | 1.671 | 0.129 | 1.089 | 0.068 | 0.168 | 0.138 | 0.148 | 0.668 |
Sharqia | 0.348 | 1.809 | 0.186 | 1.439 | 0.036 | 0.312 | 0.206 | 0.238 | 0.666 |
Qalyub | 0.295 | 1.621 | 0.130 | 1.082 | 0.103 | 0.154 | 0.140 | 0.143 | 0.667 |
Kafr el-Sheikh | 0.332 | 1.681 | 0.166 | 1.308 | 0.058 | 0.219 | 0.181 | 0.192 | 0.667 |
Gharbia | 0.315 | 1.652 | 0.147 | 1.216 | 0.156 | 0.175 | 0.160 | 0.164 | 0.668 |
Monufia | 0.319 | 1.508 | 0.153 | 1.214 | 0.094 | 0.187 | 0.166 | 0.171 | 0.669 |
Beheira | 0.348 | 1.893 | 0.187 | 1.463 | 0.025 | 0.332 | 0.207 | 0.243 | 0.667 |
Ismailia | 0.304 | 1.577 | 0.136 | 1.123 | 0.154 | 0.158 | 0.146 | 0.150 | 0.666 |
Giza | 0.310 | 1.748 | 0.144 | 1.202 | 0.080 | 0.183 | 0.155 | 0.164 | 0.666 |
Beni Suef | 0.297 | 1.587 | 0.132 | 1.120 | 0.119 | 0.161 | 0.141 | 0.148 | 0.668 |
Fayyum | 0.301 | 1.555 | 0.136 | 1.126 | 0.197 | 0.153 | 0.146 | 0.147 | 0.668 |
Al-Minya | 0.330 | 1.656 | 0.162 | 1.314 | 0.103 | 0.202 | 0.177 | 0.184 | 0.668 |
Asyut | 0.339 | 1.586 | 0.169 | 1.361 | 0.186 | 0.199 | 0.185 | 0.188 | 0.667 |
Sohag | 0.293 | 1.634 | 0.128 | 1.089 | 0.108 | 0.154 | 0.137 | 0.142 | 0.669 |
Qena | 0.329 | 1.720 | 0.164 | 1.278 | 0.054 | 0.218 | 0.179 | 0.190 | 0.667 |
Aswan | 0.312 | 1.625 | 0.144 | 1.195 | 0.184 | 0.166 | 0.156 | 0.158 | 0.668 |
Luxor | 0.261 | 1.310 | 0.102 | 0.887 | 0.137 | 0.114 | 0.108 | 0.109 | 0.667 |
Border cities in Egypt | 0.342 | 1.584 | 0.174 | 1.426 | 0.122 | 0.223 | 0.192 | 0.201 | 0.668 |
Governorates | Mean () | Lower CI | Upper CI |
|---|---|---|---|
Cairo | 2.07 | 1.86 | 2.32 |
Alexandria | 1.93 | 1.67 | 2.26 |
Port Said | 1.70 | 1.36 | 2.09 |
Suez | 1.77 | 1.55 | 2.05 |
Damietta | 1.58 | 1.41 | 1.79 |
Dakahlia | 1.69 | 1.47 | 1.91 |
Sharqia | 1.76 | 1.45 | 2.11 |
Qalyub | 1.61 | 1.41 | 1.84 |
Kafr el-Sheikh | 1.71 | 1.43 | 1.96 |
Gharbia | 1.62 | 1.43 | 1.85 |
Monufia | 1.52 | 1.33 | 1.72 |
Beheira | 1.87 | 1.53 | 2.30 |
Ismailia | 1.57 | 1.37 | 1.78 |
Giza | 1.73 | 1.53 | 1.95 |
Beni Suef | 1.63 | 1.39 | 1.93 |
Fayyum | 1.56 | 1.39 | 1.75 |
Al-Minya | 1.67 | 1.47 | 1.90 |
Asyut | 1.62 | 1.44 | 1.84 |
Sohag | 1.60 | 1.41 | 1.81 |
Qena | 1.73 | 1.42 | 2.11 |
Aswan | 1.62 | 1.41 | 1.90 |
Luxor | 1.32 | 1.16 | 1.50 |
Border cities in Egypt | 1.63 | 1.39 | 1.93 |
GI | Gini Index |
AT | Atkinson Index |
EDE | An Equivalent Level of Equal Distribution |
Ε | The Parameter of Inequality Degree |
GE | The Class of Generalized Entropy Indices |
and | Theil Indices |
PI | Palma Index |
AF | Allison and Foster index |
LI | Leti Index |
The Proposed Index (Symmetry Weighted Index) |
| [1] | Allison, R. A., & Foster, J. E. (2004). Measuring health inequality using qualitative data. Journal of health economics, 23(3), 505-524. |
| [2] | Atkinson, A. B. (1970). On the measurement of inequality. Journal of economic theory, 2(3), 244-263. |
| [3] | Authority, A. M. S. (2011). Canberra, Australia. |
| [4] | Deiwiks, C., Cederman, L. E., & Gleditsch, K. S. (2012). Inequality and conflict in federations. Journal of Peace Research, 49(2), 289-304. |
| [5] | Doran, J., & Jordan, D. (2013). Decomposing European NUTS2 regional inequality from 1980 to 2009: National and European policy implications. Journal of Economic Studies, 40(1), 22-38. |
| [6] | Dutta, I., & Foster, J. (2013). Inequality of happiness in the US: 1972-2010. Review of Income and Wealth, 59(3), 393-415. |
| [7] | Eman, M. H., Hend, A. A., & Ibrahim, H. I. (2025). New Symmetry Index Based on Gini Mean Difference. American Journal of Applied Mathematics, 13(2), 125-142. |
| [8] | Ezcurra, R. & Rodríguez-Pose, A. (2014). Trade openness and spatial inequality in emerging countries, Spatial Economic Analysis, 9, 162-201. |
| [9] | Gini, C. (1912), “Variabilità e mutabilità”, in Pizetti, E. and Salvemini, T. (eds.) Memorie di Metodologia Statistica, Vol. 1: Variabilità e Concentrazione, Libreria Eredi Virgilio Veschi, Rome, 211-382. |
| [10] | Leti G. (1983). Statistica descrittiva, il Mulino, Bologna. ISBN: 8-8150-0278-2. |
| [11] | Lorenz, M. O. (1905). Methods of measuring the concentration of wealth. Publications of the American statistical association, 9(70), 209-219. |
| [12] | Palma, J. G. (2011). Homogeneous middles vs. heterogeneous tails, and the end of the ‘inverted‐U’: It's all about the share of the rich. development and Change, 42(1), 87-153. |
| [13] | Shorrocks, A. F. (1980). The class of additively decomposable inequality measures. Econometrica: Journal of the Econometric Society, 613-625. |
| [14] | Sebastian, W., Agnieszka, G., Katarzyna, M., & Jarosław, N. (2024). Package ‘wINEQ’: Inequality Measures for Weighted Data. |
| [15] | Theil, H. (1967). Economics and Information Theory, North Holland. |
| [16] | Hlasny, V., & Verme, P. (2018). Top incomes and the measurement of inequality in Egypt. The World Bank Economic Review, 32(2), 428-455. |
| [17] | Williamson, J. G. (1965). Regional inequality and the process of national development: a description of the patterns. Economic development and cultural change, 13(4, Part 2), 1-84. |
| [18] | Zubarevich, N. V., & Safronov, S. G. (2011). Regional inequality in large post-Soviet countries. Regional Research of Russia, 1, 15-26. |
APA Style
Hanafy, E. M., Auda, H. A., Ibrahim, I. H. (2025). Measuring Inequality of Income Distributions in Egypt: An Empirical Study Using Weighted and Non-parametric Methods. American Journal of Applied Mathematics, 13(4), 256-273. https://doi.org/10.11648/j.ajam.20251304.13
ACS Style
Hanafy, E. M.; Auda, H. A.; Ibrahim, I. H. Measuring Inequality of Income Distributions in Egypt: An Empirical Study Using Weighted and Non-parametric Methods. Am. J. Appl. Math. 2025, 13(4), 256-273. doi: 10.11648/j.ajam.20251304.13
@article{10.11648/j.ajam.20251304.13,
  author = {Eman Mohamed Hanafy and Hend Abdulghaffar Auda and Ibrahim Hassan Ibrahim},
  title = {Measuring Inequality of Income Distributions in Egypt: An Empirical Study Using Weighted and Non-parametric Methods
},
  journal = {American Journal of Applied Mathematics},
  volume = {13},
  number = {4},
  pages = {256-273},
  doi = {10.11648/j.ajam.20251304.13},
  url = {https://doi.org/10.11648/j.ajam.20251304.13},
  eprint = {https://article.sciencepublishinggroup.com/pdf/10.11648.j.ajam.20251304.13},
  abstract = {One of the foundational tasks in statistical analysis is the design and implementation of sample surveys, which involve sampling error that affects the reliability and precision of the resulting estimates. Measures such as totals and means are insufficient on their own without corresponding indicators of statistical precision, such as confidence intervals. As such, any analytical method applied to survey data must accommodate data weighting, which is essential for producing valid and interpretable estimates. Within the field of economic research, income inequality represents a key application where the use of weighted data is critical. In this context, we introduce a weighted inequality index designed to improve the robustness of inequality measurement. To enhance its analytical rigor, the proposed index is accompanied by a non-parametric, bootstrap-based algorithm, designed to facilitate comparative assessments and statistical significance testing across various population subgroups (e.g., regions, countries, gender). A major advantage of this approach lies in its flexibility; it is suitable for both normally and non-normally distributed data, thereby broadening its applicability to real-world datasets that often deviate from standard distributional assumptions. To demonstrate the empirical utility and comparative performance of the proposed methodology, we applied it to household income data obtained from the Central Agency for Public Mobilization and Statistics (CAPMAS), based on nationally representative income and expenditure surveys conducted in 2015 and 2018. The empirical findings revealed a general decline in the values of the proposed inequality index across most Egyptian governorates between 2015 and 2018, indicating a modest trend toward greater income equality. This downward shift may be indicative of the effects of socioeconomic reform measures and targeted development policies aimed at reducing regional disparities. The results validate the practical relevance of the proposed index as a reliable tool for evaluating income inequality in diverse socioeconomic contexts.},
 year = {2025}
}
TY  - JOUR
T1  - Measuring Inequality of Income Distributions in Egypt: An Empirical Study Using Weighted and Non-parametric Methods

AU  - Eman Mohamed Hanafy
AU  - Hend Abdulghaffar Auda
AU  - Ibrahim Hassan Ibrahim
Y1  - 2025/08/04
PY  - 2025
N1  - https://doi.org/10.11648/j.ajam.20251304.13
DO  - 10.11648/j.ajam.20251304.13
T2  - American Journal of Applied Mathematics
JF  - American Journal of Applied Mathematics
JO  - American Journal of Applied Mathematics
SP  - 256
EP  - 273
PB  - Science Publishing Group
SN  - 2330-006X
UR  - https://doi.org/10.11648/j.ajam.20251304.13
AB  - One of the foundational tasks in statistical analysis is the design and implementation of sample surveys, which involve sampling error that affects the reliability and precision of the resulting estimates. Measures such as totals and means are insufficient on their own without corresponding indicators of statistical precision, such as confidence intervals. As such, any analytical method applied to survey data must accommodate data weighting, which is essential for producing valid and interpretable estimates. Within the field of economic research, income inequality represents a key application where the use of weighted data is critical. In this context, we introduce a weighted inequality index designed to improve the robustness of inequality measurement. To enhance its analytical rigor, the proposed index is accompanied by a non-parametric, bootstrap-based algorithm, designed to facilitate comparative assessments and statistical significance testing across various population subgroups (e.g., regions, countries, gender). A major advantage of this approach lies in its flexibility; it is suitable for both normally and non-normally distributed data, thereby broadening its applicability to real-world datasets that often deviate from standard distributional assumptions. To demonstrate the empirical utility and comparative performance of the proposed methodology, we applied it to household income data obtained from the Central Agency for Public Mobilization and Statistics (CAPMAS), based on nationally representative income and expenditure surveys conducted in 2015 and 2018. The empirical findings revealed a general decline in the values of the proposed inequality index across most Egyptian governorates between 2015 and 2018, indicating a modest trend toward greater income equality. This downward shift may be indicative of the effects of socioeconomic reform measures and targeted development policies aimed at reducing regional disparities. The results validate the practical relevance of the proposed index as a reliable tool for evaluating income inequality in diverse socioeconomic contexts.
VL  - 13
IS  - 4
ER  -
Department of Mathematics, Insurance and Applied Statistics, Faculty of Commerce and Business Administration, Helwan University, Cairo, Egypt
Department of Mathematics, Insurance and Applied Statistics, Faculty of Commerce and Business Administration, Helwan University, Cairo, Egypt
Department of Mathematics, Insurance and Applied Statistics, Faculty of Commerce and Business Administration, Helwan University, Cairo, Egypt
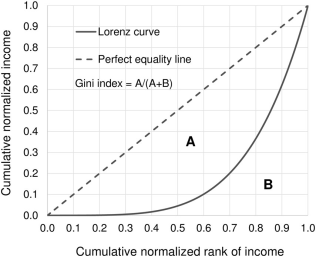
Figure 1. Illustrates the relation between Lorenz curve and GI.
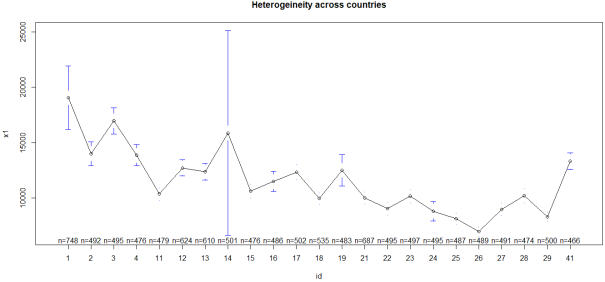
Figure 2. The 95% confidence interval around the means of income distributions for 23 governorates at 2015.
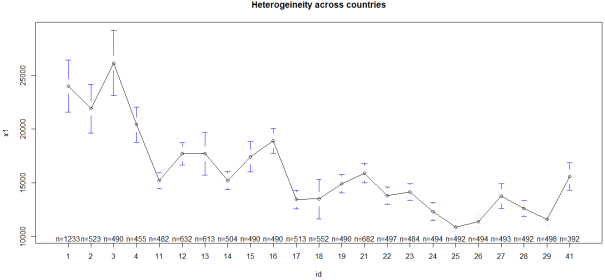
Figure 3. The 95% confidence interval around the means of income distributions for 23 governorates at 2018.
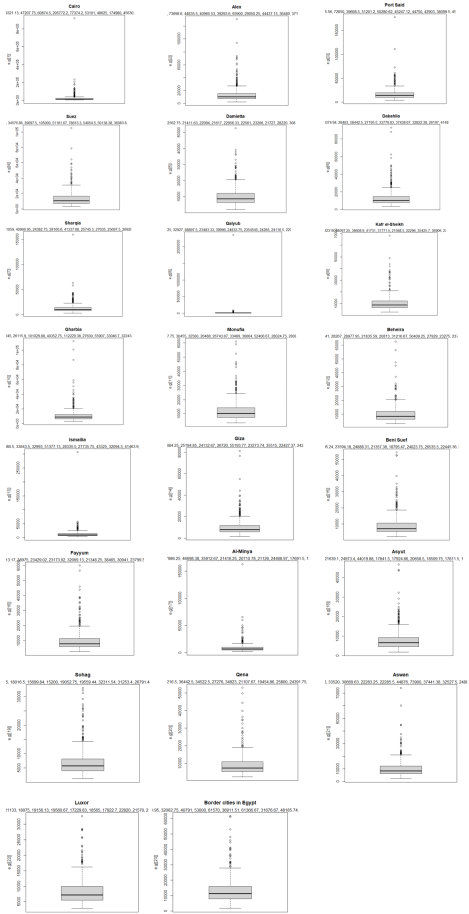
Figure 4. Boxplots of income distributions for 23 governorates at 2018.
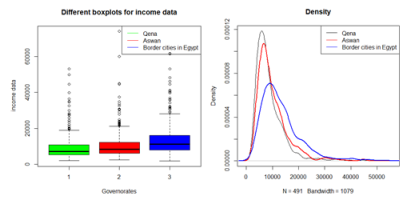
Figure 5. Provide the visual description for the characteristics of the three distributions, that: Figure 5-a. Presents the boxplots of them. Figure 5-b. Provides their density curves.
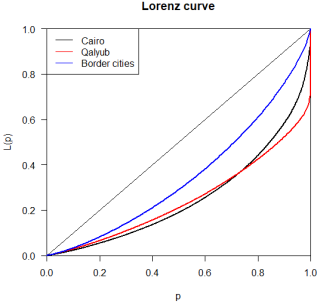
Figure 6. Presents the Lorenz curve for income distribution of Qalyub, Cairo and Border Cities.
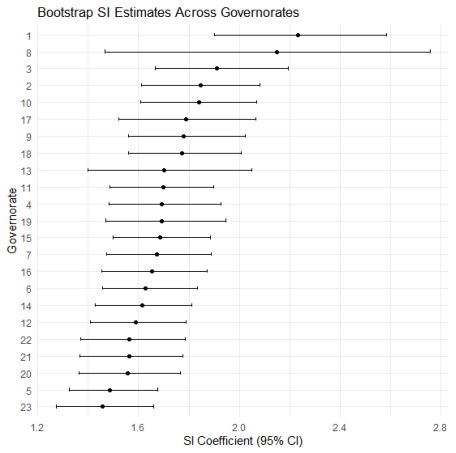
Figure 7. Presents the mean values and 95% confidence intervals of for data of 2015.
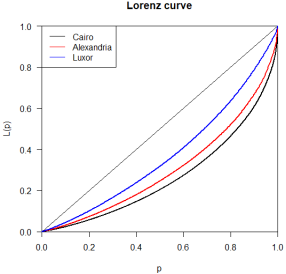
Figure 8. Presents the Lorenz curve for income distribution of Cairo, Alexandria and Luxor.
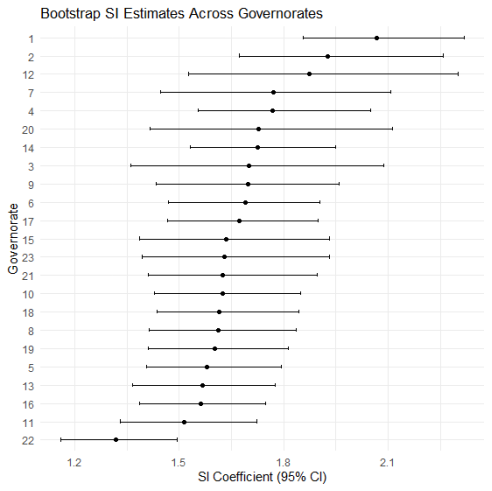
Figure 9. Presents the mean values and 95% confidence intervals of for data of 2018.
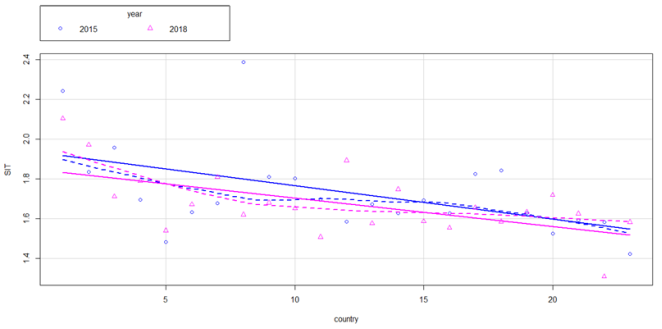
Figure 10. Presents a comparison between the values of in 2015 and its corresponding values in 2018.
Information

