Research Article | | Peer-Reviewed

Interpretable Machine Learning for the Identification of Key Metabolic Biomarkers Associated with Newly Diagnosed Malignancies

Received: 16 July 2026     Accepted: 24 August 2026     Published: 4 September 2026
Views:       Downloads:
Abstract

Objective: To identify the most informative metabolic biomarkers associated with newly diagnosed cancer and to evaluate the potential of interpretable machine learning methods for their identification and patient classification. Materials and methods: This single-center retrospective study included 210 patients: 110 subjects without cancer and 100 patients with newly diagnosed malignancies. Clinical, anthropometric, laboratory, and metabolic variables were analyzed, including body mass index, waist circumference, visceral adiposity index, fasting glucose, immunoreactive insulin, insulin resistance indices, lipid profile, adipokines, and inflammatory markers. After preprocessing and stratified splitting into training, validation, and test sets, a family of Logistic Regression models, Elastic Net, Decision Tree, and CatBoost were used for binary classification. Model interpretation was performed using SHAP analysis, CatBoost feature importance, decision tree structure, SHAP Waterfall plots, and standardized Elastic Net coefficients. Results: CatBoost demonstrated the best classification performance on the test set (AUROC=0.9805; AUPRC=0.9711; Recall=0.9091; Precision=0.9524; F1-score=0.9302). Independent interpretation methods consistently identified the hyperglycemia criterion, fasting glucose, HOMA-IR, oral glucose tolerance test parameters, and the number of metabolic syndrome components as the leading predictors. Distribution analysis confirmed a shift of these biomarkers toward more pronounced carbohydrate metabolism disorders in the oncology group. Conclusion: Interpretable machine learning can support the identification of metabolic biomarkers associated with newly diagnosed cancer. Carbohydrate metabolism and insulin resistance markers were the most informative predictors and may be useful for early oncometabolic risk stratification and future clinical decision-support models.

Published in American Journal of Clinical and Experimental Medicine (Volume 14, Issue 5)
DOI 10.11648/j.ajcem.20261405.13
Page(s) 119-128
Creative Commons

This is an Open Access article, distributed under the terms of the Creative Commons Attribution 4.0 International License (http://creativecommons.org/licenses/by/4.0/), which permits unrestricted use, distribution and reproduction in any medium or format, provided the original work is properly cited.

Copyright

Copyright © The Author(s), 2026. Published by Science Publishing Group

Keywords

Cancer, Machine Learning, SHAP, CatBoost, Insulin Resistance, HOMA-IR, Hyperglycemia, Metabolic Syndrome, Biomarkers

1. Introduction
The rising incidence of malignant neoplasms remains one of the most significant medical and social problems in modern healthcare . Despite advances in diagnostic and treatment methods, a considerable proportion of oncological diseases are still detected at late stages, which significantly worsens prognosis and limits the possibilities for radical treatment . Recent GLOBOCAN estimates also emphasize the continuing growth of the global cancer burden and the importance of preventable risk factors, including excess body weight . In this regard, the search for accessible biomarkers that allow the identification of patients at high cancer risk at the preclinical stage is of particular relevance.
In recent years, particular attention has been paid to the study of metabolic disorders as potential factors in carcinogenesis. Visceral obesity, insulin resistance, hyperinsulinemia, and chronic low-grade inflammation are considered key mechanisms contributing to the development of malignant neoplasms . However, comprehensive assessment of metabolic biomarkers is difficult due to complex non-linear relationships between clinical, anthropometric, and laboratory parameters .
Machine learning methods allow for the consideration of such correlations, the automatic identification of the most informative features, and the construction of interpretable patient classification models. Unlike most published studies , which are predominantly based on demographic characteristics, routine laboratory parameters, and electronic medical record data, the present study aims to identify key metabolic biomarkers associated with newly diagnosed oncological diseases using several complementary interpretable machine learning methods. Recent systematic reviews and reporting recommendations further emphasize that machine-learning models intended for clinical use require transparent interpretation, clinician-oriented explanations, and complete reporting of model development and validation .
Aim of the Study
To identify the most informative metabolic biomarkers associated with newly diagnosed oncological diseases and to evaluate the potential of interpretable machine learning methods for their identification and patient classification.
2. Materials and Methods
2.1. Study Design
A single-center retrospective study was conducted aimed at identifying metabolic biomarkers associated with newly diagnosed oncological diseases and developing interpretable machine learning models for binary patient classification.
The study included two groups of patients: a study group (SG, n=110) without oncological diseases and a group of patients with newly diagnosed malignant neoplasms (n=100). The target variable was the patient's belonging to the group with a newly diagnosed oncological disease (1) or to the study group without oncological pathology (0).
2.2. Studied Parameters and Statistical Analysis
Clinical-demographic, anthropometric, laboratory, and metabolic parameters were analyzed: age, sex, body weight, body mass index (BMI), waist circumference (WC), visceral adiposity index (VAI), glucose and immunoreactive insulin levels, HOMA-IR, Matsuda, and Caro indices, concentrations of visfatin, resistin, and IL-10, as well as additional parameters of the carbohydrate, lipid, and inflammatory profile.
Quantitative data are presented as median and interquartile range Me (Q1; Q3). Intergroup differences were assessed using the Mann-Whitney U test. Differences were considered statistically significant at p < 0.05.
2.3. Data Preprocessing
Prior to model training, data preprocessing was performed. Duplicate variables and observations containing missing values were excluded from the analysis. Categorical variables were converted to numerical values using Label Encoding, enabling their use in machine learning models.
Based on individual components of the metabolic syndrome, an integral indicator reflecting the number of pathological components of the metabolic syndrome in each patient was calculated. After preprocessing, the data were randomly divided into training, validation, and test sets in a ratio of 56.25%, 18.75%, and 25%, respectively, using stratified splitting to preserve the original class distribution.
For logistic regression models, quantitative features were standardized using the StandardScaler method. For tree-based models (Decision Tree, CatBoost), feature scaling was not performed.
2.4. Development and Interpretation of Machine Learning Models
To solve the binary classification problem, a family of logistic regression models (without regularization, L1-, L2-regularization, and Elastic Net), as well as Decision Tree and CatBoost models, were used.
Logistic regression was employed as a baseline linear model. Decision Tree was used to visualize decision logic and formulate clinically interpretable classification rules, while CatBoost was used to build a high-performance model capable of capturing complex non-linear relationships between metabolic biomarkers.
For logistic regression models, the sign and absolute value of standardized regression coefficients were analyzed, reflecting the direction of association and the relative contribution of individual features to patient classification. The Decision Tree was interpreted by analyzing its structure, allowing visualization of the feature selection sequence and classification rules. For the interpretation of the CatBoost model, SHAP (SHapley Additive exPlanations) global feature importance analysis and the internal feature importance assessment calculated by the CatBoost algorithm were used. This interpretation strategy was chosen in accordance with recent literature highlighting the need for clinically transparent and reproducible XAI workflows in oncology and medical prediction modeling .
3. Results
3.1. Clinical-Demographic and Laboratory Characteristics of the Groups
The clinical-demographic and laboratory characteristics of the examined subjects are presented in Table 1. Patients with newly diagnosed oncological diseases were characterized by higher values of glucose, immunoreactive insulin, HOMA-IR index, visceral adiposity index, and resistin levels, as well as lower values of Matsuda and Caro indices, visfatin, and IL-10 concentrations compared to the study group.
Table 1. Clinical-Demographic and Laboratory Characteristics of the Examined Subjects.

Parameter

SG (n=110)

Oncology (n=100)

p

Age, years

48.20 (38.68; 59.88)

49.30 (41.70; 62.35)

0.234

Weight, kg

80.00 (70.75; 98.00)

80.00 (71.00; 89.75)

0.432

BMI, kg/m2

27.83 (23.79; 33.26)

28.91 (25.38; 33.51)

0.328

WC, cm

81.00 (72.00; 92.75)

87.00 (76.00; 97.00)

0.187

VAI

2.42 (1.25; 4.41)

3.38 (2.16; 4.46)

0.009

Glucose, mmol/L

4.70 (4.30; 5.10)

5.95 (4.83; 7.58)

<0.001

IRI, µIU/mL

29.40 (14.85; 45.30)

48.90 (34.10; 88.95)

<0.001

HOMA-IR

5.90 (2.88; 9.10)

12.18 (8.05; 25.83)

<0.001

Matsuda

2.11 (1.48; 3.83)

1.14 (0.75; 1.87)

<0.001

Caro

0.16 (0.10; 0.29)

0.12 (0.08; 0.20)

0.002

Visfatin

32.10 (26.38; 37.15)

23.10 (10.83; 34.00)

<0.001

Resistin

7.85 (4.88; 9.60)

23.20 (15.98; 33.28)

<0.001

IL-10

16.20 (9.63; 26.20)

10.75 (6.73; 15.88)

<0.001

Note: Data presented as Me (Q1; Q3). SG – study group; BMI – body mass index; WC – waist circumference; VAI – visceral adiposity index; IRI – immunoreactive insulin.
3.2. Comparison of Machine Learning Model Performance
The results of the classification performance evaluation are presented in Table 2.
Table 2. Comparison of Machine Learning Model Performance.

Model

AUROC

AUPRC

Recall (Sensitivity)

Precision (PPV)

F1-score

CatBoost

0.9805

0.9711

0.9091

0.9524

0.9302

Decision Tree

0.8701

0.8800

0.9091

0.7692

0.8333

Logistic Regression (Elastic Net)

0.7581

0.6604

0.7727

0.6071

0.6800

Logistic Regression (L2, Ridge)

0.7614

0.6626

0.7727

0.6071

0.6800

Logistic Regression (L1, Lasso)

0.7256

0.6158

0.8636

0.5278

0.6552

Logistic Regression (No regularization)

0.6761

0.5664

0.7273

0.5926

0.6531

Based on the test set results, the CatBoost model demonstrated the best performance, achieving maximum AUROC (0.9805) and AUPRC (0.9711) values, as well as high Recall (0.9091), Precision (0.9524), and F1-score (0.9302). This indicates a high ability of the model to correctly distinguish between patients in the study groups.
The Decision Tree model also showed high classification performance (AUROC=0.8701; AUPRC=0.8800) but was inferior to CatBoost across most metrics. However, its advantage was high clinical interpretability. The linear models demonstrated lower discriminative ability (AUROC 0.6761–0.7614); among them, the Elastic Net model was the most informative (AUROC=0.7581; AUPRC=0.6604).
Thus, the CatBoost model demonstrated the best classification quality among the investigated algorithms and was selected for subsequent interpretability analysis.
3.3. Identification of the Most Significant Metabolic Biomarkers
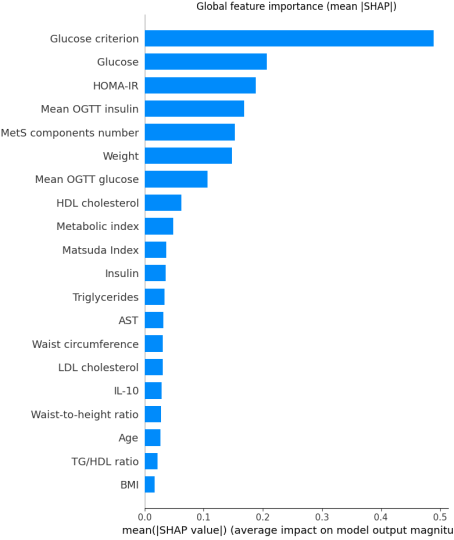
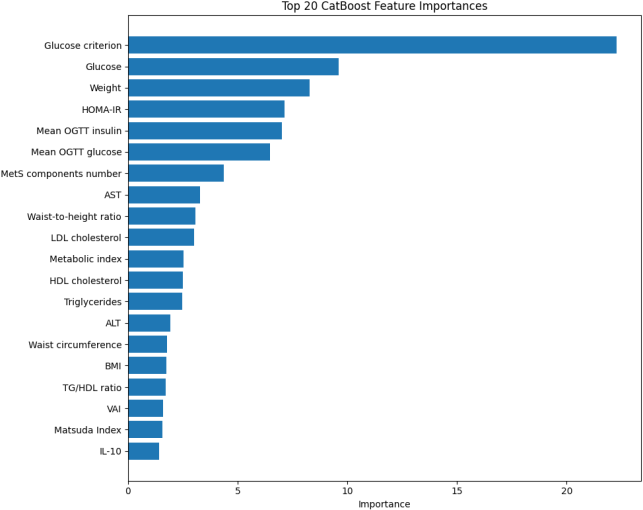
To identify the most informative metabolic biomarkers, SHAP analysis and assessment of internal feature importance of the CatBoost model were used (Figure 1, Figure 2). Both approaches indicated the leading role of carbohydrate metabolism and insulin resistance parameters in patient classification, while anthropometric and lipid parameters had lesser predictive significance.
Figure 1. Global importance of metabolic biomarkers according to SHAP analysis.
SHAP analysis showed that the leading predictors for classification were the hyperglycemia criterion, fasting glucose level, HOMA-IR index, OGTT parameters, and the number of metabolic syndrome components. Inflammatory, lipid, and anthropometric parameters, as well as age, had lesser significance.
Despite differences in feature importance assessment methodology, SHAP analysis and the internal feature importance assessment of the CatBoost model demonstrated high consistency of results. In both cases, the most informative features were the hyperglycemia criterion, fasting glucose level, HOMA-IR index, OGTT parameters, the number of metabolic syndrome components, and body weight.
Figure 2. Internal feature importance of the CatBoost model.
3.4. Interpretable Clinical Decision-Making Model
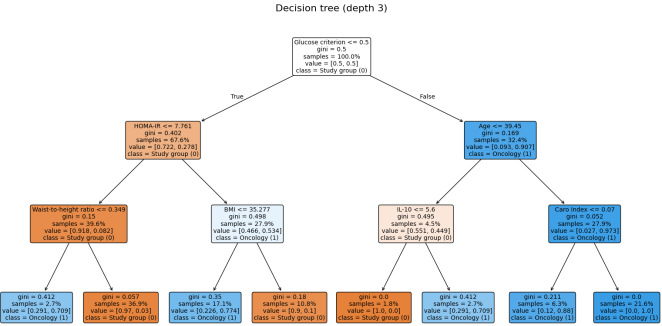
Despite the high diagnostic performance of the CatBoost model, its internal logic remains insufficiently transparent for direct clinical interpretation. Therefore, a Decision Tree model was constructed to visualize the decision-making process (Figure 3), allowing the presentation of the feature selection sequence and the formulation of clinically interpretable patient classification rules.
The constructed Decision Tree model showed that the primary criterion for patient classification is the presence of carbohydrate metabolism disorders, reflected by the binary hyperglycemia indicator. In the absence of hyperglycemia, further stratification was performed based on the HOMA-IR index, followed by consideration of anthropometric parameters. In patients with carbohydrate metabolism disorders, additional classification was determined by age, Caro index, and IL-10 levels.
The sequence of features used in the Decision Tree model demonstrated consistency with the results of the SHAP analysis and the internal importance assessment of the CatBoost model. In all cases, carbohydrate metabolism parameters played the leading role, while anthropometric parameters and age were used primarily to refine patient classification. The high interpretability of the tree structure allows this model to be considered a clear tool for clinical decision support.
Figure 3. Interpretable patient classification model using Decision Tree.
3.5. Individual Interpretation of Model Decisions
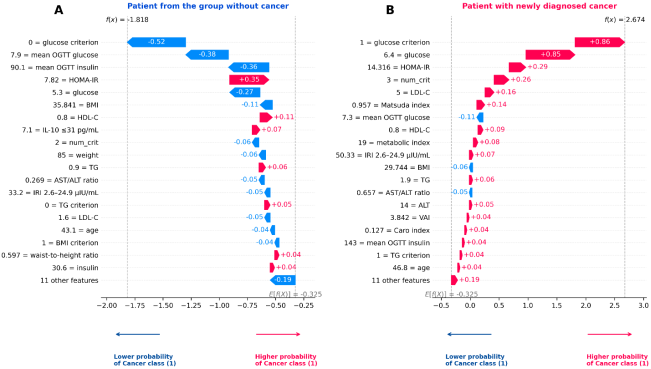
For clinical application of the model, it is important to understand which features determined the classification outcome for a specific patient (Figure 4). For this purpose, the SHAP Waterfall method was used, allowing quantitative assessment of each feature's contribution to the model's final decision. The final value f(x) reflects the total impact of all features: the higher this value, the higher the probability of the patient belonging to class 1, i.e., the group of patients with a newly diagnosed oncological disease.
Figure 4. Individual interpretation of model decisions using the SHAP Waterfall method. A – patient from the study group without oncological disease; B – patient with a newly diagnosed oncological disease.
For the patient in the study group, the final model function value was negative (f(x) = –1.818), which corresponded to a low probability of belonging to the oncology group. The greatest influence on the final decision was exerted by the absence of carbohydrate metabolism disorders, normal glycemic criteria, relatively low mean glucose and insulin levels during OGTT, and a low fasting glucose level.
For the patient with a newly diagnosed oncological disease, the final model function value was positive (f(x) = 2.674), which corresponded to a high probability of belonging to the oncology group. The greatest contribution to the final decision was made by the presence of the hyperglycemia criterion, elevated fasting glucose level, high HOMA-IR index, increased number of metabolic syndrome components, and elevated low-density lipoprotein levels.
Thus, SHAP Waterfall allows the physician not only to see the model's final decision but also to determine which specific metabolic disorders led to the classification of a particular patient into a high or low cancer risk group.
3.6. Direction of Associations of Metabolic Biomarkers According to Elastic Net Results
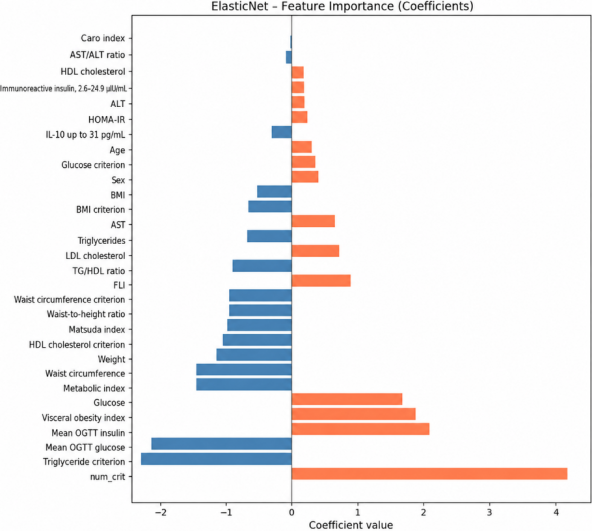
For additional interpretation of model-driven associations, analysis of the standardized coefficients of the Elastic Net model was performed. Unlike SHAP, this approach was used not to assess global feature importance but to determine the direction of association of each indicator with the model's linear predictor, which determines the probability of a patient belonging to the group with a newly diagnosed oncological disease.
Figure 5. Coefficients of the Elastic Net model characterizing the direction of association of features with the probability of patient belonging to the group with newly diagnosed oncological diseases.
Analysis of the Elastic Net coefficients showed that the greatest positive contribution to patient classification was made by the number of metabolic syndrome components, mean insulin level during OGTT, visceral adiposity index, glucose level, and insulin resistance parameters. Negative coefficients were noted for several anthropometric and metabolic features; they should be interpreted considering the multivariate structure of the model and the relationships between variables.
Overall, the analysis of the Elastic Net coefficients demonstrated consistency with the results of SHAP, CatBoost Feature Importance, and Decision Tree, reproducibly highlighting a similar set of the most informative metabolic parameters.
3.7. Analysis of the Distribution of the Most Informative Metabolic Biomarkers
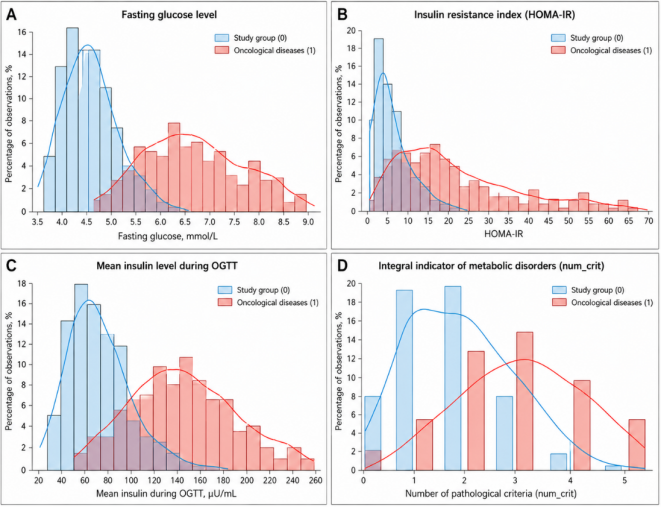
To confirm the results obtained using interpretable machine learning models, a comparative analysis of the distribution of the most informative metabolic biomarkers in patients from the study group and patients with newly diagnosed oncological diseases was performed (Figure 6).
Figure 6. Distribution of the most informative metabolic biomarkers in patients of the study group and patients with newly diagnosed oncological diseases. A – fasting glucose level; B – HOMA-IR index; C – mean insulin level during OGTT; D – indicator of the number of metabolic syndrome components.

The distribution analysis confirmed the results obtained by interpretable machine learning methods. Patients in the oncology group were characterized by a shift in the distributions of fasting glucose, HOMA-IR, and mean insulin level during OGTT towards higher values, reflecting hyperglycemia, insulin resistance, and hyperinsulinemia. A similar trend was found for the number of metabolic syndrome components: values of 1–2 predominated in patients of the study group, whereas 3–4 pathological criteria were more frequently registered in patients with newly diagnosed oncological diseases.
The obtained results are consistent with the data from SHAP, CatBoost, Decision Tree, and Elastic Net and confirm the leading role of carbohydrate metabolism disorders and insulin resistance in patient classification.
4. Discussion
The present study showed that interpretable machine learning methods allow not only effective classification of patients with newly diagnosed oncological diseases but also the identification of key metabolic biomarkers associated with the oncological process. The high consistency of results obtained using SHAP, CatBoost, Decision Tree, and Elastic Net indicates the reproducibility of the identified patterns. Regardless of the algorithm used, the leading predictors were indicators of carbohydrate metabolism and insulin resistance, including the hyperglycemia criterion, fasting glucose level, HOMA-IR index, OGTT parameters, and the number of metabolic syndrome components.
The results obtained are consistent with current concepts of metabolic carcinogenesis, according to which insulin resistance and hyperinsulinemia are key mechanisms linking visceral obesity to the development of malignant neoplasms . The higher diagnostic significance of carbohydrate metabolism indicators compared to anthropometric characteristics suggests that functional metabolic disorders reflect cancer-metabolic risk more fully than quantitative obesity assessment .
Unlike most published studies , which are predominantly based on demographic and general clinical data, the present study was focused on the analysis of specialized metabolic biomarkers. The use of several complementary interpretation methods allowed not only to achieve high classification quality but also to explain the contribution of each feature at both the population and individual levels, expanding the possibilities for using the developed model as a clinical decision support system.
5. Study Limitations
The present study has several limitations. First, it was conducted at a single center, limiting the generalizability of the results to other populations. Second, the relatively small sample size did not allow for analysis of individual localizations of malignant neoplasms. Third, the retrospective design of the study does not allow assessment of the predictive performance of the model and requires its subsequent prospective and external validation in independent patient cohorts. Future external validation and reporting should follow current TRIPOD+AI recommendations for regression- and machine-learning-based clinical prediction models [15].
6. Conclusion
An interpretable machine learning model was developed for the classification of patients with newly diagnosed oncological diseases based on a panel of metabolic biomarkers. Regardless of the interpretation method used, the leading predictors were indicators of carbohydrate metabolism and insulin resistance, including the hyperglycemia criterion, fasting glucose level, HOMA-IR index, OGTT parameters, and the number of metabolic syndrome components.
The obtained results indicate that functional disorders of carbohydrate metabolism have greater diagnostic significance than traditional anthropometric parameters and can be considered promising metabolic biomarkers for early stratification of cancer-metabolic risk. The use of interpretable machine learning methods allows not only patient classification but also explanation of the contribution of each biomarker to the model's decision, increasing trust in the model and creating prerequisites for its use in clinical decision support systems.
Abbreviations

BMI

Body Mass Index

WC

Waist Circumference

VAI

Visceral Adiposity Index

SHAP

SHapley Additive exPlanations

OGTT

Oral Glucose Tolerance Test

Author Contributions
Kermen I. Bairova: Conceptualization; Data curation; Formal Analysis; Investigation; Methodology; Software; Validation; Visualization; Writing – original draft.
Ashot M. Mkrtumyan: Conceptualization; Methodology; Project administration; Supervision; Validation; Writing – review & editing.
All authors have read and approved the final manuscript.
Data Availability Statement
The data supporting the outcome of this research work has been reported in this manuscript.
Funding Sources
The work was carried out on the authors' initiative without any funding.
Conflict of Interest
The authors declare that they have no apparent or potential conflicts of interest related to the content of this article.
References
[1] World Health Organization. Cancer. Available from:
[2] Kaprin A. D., Perkhov V. I., Genatulin M. A. Dynamics of target indicators of the Russian federal project "Fight against Oncological Diseases". Preventive Medicine. 2026; 29(3): 7–14.
[3] Bairova K. I., Mkrtumyan A. M., Prilepa S. A., Medvedeva E. V. Visceral obesity as a risk factor for breast cancer. Therapeutic Archive. 2025; 97(10): 830–835.
[4] Ermak A. D., Gavrilov D. V., Novitsky R. E., Gusev A. V., Komarov Yu. I., Andreichenko A. E. Using machine learning to predict oncological diseases based on electronic medical record data: an automated approach to screening. Oncology Issues. 2025; 71(4): OF–2258.
[5] Miotto R., Li L., Kidd B. A., Dudley J. T. Deep Patient: An unsupervised representation to predict the future of patients from the electronic health records. Scientific Reports. 2016; 6: 26094.
[6] Sung H., Filho A. M., Laversanne M., Ferlay J., Siegel R. L., Soerjomataram I., Jemal A., Bray F. Global cancer statistics 2024: GLOBOCAN estimates of incidence and mortality worldwide for 34 cancers in 186 countries. CA: A Cancer Journal for Clinicians. 2026.
[7] Lee F., Moore J., Markouli M., Ghusn W. The oncogenic burden of obesity: mechanistic links between adiposity and gastrointestinal cancers — a comprehensive narrative review. Biomedicines. 2025;13(7):1571.
[8] Zhao X., An X., Yang C., Sun W., Ji H., Lian F. The crucial role and mechanism of insulin resistance in metabolic disease. Frontiers in Endocrinology. 2023;14:1149239.
[9] Zhang A. M. Y., Xia Y. H., Lin J. S. H., Chu K. H., Wang W. C. K., Ruiter T. J. J., et al. Hyperinsulinemia acts via acinar insulin receptors to initiate pancreatic cancer by increasing digestive enzyme production and inflammation. Cell Metabolism. 2023;35(12):2119-2135.e5.
[10] Yin J., Freedman N. D., Liu Y., Dawsey S. M., Yang H., Taylor P. R., et al. Associations between serum glucose, insulin, insulin resistance and the risk of incident primary liver cancer or chronic liver disease mortality: a nested case-control study. British Journal of Cancer. 2023; 128(2): 275-284.
[11] Son M., Moon S. Y., Koh M., Kang Y., Lee J. Y. Association between surrogate markers of insulin resistance and the incidence of colorectal cancer in Korea: a nationwide population-based study. Journal of Clinical Medicine. 2024; 13(6): 1628.
[12] Caruso A., Gelsomino L., Panza S., Accattatis F. M., Naimo G. D., Barone I., et al. Leptin: a heavyweight player in obesity-related cancers. Biomolecules. 2023; 13(7): 1084.
[13] Al-Tashi Q., Saad M. B., Muneer A., Qureshi R., Mirjalili S., Sheshadri A., et al. Machine learning models for the identification of prognostic and predictive cancer biomarkers: a systematic review. International Journal of Molecular Sciences. 2023;24(9):7781.
[14] Mohamed Y. A., Khoo B. E., Mohd Asaari M. S., Aziz M. E., Ghazali F. R. Decoding the black box: explainable AI (XAI) for cancer diagnosis, prognosis, and treatment planning — a state-of-the-art systematic review. International Journal of Medical Informatics. 2025;193:105689.
[15] Collins G. S., Moons K. G. M., Dhiman P., Riley R. D., Beam A. L., Van Calster B., et al. TRIPOD+AI statement: updated guidance for reporting clinical prediction models that use regression or machine learning methods. BMJ. 2024; 385: e078378.
Cite This Article
  • APA Style

    Bairova, K. I., MusaelovichMkrtumyan, A. (2026). Interpretable Machine Learning for the Identification of Key Metabolic Biomarkers Associated with Newly Diagnosed Malignancies. American Journal of Clinical and Experimental Medicine, 14(5), 119-128. https://doi.org/10.11648/j.ajcem.20261405.13

    Copy | Download

    ACS Style

    Bairova, K. I.; MusaelovichMkrtumyan, A. Interpretable Machine Learning for the Identification of Key Metabolic Biomarkers Associated with Newly Diagnosed Malignancies. Am. J. Clin. Exp. Med. 2026, 14(5), 119-128. doi: 10.11648/j.ajcem.20261405.13

    Copy | Download

    AMA Style

    Bairova KI, MusaelovichMkrtumyan A. Interpretable Machine Learning for the Identification of Key Metabolic Biomarkers Associated with Newly Diagnosed Malignancies. Am J Clin Exp Med. 2026;14(5):119-128. doi: 10.11648/j.ajcem.20261405.13

    Copy | Download

  • @article{10.11648/j.ajcem.20261405.13,
      author = {Kermen Ivanovna Bairova and Ashot MusaelovichMkrtumyan},
      title = {Interpretable Machine Learning for the Identification of Key Metabolic Biomarkers Associated with Newly Diagnosed Malignancies},
      journal = {American Journal of Clinical and Experimental Medicine},
      volume = {14},
      number = {5},
      pages = {119-128},
      doi = {10.11648/j.ajcem.20261405.13},
      url = {https://doi.org/10.11648/j.ajcem.20261405.13},
      eprint = {https://article.sciencepublishinggroup.com/pdf/10.11648.j.ajcem.20261405.13},
      abstract = {Objective: To identify the most informative metabolic biomarkers associated with newly diagnosed cancer and to evaluate the potential of interpretable machine learning methods for their identification and patient classification. Materials and methods: This single-center retrospective study included 210 patients: 110 subjects without cancer and 100 patients with newly diagnosed malignancies. Clinical, anthropometric, laboratory, and metabolic variables were analyzed, including body mass index, waist circumference, visceral adiposity index, fasting glucose, immunoreactive insulin, insulin resistance indices, lipid profile, adipokines, and inflammatory markers. After preprocessing and stratified splitting into training, validation, and test sets, a family of Logistic Regression models, Elastic Net, Decision Tree, and CatBoost were used for binary classification. Model interpretation was performed using SHAP analysis, CatBoost feature importance, decision tree structure, SHAP Waterfall plots, and standardized Elastic Net coefficients. Results: CatBoost demonstrated the best classification performance on the test set (AUROC=0.9805; AUPRC=0.9711; Recall=0.9091; Precision=0.9524; F1-score=0.9302). Independent interpretation methods consistently identified the hyperglycemia criterion, fasting glucose, HOMA-IR, oral glucose tolerance test parameters, and the number of metabolic syndrome components as the leading predictors. Distribution analysis confirmed a shift of these biomarkers toward more pronounced carbohydrate metabolism disorders in the oncology group. Conclusion: Interpretable machine learning can support the identification of metabolic biomarkers associated with newly diagnosed cancer. Carbohydrate metabolism and insulin resistance markers were the most informative predictors and may be useful for early oncometabolic risk stratification and future clinical decision-support models.},
     year = {2026}
    }
    

    Copy | Download

  • TY  - JOUR
    T1  - Interpretable Machine Learning for the Identification of Key Metabolic Biomarkers Associated with Newly Diagnosed Malignancies
    AU  - Kermen Ivanovna Bairova
    AU  - Ashot MusaelovichMkrtumyan
    Y1  - 2026/09/04
    PY  - 2026
    N1  - https://doi.org/10.11648/j.ajcem.20261405.13
    DO  - 10.11648/j.ajcem.20261405.13
    T2  - American Journal of Clinical and Experimental Medicine
    JF  - American Journal of Clinical and Experimental Medicine
    JO  - American Journal of Clinical and Experimental Medicine
    SP  - 119
    EP  - 128
    PB  - Science Publishing Group
    SN  - 2330-8133
    UR  - https://doi.org/10.11648/j.ajcem.20261405.13
    AB  - Objective: To identify the most informative metabolic biomarkers associated with newly diagnosed cancer and to evaluate the potential of interpretable machine learning methods for their identification and patient classification. Materials and methods: This single-center retrospective study included 210 patients: 110 subjects without cancer and 100 patients with newly diagnosed malignancies. Clinical, anthropometric, laboratory, and metabolic variables were analyzed, including body mass index, waist circumference, visceral adiposity index, fasting glucose, immunoreactive insulin, insulin resistance indices, lipid profile, adipokines, and inflammatory markers. After preprocessing and stratified splitting into training, validation, and test sets, a family of Logistic Regression models, Elastic Net, Decision Tree, and CatBoost were used for binary classification. Model interpretation was performed using SHAP analysis, CatBoost feature importance, decision tree structure, SHAP Waterfall plots, and standardized Elastic Net coefficients. Results: CatBoost demonstrated the best classification performance on the test set (AUROC=0.9805; AUPRC=0.9711; Recall=0.9091; Precision=0.9524; F1-score=0.9302). Independent interpretation methods consistently identified the hyperglycemia criterion, fasting glucose, HOMA-IR, oral glucose tolerance test parameters, and the number of metabolic syndrome components as the leading predictors. Distribution analysis confirmed a shift of these biomarkers toward more pronounced carbohydrate metabolism disorders in the oncology group. Conclusion: Interpretable machine learning can support the identification of metabolic biomarkers associated with newly diagnosed cancer. Carbohydrate metabolism and insulin resistance markers were the most informative predictors and may be useful for early oncometabolic risk stratification and future clinical decision-support models.
    VL  - 14
    IS  - 5
    ER  - 

    Copy | Download

Author Information
  • Abstract
  • Keywords
  • Document Sections

    1. 1. Introduction
    2. 2. Materials and Methods
    3. 3. Results
    4. 4. Discussion
    5. 5. Study Limitations
    6. 6. Conclusion
    Show Full Outline
  • Abbreviations
  • Author Contributions
  • Data Availability Statement
  • Funding Sources
  • Conflict of Interest
  • References
  • Cite This Article
  • Author Information