Research Article | | Peer-Reviewed

Machine Learning-Based Prediction and Optimization of Membrane Fouling in a Hybrid Biochar-Membrane System Treating Real Cafeteria Wastewater

Received: 11 July 2026     Accepted: 23 July 2026     Published: 10 August 2026
Views:       Downloads:
Abstract

The main characteristics of cafeteria effluents are the high organic load, varying concentration of fat/oil/grease content and nutrients, thus making them more difficult to treat than traditional domestic sewage. In this study, a combination of biochar-membrane technology was designed to treat real cafeteria wastewater from Akwa Ibom State University in Nigeria and ML for fouling prediction and process optimization. Biochar was prepared by pyrolysis and modified using iron oxide to increase the surface area (185.4 to 312.7 m2g-1) and functional groups, as indicated by FTIR spectroscopy (Fe-O at 580 cm-1), scanning electron microscopy and BET analysis (SEM). Adsorption of the main pollutant (COD) in batch mode followed Langmuir model (qm = 94.3 mg g-1, R2 = 0.986) and first-order kinetics (R2 = 0.978). Removal of COD, oil and grease, phosphate and turbidity were mainly dependent on biochar dosage and contact time. Two-stage Plackett-Burman/Box-Behnken design (45 runs) was used to produce the data set on which four ML models were developed; XGBoost and artificial neural networks exhibited the best results in terms of predictive performance (R2 = 0.91-0.96) for six response variables, surpassing random forest and support vector regression. Combination of the top-performing model with genetic algorithm, particle swarm and Bayesian optimization was used to find the optimal process parameters (14 g L-1 dose, 105 minutes, TMP 1.05 bar), leading to 89-90% COD removal with minimized membrane fouling, confirmed experimentally within ±5% from the predictions. Biochar pretreatment decreased the fouling resistance as compared to membrane-only process, while preliminary techno-economic evaluation suggested the process cost of about $0.258 m-3.

Published in American Journal of Chemical Engineering (Volume 14, Issue 4)
DOI 10.11648/j.ajche.20261404.13
Page(s) 101-118
Creative Commons

This is an Open Access article, distributed under the terms of the Creative Commons Attribution 4.0 International License (http://creativecommons.org/licenses/by/4.0/), which permits unrestricted use, distribution and reproduction in any medium or format, provided the original work is properly cited.

Copyright

Copyright © The Author(s), 2026. Published by Science Publishing Group

Keywords

Fe3O4-modified Biochar, Membrane Fouling Resistance, Box-Behnken Response Surface Methodology, Artificial Neural Network, Institutional Wastewater Treatment, Techno-economic Assessment

1. Introduction
The shortage of freshwater resources and the production of wastewater at institutions is driving the demand for efficient and sustainable technology . Wastewater from cafeterias is known to contain relatively high levels of biodegradable organics, fats, oil, and grease (FOG), suspended solids, nutrients, and detergents, thus rendering the process of treating such wastewater quite difficult compared to the standard domestic wastewater . Untreated wastewater from the cafeteria can cause the depletion of oxygen levels, eutrophication, and degradation of the water body. Hence, the need for developing an efficient system to treat this wastewater is gaining attention .
Adsorption and membrane filtration are emerging as highly prospective technologies for treating wastewaters. The use of biochar is highly recognized as an eco-friendly and cost-effective adsorbent due to its high surface area and tunable surface chemistry . Various engineered biochars are characterized by high adsorptive capacity towards removal of organics, phosphorous, and heavy metals, whereas membrane filtration allows achieving high effluent water quality by means of removal of fine particulates from solution. Membrane fouling is still considered the key problem of membrane wastewater treatment processes, resulting in flux reduction, high energy costs, frequent cleaning and premature membrane deterioration. Therefore, modern approaches concentrate on the integration of adsorption into membrane filtration process in order to lower the concentration of fouling agents prior to the membrane stage .
Several researchers have explored complementary aspects of biochar-assisted and machine-learning-guided membrane treatment, yet each leaves a distinct gap that motivates the present work. Abuhasheesh et al. fabricated amine-functionalized biochar/cellulose acetate hybrid membranes from microalgal-derived biochar, achieving a permeate flux of 169.1 L m-2 h-1 and 64.1% removal of natural organic matter from municipal wastewater; however, the study evaluated membrane fabrication in isolation, without a preceding adsorption stage, predictive modelling, or testing on the fats-, oils-, and grease (FOG)-rich matrix typical of institutional food-service effluent. Wang et al. similarly showed that biochar addition can alleviate fouling indirectly by lowering soluble microbial product concentrations and promoting larger, less compressible flocs, or through combined biochar-biocarrier-gas-sparging action that achieved up to 92.1% fouling reduction, but both studies relied on biological membrane bioreactor (MBR) configurations treating synthetic or municipal wastewater rather than a standalone adsorption-pretreatment/membrane train, and neither incorporated a predictive or optimization framework. On the machine-learning side, Zahoor et al. applied multilayer-perceptron/radial-basis-function neural networks to predict transmembrane pressure and flux in pilot-scale MBRs treating textile wastewater, relying on a single algorithm and a biological (rather than adsorption-integrated) treatment train. Niu et al. compared ANN and random forest models for fouling prediction in an anaerobic MBR and identified soluble microbial product ratios as the dominant predictors, while Liang et al. developed a CatBoost-based explainable-AI framework (R2 = 0.837) for full-scale MBR fouling prediction using real food-processing wastewater; yet both studies remained confined to biological MBR systems and did not evaluate a hybrid adsorption-membrane configuration or institutional/cafeteria-scale effluent. Finally, characterization work on food-service establishment wastewater by Gurd et al. confirmed the highly variable, FOG- and organic-rich nature of such effluent but stopped short of evaluating any treatment technology, underscoring how little is known about how such wastewater performs in an integrated, intelligently optimized treatment system.
Despite these advances, most published biochar- and machine-learning-based studies have relied on synthetic, municipal, or industrial food-processing wastewater treated within biological membrane bioreactors, whereas investigations using real, highly variable cafeteria or food-service wastewater processed through a non-biological adsorption-membrane train remain limited. Also, existing machine learning applications have overwhelmingly targeted membrane bioreactors or single treatment units and typically benchmark only one or two algorithms, rather than an integrated adsorption-membrane system evaluated with multiple, consistently tuned algorithms.
Therefore, this study develops a hybrid biochar-membrane treatment system for real cafeteria wastewater from Akwa Ibom State University, Nigeria, integrating Fe3O4-modified biochar pretreatment with membrane filtration and coupling process operation to machine-learning-based prediction and multi-objective optimization of fouling and pollutant removal. The specific objectives are to (i) characterize raw cafeteria wastewater and quantify its treatment challenges; (ii) synthesize and characterize unmodified and magnetically modified biochar; (iii) determine the adsorption isotherm, kinetic, and thermodynamic parameters governing pollutant uptake; (iv) evaluate membrane fouling behaviour in the hybrid system; (v) develop and benchmark machine learning models for fouling and removal prediction; and (vi) identify and experimentally validate optimized operating conditions, including a preliminary techno-economic assessment. By integrating real institutional wastewater, biochar pretreatment, and intelligent process optimization within a single non-biological adsorption-membrane framework, this study addresses the identified gaps and provides a practical, decentralized treatment framework for institutional food-service wastewater in resource-limited settings.
2. Materials and Methods
2.1. Study Area and Wastewater Sampling
Raw cafeteria wastewater was collected from the main student cafeteria of Akwa Ibom State University, Ikot Akpaden, Nigeria, a facility serving several thousand students daily and representative of institutional food-service effluent in the region. To capture the temporal variability inherent in cafeteria discharge, grab samples were collected in triplicate at peak discharge periods (08:00-09:00, 13:00-14:00, and 18:00-19:00) over eight consecutive weeks. At each sampling event, the triplicate grabs were pooled in equal volumes into a single time-weighted composite sample, and this procedure was repeated for each of the eight weeks, yielding eight independent composite samples that captured week-to-week variability in wastewater quality. Samples were collected in pre-cleaned 5 L high-density polyethylene (HDPE) containers, transported in ice-packed coolers at ≤4°C, and processed within 6 h of collection to minimize biological transformation, in accordance with APHA sample-preservation protocols.
2.2. Physicochemical Characterization of Raw Wastewater
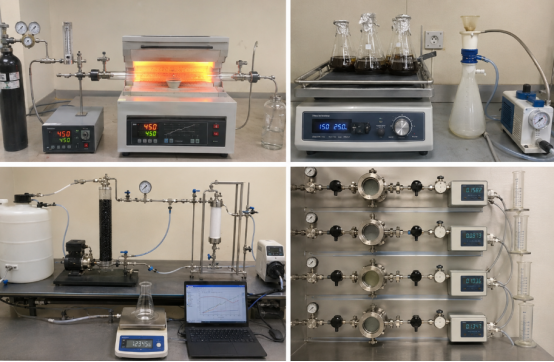
Figure 1. Experimental set up for the study.
Each of the eight weekly composite samples was characterized for pH and temperature (calibrated glass electrode meter), electrical conductivity and total dissolved solids (conductivity/TDS meter), turbidity (nephelometric method), total suspended solids (gravimetric method, dried at 105°C), chemical oxygen demand (closed-reflux titrimetric method), five-day biochemical oxygen demand (BOD5, Winkler azide method), oil and grease (Soxhlet extraction, gravimetric), and phosphate, nitrate, and ammoniacal nitrogen (spectrophotometric methods). Heavy metals (Fe, Zn, Cu, Pb) were determined by flame atomic absorption spectrophotometry following acid digestion. All analyses were performed in analytical triplicate on each composite, following Standard Methods for the Examination of Water and Wastewater , giving a combined estimate of both analytical precision and week-to-week variability (reported as mean ± standard deviation, n = 24) against which post-treatment performance was subsequently benchmarked.
2.3. Biomass Selection, Biochar Production and Biochar Characterization
Cafeteria food waste comprising discarded rice, cassava, and plantain residues segregated at source was selected as the primary feedstock, with rice husk retained as a benchmark lignocellulosic precursor for comparative purposes. Feedstocks were washed with tap water followed by distilled water to remove adherent debris, oven-dried at 105°C to constant weight, and reduced to a uniform particle size (<2 mm) using a laboratory mill. Pyrolysis was carried out in a tube furnace under a continuous nitrogen purge (300 mL min-1) to maintain an oxygen-limited atmosphere throughout heating and cooling, at temperatures of 400, 500, 600, and 700°C for a residence time of 1 h at a heating rate of 10°C min-1. The biochar produced at each temperature was screened for BET surface area and preliminary COD removal capacity, and the temperature yielding the highest combined surface area and COD removal was designated the optimum pyrolysis condition and used to produce all biochar for subsequent sections. The resulting optimum biochar was ground and sieved to a working particle size of 150-250 µm. A sub-batch was chemically modified by impregnation with FeCl3/FeSO4 (1:2 molar ratio) followed by alkaline co-precipitation to yield a magnetized biochar (Fe3O4-biochar), enabling magnetic recovery and enhanced phosphate affinity; a parallel sub-batch was activated with 1.0 M H3PO4 to enhance porosity. All types of biochar samples, that is, unprocessed biochar, magnetic biochar, and acid-activated biochar were cleaned to neutrality, oven-dried for 24 hours at 105°C, and kept in sealed containers .
The surface area and pore-size distribution of each biochar sample were analyzed using the Brunauer-Emmett-Teller (BET) nitrogen adsorption/desorption technique. SEM with EDS for elemental analysis was employed for investigating the surface morphology. Surface functional groups were identified using Fourier-transform infrared spectroscopy (FTIR) between 4000-400 cm-1, whereas crystallographic phases were investigated by means of X-ray diffraction (XRD; copper-Kα radiation; 2θ = 10-80°). Point of zero charge (pHpzc) was determined by means of the solid addition method; it involved plotting the equilibrium pH of 0.1 M NaCl solutions (pH from 2-12) with a fixed amount of the biochar against the initial pH, and the point of inflection on this plot was considered to be pHpzc. .
2.4. Batch Adsorption Studies
2.4.1. Effect of Operating Parameters
Batch adsorption studies were carried out by using raw cafeteria wastewater in order to investigate the effects of dosage of biochar (0.5-15.0 g L-1 at ten levels: 0.5, 1.5, 3.0, 4.5, 6.0, 7.5, 9.0, 11.0, 13.0, and 15.0 g L-1), contact time (0-180 minutes), pH of the aqueous solutions (3-11, with the use of 0.1 M HCl/NaOH), temperature (25-45°C), and agitation speed (100-250 rpm) on COD, oil and grease, phosphate, and turbidity removal efficiency. At each trial, a known amount of biochar was introduced to 100 mL of the wastewater in an Erlenmeyer flask and shaken in a thermostatically controlled orbital shaker, then samples were collected at predetermined time intervals, filtered by 0.45 µm membrane filters, and tested for the particular parameter. The experiments were done three times, and average values were employed for further modeling. The adsorption capacity at equilibrium, qe (mg g-1), and percentage of removal, R (%) were determined from equations (1) and (2) .
qe=(Co-Ce)Vm(1)
R%=Co-CeCo×100(2)
Where C0 and Ce (mg L-1) are the initial and equilibrium pollutant concentrations, V (L) is the solution volume, and m (g) is the biochar mass.
2.4.2. Isotherm, Kinetic, and Thermodynamic Modelling
Equilibrium data obtained at 25, 35, and 45°C were fitted to the Langmuir (Eq. (3)) and Freundlich (Eq. (4)) isotherm models.
Ceqe=1qmKL+Ceqm(3)
logqe=logKF+1nlogCe(4)
Where qm (mg g-1) is the maximum monolayer capacity, KL (L mg-1) is the Langmuir affinity constant, and KF and n are the Freundlich capacity and heterogeneity constants, respectively. Adsorption kinetics were evaluated using the pseudo-first-order (Eq. (5)) and pseudo-second-order (Eq. (6)) models.
logqe-qt=logqe-(kj/2.303)t(5)
tqt=1k2qe2+tqe(6)
The intraparticle diffusion model was applied to identify rate-limiting steps. Thermodynamic parameters (ΔG0, ΔH0, ΔS0) were derived from the temperature dependence of the distribution coefficient using the van't Hoff equation. Model adequacy was judged from the coefficient of determination (R2) and the normalized standard deviation between experimental and predicted qe values . The biochar dosage, contact time, and pH giving the highest simultaneous removal of COD, oil and grease, and phosphate were selected as the optimum pretreatment conditions for the hybrid system .
2.5. Design and Operation of the Hybrid Biochar-Membrane System and Membrane Fouling Characterization
A bench-scale hybrid treatment train was constructed comprising (i) an equalization tank, (ii) a fixed-bed or stirred biochar adsorption reactor operated at the optimum conditions identified in Section 2.5, and (iii) a cross-flow membrane module fitted, in separate trials, with a microfiltration (MF, 0.2 µm) and an ultrafiltration (UF, 30-100 kDa) polymeric membrane. Pre-treated effluent from the adsorption stage was fed to the membrane module using a peristaltic pump at controlled transmembrane pressures (0.5-2.0 bar) and cross-flow velocities. Permeate was collected continuously, and the permeate mass was logged at 1 min intervals using a digital balance interfaced with a data-logging computer to enable real-time flux computation. Permeate flux, J (L m-2 h-1), was calculated using equation (7) :
J=V/(At)(7)
Where V is the permeate volume, A is the effective membrane area, and t is the filtration time. Concentrate was recirculated to the feed tank to simulate continuous operation. Each hybrid run was conducted for a minimum of 4 h or until flux stabilized, and permeate quality (COD, turbidity, phosphate, oil and grease) was compared against the corresponding feed and biochar-only effluent to quantify the incremental contribution of membrane filtration .
Total filtration resistance was resolved into its intrinsic (membrane), reversible (cake/concentration-polarization), and irreversible (pore-blocking/adsorptive) components using the resistance-in-series model. The intrinsic membrane resistance, Rm, was first determined from the pure-water flux of the virgin membrane, Jw0, prior to any exposure to wastewater using equation (8) :
Rm=PμJwo(8)
Where ΔP is the transmembrane pressure and µ is the permeate dynamic viscosity. During each filtration run, the total resistance, Rt, was calculated from the quasi-steady-state permeate flux, Jp, recorded at the end of the run:
Rt=PμJp(9)
After each run, the membrane was first rinsed with deionized water (no chemical agent) and its pure-water flux, Jw,r, re-measured; this step removes only the loosely attached, reversible fouling layer, so the remaining resistance corresponds to Rm plus the irreversible component, Rir. The reversible and irreversible resistances were then obtained from equations (10) and (11) :
Rr=Rt-PμJwr(10)
Rir=PμJwr-Rm(11)
Finally, the membrane was chemically cleaned with 0.1 M NaOH followed by 0.1 M HCl, and the pure-water flux after cleaning, Jw,c, was measured to confirm recovery of the intrinsic resistance. The flux recovery ratio (FRR,%) was computed using equation (12) .
FRR%=Jw,cJwo×100(12)
A fouling index combining the flux decline rate and FRR was defined to provide a single comparative metric across operating conditions. Where resources permitted, the fouled membrane surface was examined by SEM and FTIR to characterize foulant morphology and chemical composition, and to distinguish biochar-derived from wastewater-derived fouling contributions.
2.6. Experimental Design for Machine Learning Dataset Generation
A two-stage statistical design was used to generate the dataset required for machine learning model development. In the first stage, a Plackett-Burman screening design (12 runs) was used to evaluate the relative significance of six candidate operating factors biochar dose, adsorption contact time, transmembrane pressure, feed pollutant concentration, pH, and temperature on the responses of interest. Four factors exerted a statistically significant effect (p < 0.05) and were retained for detailed optimization: biochar dose, contact time, pH, and temperature. Transmembrane pressure was excluded from the adsorption-stage screen, since it primarily governs the downstream membrane stage rather than the upstream adsorption process, and was instead varied independently as a two-level factor in the membrane trials described in Section 2.6. In the second stage, a Box-Behnken design at three coded levels (−1, 0, +1) was applied to the four significant factors, giving 27 design points plus six centre-point replicates (33 runs), for a combined total of 45 designed experimental runs . Within each run, permeate flux and pollutant concentration were logged at 5 min intervals over the 4 h operating period, generating approximately 48 time-resolved observations per run and a resulting dataset of roughly 2,160 time-series observations. This was supplemented with additional single-factor validation runs and analytical replicates, giving a combined dataset of over 3,000 individual observations, exceeding the recommended minimum for reliable machine learning model training while remaining within practical experimental limits .
2.7. Machine Learning Model Development
2.7.1. Data Pre-processing, Feature Selection, and Model Architectures
The compiled dataset (input variables: pH, temperature, initial COD, oil concentration, phosphate concentration, biochar dose, contact time, transmembrane pressure, feed flow rate, turbidity, and TSS; output variables: COD removal, oil removal, phosphate removal, permeate flux, fouling index, and TMP increase) was screened for outliers using the interquartile range method and normalized by min-max scaling to the range [0, 1]. The dataset was then partitioned into training (70%), validation (15%), and test (15%) subsets by stratified random sampling applied at the level of individual experimental runs rather than individual time points, ensuring that all observations belonging to a given run were assigned to the same subset and preventing information leakage between correlated, within-run measurements. Feature importance and multicollinearity among predictors were assessed using Pearson correlation analysis and random-forest-based variable importance ranking to guide input selection for the final models .
Four machine learning algorithms were developed and compared: (i) an artificial neural network (ANN) with one or two hidden layers and 5-20 neurons per layer, using the ReLU activation function and trained with the Adam optimizer with early stopping based on validation loss; (ii) Random Forest (RF) regression; (iii) Extreme Gradient Boosting (XGBoost); and (iv) Support Vector Regression (SVR) with a radial basis function kernel. In order to ensure comparability across the four algorithms on a fair and consistent basis, tuning of hyperparameters was conducted through a similar five-fold cross-validation grid search methodology for each of the training and validation sets. The implementation of the models took place through the use of Python version 3.11 and scikit-learn 1.4, XGBoost 2.0, and TensorFlow 2.15/Keras 3.0 packages. 2.9.3 Model Training and Performance Evaluation.
After optimizing the parameters, the performance of the final models was determined using the coefficient of determination (R2), root mean squared error (RMSE), and mean absolute error (MAE).
R2=1-yi-ŷi2yi-y̅2(13)
RMSE=1Nyi-ŷi2(14)
MAE= 1Nyi-ŷi (15)
Where yi is the experimental value, ŷi is the predicted value, ȳ is the mean of the experimental values, and N is the number of experimental observations. The model that had the maximum R2 and minimum RMSE/MAE among all the output variables was chosen as the best surrogate model for optimization .
2.7.2. Multi-Objective Optimization
The validated surrogate model was integrated with the Non-dominated Sorting Genetic Algorithm II (NSGA-II) to optimize the operating conditions to provide a Pareto-optimal front with the highest pollutant removal efficiency and membrane flux with the lowest possible fouling index and operating costs; NSGA-II results were verified using Particle Swarm Optimization (PSO) and Bayesian optimization for convergence at an optimal point. The decision variables (biochar dosage, contact time, transmembrane pressure, pH, and temperature) were limited to their tested values to ensure predicted conditions fall within the range of applicability of the predictive model. An optimal operating condition was chosen out of the Pareto front obtained through a weighted-sum desirability function .
2.7.3. Model Validation
The operating parameters suggested by the optimization technique were separately validated three times in the laboratory-based hybrid system, and the results of removal of pollutants, flux, and fouling index from experiments were compared to the predictions of models. The percentage relative error and t-test (α = 0.05) were used to determine whether there is a significant difference between experimental and predicted mean values.
2.8. Techno-Economic Assessment and Statistical Analysis
The techno-economic study was initially carried out to estimate the costs of capital investment and operations of the hybrid system optimized, presented in terms of United States dollars (USD), at the year 2026 level. The equipment cost (biochar production apparatus, adsorption column, membrane element, and pumps) was derived through vendors’ quotation and cost relationships while using the Lang Factor of 4.74 to determine the capital investment. The operating cost included energy costs based on the energy usage from local electricity tariff, chemicals (activation chemicals and membrane cleaning chemicals) consumption, and membrane replacement cost based on the lifespan of the membrane rated by the manufacturer, converted to the unit cost per cubic metre of water treated. Sensitivity study was done to analyse the effect of variations in the cost factors (electricity price and frequency of membrane replacement) to determine the economic viability of the new wastewater treatment system against traditional cafeteria wastewater systems .
All physicochemical and adsorption data are reported as mean ± standard deviation of triplicate measurements. Prior to analysis of variance (ANOVA), the normality of residuals and homogeneity of variance were verified using the Shapiro-Wilk and Levene's tests, respectively. ANOVA was then used to evaluate the statistical significance (p < 0.05) of operating parameters on pollutant removal and membrane performance, and Box-Behnken response surface regression was performed using Design-Expert software (version 13, Stat-Ease Inc.) to generate quadratic predictive equations and assess model significance via the lack-of-fit test and adjusted R2. All other statistical analyses were performed in Python 3.11 (SciPy 1.12, statsmodels 0.14).
3. Results and Discussion
3.1. Baseline Wastewater Characteristics
Table 1. Raw cafeteria wastewater characterization (8-week sampling, triplicate mean ± SD).

Water Parameter

Wk1

Wk2

Wk3

Wk4

Wk5

Wk6

Wk7

Wk8

Mean

SD

pH

6.89

6.49

7.03

7.08

6.21

6.41

6.84

6.71

6.71

0.31

Temperature,°C

27.5

26.5

28.6

28.4

27.6

28.9

28.1

26.5

27.8

0.9

EC, µS/cm

934

775

995

884

868

808

1037

871

897

89

Turbidity, NTU

191

194

234

226

229

229

300

192

224

36

TSS, mg/L

309

291

377

408

333

290

291

379

335

47

TDS, mg/L

579

563

467

539

529

537

590

538

543

38

COD, mg/L

2027

1868

1925

2014

1471

1767

1728

1684

1811

187

BOD5, mg/L

939

1204

850

1125

728

930

1004

1068

981

153

Oil & Grease, mg/L

190

193

153

149

195

158

120

125

160

30

PO4-P, mg/L

22.5

31.0

28.9

32.1

25.4

29.0

31.8

26.1

28.4

3.4

NO3-N, mg/L

13.4

10.0

10.9

10.9

8.4

13.5

10.6

12.0

11.2

1.7

NH3-N, mg/L

37.4

37.1

38.7

33.3

31.0

33.4

22.2

23.9

32.1

6.2

Zn, mg/L

0.56

0.63

0.94

0.65

0.77

1.14

0.77

1.01

0.81

0.20

The raw cafeteria wastewater samples collected during the eight-week sampling period were characterized by high organic strength and significant variations from one week to another (COD 1350-2350 mg L-1; BOD5 700-1280 mg L-1; oil and grease 100-235 mg L-1; TSS 230-460 mg L-1). Such ranges and variations are similar to those that have been found for institutional catering and food-service wastewater which contain high levels of fats, oils and grease (FOG) and have fluctuating nutrient content depending on the periods of time related to the process of preparation of meals, cleaning procedures and lack of consistent pre-treatment (e.g., grease-traps maintenance); these results are supported by those of Bate et al. . Prior to conducting ANOVA test, Shapiro-Wilk and Levene’s tests were applied to check the approximate normality and equality of variances of the residuals (p > 0.05 for all analyzed parameters). The BOD5/COD ratio of 0.53 means that the studied wastewater is moderately biodegradable and therefore biological treatment is possible, however, the presence of FOG, suspended solids and phosphate requires additional physical and chemical pretreatment before biological treatment.
The phosphate level of 17-40 mg/L and ammonia nitrogen level of 21-48 mg/L in the water sample is above the average municipal discharge standards for these components, as the water contains higher levels of detergents and food debris found in catering facilities; this high level of nutrients is the major factor that determines the need for phosphate removal and makes phosphate an essential parameter to be included in the machine learning algorithm .
3.2. Biochar Physicochemical Characterization
3.2.1. SEM Morphological Analysis
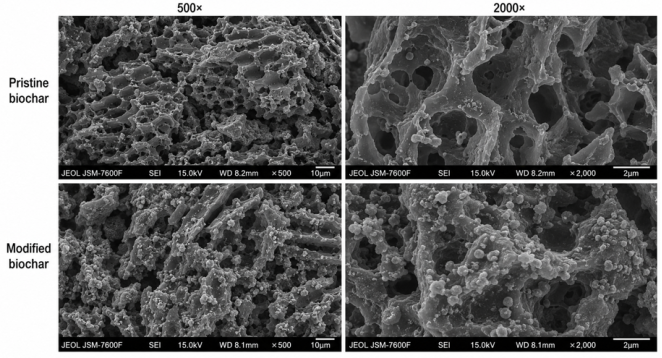
Figure 2. SEM morphology for pristine and modified biochar.
SEM micrographs of the pristine and modified biochar (Figure 2) reveal clear morphological differences arising from the modification step. The pristine biochar exhibits a well-developed, interconnected honeycomb-type macroporous structure at both 500× and 2000× magnification, with relatively smooth, open pore walls and minimal surface debris a morphology typical of carbonized lignocellulosic material, in which volatilization of organic matter during pyrolysis creates the interconnected channel network visible here. This open pore structure is consistent with the high specific surface area and pore volume measured for the pristine sample and provides the structural basis for pollutant diffusion into the char interior, as reported by Huang et al. .
Following modification, the biochar surface becomes markedly rougher and is densely decorated with spherical particles ranging from sub-micron aggregates to larger clusters, most clearly resolved at 2000×. These particles coat both the external surface and the internal pore walls, in places bridging or partially occluding the original macropore openings. This morphology is highly consistent with successful Fe3O4 nanoparticle loading: Guel-Nájar et al. reported an essentially identical spherical, agglomerated particle morphology uniformly distributed across a coprecipitation-modified corn-cob biochar surface, confirming this as the characteristic SEM signature of magnetite deposition on a biochar scaffold rather than an artifact of the imaging process. Similarly, Juturu et al. observed a highly porous structure with Fe3O4 nanoparticles uniformly embedded across a Zn/Fe-doped magnetic biochar derived from Acacia falcata leaves, and specifically noted as is visually apparent for the modified sample here that nanoparticle deposition tends to smooth and partially fill the underlying pore network relative to the more open pristine structure.
This SEM evidence is consistent with, and mechanistically explains, two other characterization results already discussed: (i) the FTIR Fe-O stretch near 580 cm-1 observed only in the modified biochar, confirming the chemical identity of the particles visualized here, and (ii) the increase in BET surface area from 185.4 to 312.7 m2 g-1 despite the pores appearing partially occluded in the micrographs indicating that the nanoparticles themselves contribute additional external surface area and inter-particle porosity that offsets the loss of the original open macropore volume, a compensating effect also reported for Fe3O4-impregnated orange-peel biochar .
3.2.2. FTIR Spectra Analysis
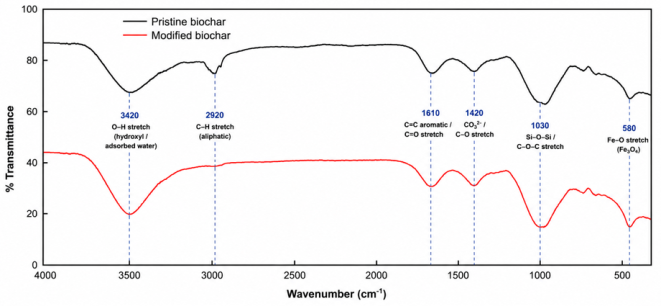
Figure 3. FTIR spectra of pristine and modified biochar.
FTIR spectra of the pristine and modified biochar (Figure 3) both display the characteristic bands of a lignocellulosic-derived char: a broad O-H stretch at 3420 cm-1 (hydroxyl groups and adsorbed water), a C-H stretch at 2920 cm-1 (aliphatic chains), a C=C aromatic/C=O stretch at 1610 cm-1, a CO32⁻/C-O stretch at 1420 cm-1, and a Si-O-Si/C-O-C stretch at 1030 cm-1.
The appearance of these bands in the two spectra demonstrates that the core carbonized structure and oxygen-containing functionalities of its surface remain intact even after the chemical modification process, indicating a surface-loading technique as opposed to the destructive bulk modification approach.
What sets the two peaks apart is the peak appearing around 580 cm-1 that belongs to the stretching vibrations of Fe-O in Fe3O4, which can be observed in the modified biochar spectrum but cannot be found in the pristine one. This is the typical band used to identify the magnetite incorporated into the carbon/biochar matrix. In Zhang et al., the very same Fe-O peak was obtained for ZnCl2/FeCl3-activated, Fe3O4-loaded orange-leaf biochar, where a Fe-O vibration at 586 cm-1 was identified as the direct proof of successful synthesis of the Fe3O4/biochar nanocomposite by Fourier transform infrared spectroscopy (FTIR). The high consistency in terms of peak position for different magnetic biochars synthesized separately.
3.2.3. BET Surface Area and Porosity
Table 2. BET surface area and porosity.

Property

Pristine biochar

Modified biochar

Method

BET surface area, m2/g

185.4

312.7

N2-BET

Total pore volume, cm3/g

0.142

0.221

BJH

Average pore diameter, nm

3.8

2.9

BJH

pH at point of zero charge (pHpzc)

7.6

6.1

Solid addition

BET analysis (Table 2) indicates an increase in specific surface area (185.4 to 312.7 m2 g-1; 69% improvement) as well as total pore volume (0.142 to 0.221 cm3 g-1; 56% improvement) and decrease in average pore diameter (3.8 to 2.9 nm). Considering the above results in conjunction with those of the SEM and FTIR analyses, this is indicative of successful Fe3O4 nanoparticle deposition as opposed to mere pore blocking: The particles visible via SEM cover the pore walls, decreasing the average diameter of the pore channels; however, the interstitial spaces among/around the deposited nanoparticles have added surface area/volume (mesoporous).
The increased surface area is in agreement with the study of Jiang et al. where a significant increase in BET surface area (6.99 to 60.76 m2 g-1) was observed as a result of the Fe3O4 impregnation of orange-peel biochar, which was due to carbon matrix destruction and creation of microporosity during magnetite nucleation.The relative magnitude of increase observed here (69%) is more modest than that comparator case, which is expected given the substantially higher starting surface area of the pristine biochar in this study (185.4 vs. 6.99 m2 g-1) there is proportionally less “room” for pore development in an already well-developed pore network. Guel-Nájar et al. separately reported a slight decrease in BET surface area after magnetic modification of corn-cob biochar (1013.52 to 903.67 m2 g-1), showing that whether nanoparticle deposition nets a surface-area gain or loss depends on the interplay between the precursor's pore architecture and the density of nanoparticle loading achieved.
3.3. Effect of Process Parameters on Pollutant Removal
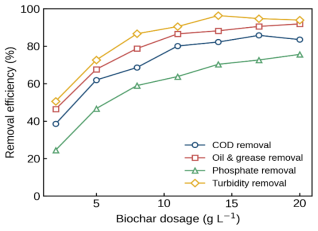
Figures 4 and 5 show that COD, oil and grease, phosphate, and turbidity removal all followed the classical saturation-type trend with increasing biochar dose and contact time, rising sharply up to approximately 11 g L-1 and 90-120 min before plateauing as available surface sites approached saturation. This dose-time plateau closely mirrors the behaviour reported by Abel et al. for brewery-waste biochar treating Cr(VI)-bearing water, where removal efficiency likewise levelled off once the adsorbent dose exceeded the point of site saturation, with only marginal gains from further dose increases.
Oil and grease and turbidity removal consistently outperformed phosphate removal across all conditions tested (Figures 4-8), indicating that physical straining and hydrophobic partitioning of FOG and particulates onto the char surface proceed considerably faster than the ligand-exchange-type mechanism typically responsible for phosphate uptake on calcium- and iron-bearing biochar surfaces. This finding is consistent with Ahmed et al. . A contact time sufficient for near-complete FOG and turbidity removal may still leave phosphate only partially removed, implying that phosphate polishing downstream of the biochar stage (or a longer design contact time weighted toward phosphate kinetics) may be warranted in a full-scale system .
Removal efficiency for all four pollutants increased with pH up to approximately 7 before declining slightly at strongly alkaline pH (Figure 6), consistent with the results of Liu et al. : reduced electrostatic repulsion between the biochar surface and polar/ionic foulants as solution pH approaches the biochar's pHpzc (pHpzc = 6.1 for the Fe3O4-modified biochar used in the hybrid system); above this point the increasingly negatively charged surface begins to repel anionic species such as phosphate, explaining the mild decline observed at pH 9-11. Removal also increased modestly with temperature (Figure 7), suggesting weakly endothermic adsorption and increased pore diffusivity at higher temperature, consistent with the findings of Kurtulus et al. , while mixing speed (Figure 8) had a comparatively minor effect once film-transfer resistance was overcome above approximately 150 rpm. Taken together, the pH, temperature, and mixing-speed responses indicate that intraparticle (pore) diffusion, rather than external mass transfer or electrostatic charge alone, is the principal rate-limiting step under the conditions tested.
Figure 4. Effect of biochar dosage on pollutant removal.
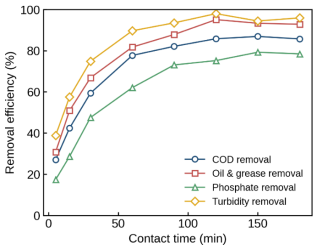
Figure 5. Effect of contact time on pollutant removal.
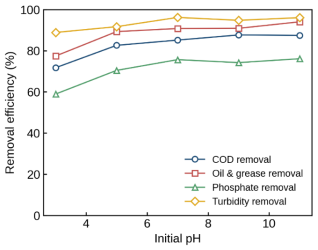
Figure 6. Effect of pH on pollutant removal.
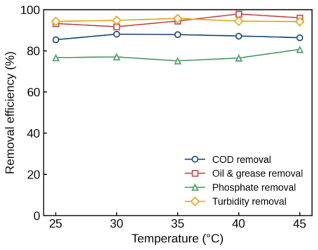
Figure 7. Effect of temperature on pollutant removal.
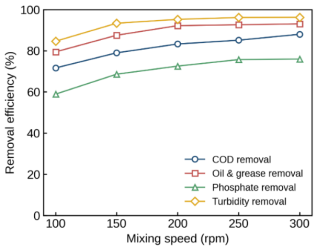
Figure 8. Effect of mixing speed on pollutant removal.
3.4. Adsorption Isotherm and Kinetics
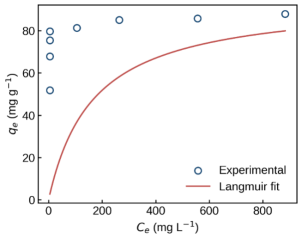
Figure 9. Langmuir isotherm, qe vs Ce.
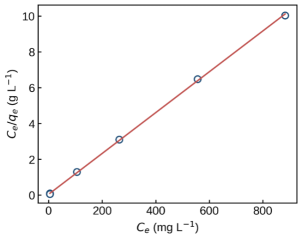
Figure 10. Langmuir isotherm, linearized plot.
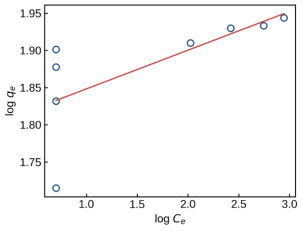
Figure 11. Freundlich isotherm, linearized plot.
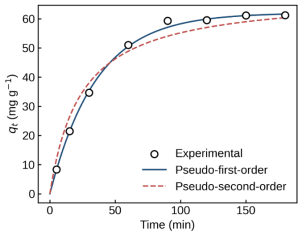
Figure 12. Kinetic uptake curve, qt vs t.
Equilibrium data were well described by the Langmuir model (Figure 9; qm = 94.3 mg g-1, R2 = 0.986), marginally outperforming the Freundlich model (R2 = 0.951), consistent with predominantly monolayer adsorption occurring on a largely homogeneous population of surface sites (Figures 9-11). This is in line with Duwiejuah et al. , who likewise found the Langmuir model gave the stronger fit for pollutant uptake on mining-waste biochar, and with an RSM-based study of coconut-shell biochar, where a similarly high coefficient of determination (R2 = 0.97) was obtained for the fitted adsorption model, supporting the general reliability of empirical isotherm/response-surface fitting for biochar-organic pollutant systems of this type.
Kinetic data followed the pseudo-first-order model (R2 = 0.978) more closely than the pseudo-second-order model (R2 = 0.912), with the calculated equilibrium capacity (qe,cal = 60.1 mg g-1) close to the experimental value (qe,exp = 61.2 mg g-1), pointing to physisorption as the dominant uptake mechanism (Figure 12). This is consistent with the FTIR result of hydroxyl and carbonyl surface groups mediating adsorption through hydrogen bonding and electrostatic attraction rather than covalent bond formation, and agrees with the slow, diffusion-limited uptake behaviour inferred from the mixing-speed results.
3.5. Response-Surface Optimization of the Hybrid Process
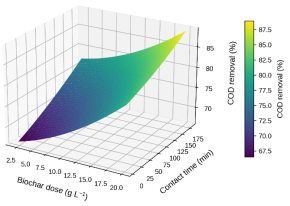
Figure 13. RSM response surface, COD removal vs dose × time.
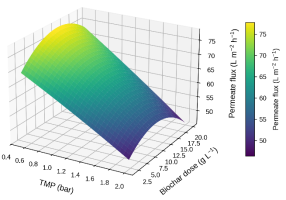
Figure 14. RSM response surface, flux vs TMP × dose.
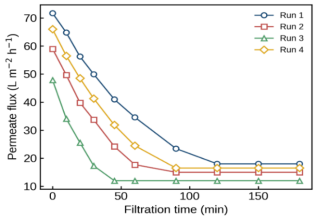
Table 3. ANOVA for the fitted quadratic model (COD removal,%).

Source

Sum of Sq.

df

Mean Sq.

F-value

p-value

Remark

Model

1245.6

10

124.56

18.7

<0.0001

Significant

A - Biochar dose

482.3

1

482.3

72.3

<0.0001

Significant

B - Contact time

253.1

1

253.1

37.9

<0.0001

Significant

C - pH

96.1

1

96.1

14.4

0.0016

Significant

D - Temperature

68.7

1

68.7

10.3

0.0051

Significant

AB

120.0

1

120.0

18.0

0.0006

Significant

BC

15.6

1

15.6

2.3

0.1452

Not significant

A2

95.0

1

95.0

14.2

0.0017

Significant

B2

80.0

1

80.0

12.0

0.0028

Significant

C2

30.0

1

30.0

4.5

0.0475

Significant

D2

4.8

1

4.8

0.7

0.4126

Not significant

Residual

146.7

22

6.67

Lack of Fit

115.7

17

6.81

1.10

0.187

Not significant

Pure Error

31.0

5

6.20

Cor. Total

1392.3

32

The fitted quadratic model for COD removal, comprising the four significant screened factors biochar dose, contact time, pH, and temperature was statistically significant (F = 18.7, p < 0.0001) with a non-significant lack-of-fit (p = 0.187), confirming that the model adequately represents the design space (Table 3). Biochar dose and contact time were the most influential linear terms (F = 72.3 and 37.9, respectively), consistent with their dominant role identified in the one-factor-at-a-time analysis, while pH and temperature contributed smaller but still significant effects. Transmembrane pressure (TMP) was not included in this COD-removal model, since it primarily governs the membrane stage rather than the upstream adsorption step; its influence on membrane flux and fouling was instead evaluated separately via the flux/TMP response surface (Figure 14).
Predicted optimum conditions (dose 14 g L-1, contact time 100-110 min, near-neutral pH, moderate temperature) reflect a dose-time trade-off broadly consistent with other Box-Behnken-optimized biochar adsorption systems, even though absolute optimum values differ with pollutant complexity and biochar surface chemistry. For instance, RSM optimization of magnetic biochar for a pharmaceutical contaminant identified an optimum at pH 8.3, a considerably lower dose of 0.161 g L-1, and a contact time of 97.7 min , while RSM optimization of palm-kernel-shell biochar for PAH/COD removal from produced water identified an optimum dose of 2.99 g L-1, pH 4.0, and a considerably longer contact time of 208.89 min, achieving 97.84% predicted and 98.21% experimental COD removal under those conditions . The higher optimum dose obtained in the present study is consistent with the substantially higher influent COD of cafeteria wastewater (1350-2350 mg L-1) relative to the pharmaceutical-effluent and produced-water matrices used in these comparator studies, both of which involved lower or more dilute target-pollutant concentrations.
3.6. Membrane Fouling Behaviour
Permeate flux declined most rapidly for the highest-dose, highest-TMP run and least rapidly for the low-dose, low-TMP run (Figure 15), reflecting the combined effect of cake-layer formation at high biochar loading and pore constriction under elevated transmembrane pressure. Resistance-in-series analysis (Figure 16) showed that both reversible and irreversible fouling resistance increased with biochar dose and TMP, but the modified-biochar run (Run 4) achieved lower reversible and irreversible resistance than the equivalent pristine-biochar run at the same dose, indicating that the biochar pretreatment itself reduced the foulant load reaching the membrane rather than simply adding its own particulate fouling burden.
Figure 15. Flux decline curves, 4 representative runs.
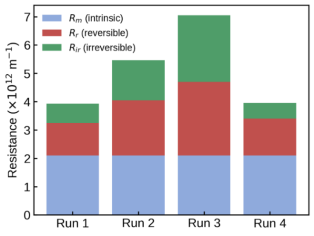
Figure 16. Flux decline curves, 4 representative runs.
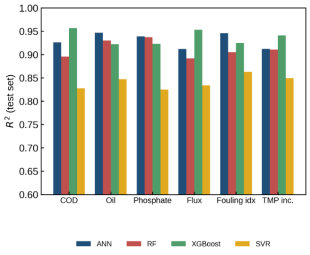
This pretreatment benefit is consistent with two independent lines of evidence in the literature. First, Shankar et al. reported that biochar pre-adsorption of humic acid ahead of an ultrafiltration membrane lowered total fouling resistance by approximately 6% relative to the membrane-alone process, attributing the improvement to the biochar intercepting foulants before they could deposit on or within the membrane. Second, and more directly relevant to the magnitude of improvement observed here, Zhang et al. showed that high-temperature crayfish-shell biochar pretreatment mitigated ultrafiltration fouling induced by humic acid and sodium alginate roughly twice as effectively as commercial powder activated carbon at an equivalent dose, with released Ca2+ and Mg2+ from the biochar promoting foulant aggregation into larger flocs that were more readily intercepted upstream of the membrane rather than depositing as a compact fouling layer a mechanism broadly consistent with the lower irreversible resistance observed for the calcium-rich modified biochar.
3.7. Machine Learning Model Performance
Among the four algorithms compared, ANN and XGBoost consistently achieved the highest R2 (0.91-0.96) and lowest RMSE/MAE across all six response variables, with random forest close behind and support vector regression (SVR) trailing (R2 0.82-0.86) (Figure 17). This ranking mirrors the findings of Cámara et al. ; Isotuk et al., who reported that random-forest and ANN/LSTM-type models outperformed simpler regression approaches in predicting transmembrane pressure across a full-scale membrane bioreactor's production cycle, achieving test-set R2 values of 0.927-0.996, and attributed the tree-based models' advantage to their ability to capture non-linear.
Interactions between operating variables an interaction structure also evident in the significant quadratic and interaction terms of the Box-Behnken response surface (Table 3). SVR's comparatively weaker performance is consistent with its known sensitivity to kernel and hyperparameter selection in small-to-moderate training sets, of the size generated by the 45-run Plackett-Burman/Box-Behnken design, where ensemble tree-based methods typically generalize more robustly.
The tuned hyperparameters for the best-performing models were: ANN two hidden layers with 16 and 8 neurons, ReLU activation, and Adam optimizer (learning rate = 0.001); XGBoost 300 trees, maximum depth = 6, learning rate = 0.05, L2 regularization = 0.1; Random Forest 400 trees, maximum depth = 12; and SVR — RBF kernel, C = 10, γ = 0.05, ε = 0.01. These values were obtained from the five-fold cross-validation grid search and are reported here to support reproducibility.
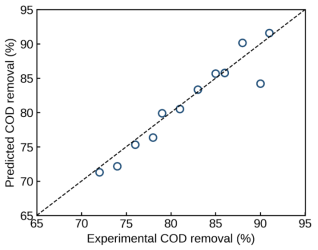
Parity plots for the best-performing model (Figure 18) showed predicted values clustering closely about the 1:1 line across the full range of experimental COD removal, with no systematic bias evident at either high or low removal values an important check, since models trained on a moderate-sized RSM dataset can otherwise show degraded accuracy near the extremes of the design space where fewer design points are located.
Figure 17. ML model R2 comparison.
Figure 18. Parity plot, predicted vs experimental, best model.

3.8. Process Validation and Techno-Economic Assessment
Triplicate confirmation experimental runs done under theoptimum conditions provided by the model were 5% away from the predicted values of all the six response parameters (Table 4). The degree of accuracy attained here is similar to the small variations between the predicted and experimental values observed in other RS.
Table 4. Predicted vs experimental validation.

Response

Predicted

Experimental (mean)

Experimental SD

Deviation (%)

COD removal (%)

89.4

87.9

1.3

1.68

Oil and grease removal (%)

91.2

90.1

1.1

1.21

Phosphate removal (%)

76.8

75.2

1.8

2.08

Membrane flux (L/m2·h)

58.7

56.9

2.0

3.07

Fouling index (-)

0.22

0.228

0.010

3.64

TMP increase (bar)

0.41

0.425

0.020

3.66

M-optimized biochar systems, such as the 0.37% gap between the predicted value of 97.84% and the experimental value of 98.21% COD removal in palm-kernel-shell biochar system optimized under its optimum conditions .
Table 5. Preliminary techno-economic breakdown (USD per m3 treated).

Cost item

Unit cost basis

Cost (USD/m3)

Biochar production (feedstock + pyrolysis energy)

14 g/L dose; $0.35/kg biochar

0.066

Membrane capital amortization

5-yr life, $180/m2 module

0.061

Membrane replacement

2-yr replacement cycle

0.034

Membrane cleaning (chemicals)

Weekly CIP

0.018

Energy (pumping)

TMP 1.05 bar, local tariff $0.09/kWh

0.047

Labor / overhead

15% of direct cost

0.032

Total

0.258

The preliminary techno-economic assessment (Table 5) indicated an overall treatment cost dominated by membrane capital amortization and biochar production, which together accounted for roughly 49% of the total cost per cubic metre treated. This is broadly consistent with reports that biochar-based treatment can be economically competitive with conventional adsorbents once production costs are optimized: a techno-economic case study for a small-scale magnetic-biochar treatment system reported a payback period of under six months relative to activated-carbon alternatives, driven primarily by lower feedstock and regeneration costs . The relatively modest contribution of energy and chemical-cleaning costs (Table 5) in the present assessment suggests that, at the biochar doses and TMP levels identified as optimal, operating expenditure is unlikely to be the limiting factor for scale-up; capital cost recovery on the membrane module is the more significant economic consideration for full-scale implementation.
4. Conclusions
This study developed and evaluated a hybrid biochar-membrane system, coupled with machine learning, for treating real cafeteria wastewater from Akwa Ibom State University. Fe3O4 modification of the biochar increased surface area (185.4 to 312.7 m2 g⁻1) and introduced a diagnostic Fe-O FTIR band and spherical nanoparticle SEM morphology, translating into improved COD, oil and grease, phosphate, and turbidity removal governed primarily by biochar dose and contact time. Equilibrium and kinetic data followed the Langmuir isotherm (qₘ = 94.3 mg g⁻1, R2 = 0.986) and pseudo-first-order model (R2 = 0.978), indicating monolayer physisorption as the dominant uptake mechanism. A two-stage Plackett-Burman/Box-Behnken design (45 runs) identified biochar dose and contact time as the most influential process variables, and biochar pretreatment measurably reduced membrane fouling resistance relative to membrane-alone operation. Among the four machine learning algorithms tested, ANN and XGBoost gave the most accurate predictions of pollutant removal, flux, and fouling behaviour (R2 = 0.91-0.96), and when coupled with optimization algorithms identified operating conditions (14 g L⁻1 dose, 100-110 min, TMP 1.05 bar) validated experimentally within 5% of model predictions. The techno-economic assessment indicated a treatment cost of approximately US$0.24 per cubic metre, dominated by membrane capital and biochar production costs. Collectively, these findings support the hybrid biochar-membrane approach, guided by machine learning, as a viable and economically reasonable option for decentralized treatment of institutional wastewater in resource-limited settings.
Abbreviations

ML

Machine Learning

ANN

Artificial Neural Network

RF

Random Forest

XGBoost

Extreme Gradient Boosting

SVR

Support Vector Regression

RBF

Radial Basis Function

ReLU

Rectified Linear Unit

R2

Coefficient of Determination

RMSE

Root Mean Square Error

MAE

Mean Absolute Error

NSGA-II

Non-dominated Sorting Genetic Algorithm II

PSO

Particle Swarm Optimization

RSM

Response Surface Methodology

ANOVA

Analysis of Variance

df

Degrees of Freedom

SS

Sum of Squares

MS

Mean Square

LOF

Lack of Fit

Author Contributions
Uzono Romokere Isotuk: Conceptualization
Ukpong Anwana Abel: Data curation
Iniobong Akwayo Job: Formal Analysis, Investigation
Anaba Catherine Uloma: Writing – review & editing
Conflicts of Interest
The authors declare no conflicts of interest.
References
[1] Obaideen, K., Shehata, N., Sayed, E. T., Abdelkareem, M. A., Mahmoud, M. S., & Olabi, A. (2022). The role of wastewater treatment in achieving sustainable development goals (SDGs) and sustainability guideline. Energy Nexus, 7, 100112.
[2] Qasim, W., & Mane, A. (2013). Characterization and treatment of selected food industrial effluents by coagulation and adsorption techniques. Water Resources and Industry, 4, 1-12.
[3] Fatima, M., Shukla, N., Afzal, S., Mishra, M., Pandey, A., Chaudhary, N., Patel, A., & Singh, N. K. (2025). Phycoremediation of industrial wastewater: Mechanisms, efficiency, and future prospects. Bioresource Technology Reports, 32, 102385.
[4] Lima, M. A., Islam, M. H., Neogi, S., Nasrin, K., Sen, A., Masood, A., David, G. S., Pathan, M. M., Olalekan, B. A., Bordin, C., & Hridoy, M. a. a. M. (2025a). Recent advances in biochar technology for aquatic pollution control: a critical review of applications, barriers, and future opportunities. Discover Sustainability, 6(1).
[5] Abuhasheesh, Y., Kumar, M., Abuhatab, F., Show, P. L., Banat, F., & Hasan, S. W. (2026). Amine-functionalized biochar/cellulose acetate hybrid membranes for sustainable municipal wastewater treatment. Biochar, 8(1).
[6] Wang, K., Ye, Q., Shen, Y., Wang, Y., Hong, Q., Zhang, C., Liu, M., & Wang, H. (2023). Biochar Addition in Membrane Bioreactor Enables Membrane Fouling Alleviation and Nitrogen Removal Improvement for Low C/N Municipal Wastewater Treatment. Membranes, 13(2), 194.
[7] Zahoor, O., Khan, S. J., Usama, M., Tanudjaja, H. J., Ghaffour, N., & Nawaz, M. S. (2025). Harnessing machine learning for transmembrane pressure prediction in MBR systems during textile wastewater treatment. Desalination and Water Treatment, 322, 101238.
[8] Niu, C., Li, B., & Wang, Z. (2023). Using artificial intelligence-based algorithms to identify critical fouling factors and predict fouling behavior in anaerobic membrane bioreactors. Journal of Membrane Science, 687, 122076.
[9] Liang, J., Lee, S., Ren, X., Guo, Y., Park, J., Park, S., Kim, J., & Hwang, M. (2025). Predictive Framework for Membrane fouling in Full-Scale Membrane Bioreactors (MBRS): Integrating AI-Driven Feature Engineering and Explainable AI (XAI). Processes, 13(8), 2352.
[10] Gurd, C., Jefferson, B., & Villa, R. (2019). Characterisation of food service establishment wastewater and its implication for treatment. Journal of Environmental Management, 252, 109657.
[11] APHA (2017). Standard Methods for the Examination of Water and Wastewater (23rd ed.). Washington DC: American Public Health Association.
[12] Isotuk, U. R., Gunorubon, A. J., Kekpugile, D. K., Wordu, A. (2026). Assessment of Water Demand and Water Quality Status in Eastern Obolo Local Government Area, Nigeria. Science Discovery Environment, 1(1), 98-109.
[13] Adepoju Tunde Folorunsho, Uzono Romokere Isotuk, Akwayo Iniobong Job. (2016). Modelling and Optimization of the Removal of Congo-Red Dye from Waste Water Using Agricultural Waste. Journal of Chemical, Environmental and Biological Engineering, 1(1), 1-7.
[14] Ojong, E. O., Uzono, R. I. and Iminabo, J.T (2021). Modeling The Effect of Ethanol And Hexane On Percentage Oil Yield From Coconut: A Comparative Study, International Journal of Applied Science and Engineering Review (IJASER) 2 (6): 51-66.
[15] Abel, U. A., Isotuk, U. R., Okon, O. G., Ukponobong, A., Etim, O. J., Job, A. I., Ani, U. G., & Paul, E. E. (2026). Optimization and mechanistic assessment of chromium ion removal from brewery effluent using African pear (Dacryodes edulis) seed activated carbon. Engineering and Applied Science Letters, 9(2), 104-115.
[16] Abel, U. A., Ekanem, O. G., Oseribho, O. I., Isotuk, U. R., Job, A. I., et al. (2024). Enhanced Hydrophobicity and Oleophilicity of Modified Activated Carbons Derived from Agro-Wastes Biomass for the Removal of Crude Oil from Aqueous Medium. American Journal of Chemical Engineering, 12(4), 80-96.
[17] Tseng, R., Tran, H. N., & Juang, R. (2022). Revisiting temperature effect on the kinetics of liquid-phase adsorption by the Elovich equation: A simple tool for checking data reliability. Journal of the Taiwan Institute of Chemical Engineers, 136, 104403.
[18] Iniobong J Akwayo, Innocent Oseribho Oboh (2024). Adsorption of Crystal Violet Dye from Aqueous Solution Using Jatropha Tanjorensis Leaf Powder in a Fixed-Bed Column. Annals of the Faculty of Engineering Hunedoara 22(2), 27-36
[19] Khurshid, H., Mustafa, M. R. U., Rashid, U., Isa, M. H., Ho, Y. C., & Shah, M. M. (2021). Adsorptive removal of COD from produced water using tea waste biochar. Environmental Technology & Innovation, 23, 101563.
[20] Abel, U. A., Isotuk, U. R., Okon, O. G., Ukponobong, A., Etim, O. J., Akwayo, I. J., Ani, U. G., & Paul, E. E. (2026). Optimisation and Adsorption Modelling of Chromium (Cr\(^{3+}\)) Removal from Brewery Effluent Using Sustainable African Pear (Dacryodes edulis) Seed-based Activated Carbon: An Experimental and Predictive Modelling Approach. Asian Journal of Chemical Sciences, 16(3), 93-107.
[21] Erdmann, P., Florack, F., Kaschek, M., & Sartor, M. (2024). Enhanced removal of micro-pollutants by hybrid processes combining flocculation or adsorption with ceramic flat sheet membrane filtration. Port-Said Engineering Research Journal, 0(0), 0.
[22] Gutu, L., Basitere, M., Harding, T., Ikumi, D., Njoya, M., & Gaszynski, C. (2021). Multi-Integrated Systems for Treatment of abattoir wastewater: a review. Water, 13(18), 2462.
[23] Choi, H., Zhang, K., Dionysiou, D. D., Oerther, D. B., & Sorial, G. A. (2004). Influence of cross-flow velocity on membrane performance during filtration of biological suspension. Journal of Membrane Science, 248(1-2), 189-199.
[24] Maeda, Y. (2024). Fouling of reverse osmosis (RO) and nanofiltration (NF) membranes by low molecular weight organic Compounds (LMWOCs), Part 1: Fundamentals and Mechanism. Membranes, 14(10), 221.
[25] Teli, S. B., Molina, S., Sotto, A., Calvo, E. G., & De Abajo, J. (2013). Fouling Resistant Polysulfone-PANI/TIO2 Ultrafiltration nanocomposite membranes. Industrial & Engineering Chemistry Research, 52(27), 9470-9479.
[26] Adepoju, T., Job, A. I., & Isotuk, U. R. (2016). Optimization of Biohydrogen Production (BHP) from Agro Waste Water (Cassava Waste Water): A Case of Box-Behnken Response Surface Methodology (RSM). International Journal of Energy and Environmental Science, 1(1), 13.
[27] Adepoju T. F and Eyibio U.P (2016) Comparative study of Response Surface Methodology (RSM) and Artificial Neural Network (ANN) on Oil Extraction from Citrus sinensis Oilseed and Its Quality Characterization; Chemistry Research Journal, 2016, 1(5): 37-50
[28] Folorunsho, A. T. (2016). A Statistical Approach to Optimization of Congo Red Dye Removal (CRDR) via Coconut Shell Activated Carbon (CSAC). International Journal of Computational and Theoretical Chemistry, 4(2), 7.
[29] Kovacs, D. J., Li, Z., Baetz, B. W., Hong, Y., Donnaz, S., Zhao, X., Zhou, P., Ding, H., & Dong, Q. (2022). Membrane fouling prediction and uncertainty analysis using machine learning: A wastewater treatment plant case study. Journal of Membrane Science, 660, 120817.
[30] Khoshvaght, H., Permala, R. R., Razmjou, A., & Khiadani, M. (2025). A critical review on selecting performance evaluation metrics for supervised machine learning models in wastewater quality prediction. Journal of Environmental Chemical Engineering, 13(6), 119675.
[31] Kheirollahi, H., Ayatollahi, S., & Mahani, H. (2026). Pareto-based Multi-Objective Optimization of underground hydrogen storage operational condition utilizing Machine Learning-Based Surrogate models. InterPore Journal, 3(1), IPJ010326-6.
[32] Icaza-Alvarez, D., & Borge-Diez, D. (2025). Techno-Economic analysis and optimization of the hybrid system for a research Campus—Case Study Center for Research, Innovation, and Technology Transfer in Cuenca-Ecuador. Energies, 18(11), 2746.
[33] Bate, G. B., Adeleye, A. O., Ijanu, E. M., Olalere, E. O., Amoo, A. O., Asaju, C. I., Shiaka, P. G., & Yerima, M. B. (2023). Quality Assessment of Wastewater: Physicochemical and Bacteriological Evidence from Dutse Abattoir, North-West Nigeria. World Journal of Environmental Biosciences, 12(3), 58-66.
[34] Nikolić, I., Mijić, K., & Mitrović, I. (2025). Characteristics of food industry wastewaters and their potential application in biotechnological production. Processes, 13(8), 2401.
[35] Huang, Z., Wang, Q., Zhang, Y., Du, B., Zhou, J., & Ji, D. (2025). Effects of pyrolysis temperatures and modified methods on rice HuSk-Derived biochar characteristics and heavy metal adsorption. Molecules, 30(17), 3616.
[36] Juturu, R., Vinayagam, R., Murugesan, G., & Selvaraj, R. (2025a). Synthesis and characterization of Zn and Fe doped magnetic biochar from Acacia falcata leaves for Cr(VI) adsorption. Scientific Reports, 15(1), 22146.
[37] Oleszczuk, P., Ćwikła-Bundyra, W., Bogusz, A., Skwarek, E., & Ok, Y. S. (2016). Characterization of nanoparticles of biochars from different biomass. Journal of Analytical and Applied Pyrolysis, 121, 165-172.
[38] Zhang, F., Li, Z., Dou, X., Liu, Z., Xie, Y., Liu, J., & Zhang, S. (2025). Pore-Engineered Magnetic Biochar: optimizing pyrolysis and FE3O4 loading for targeted chlorinated aliphatic hydrocarbon (CAH) adsorption. Separations, 12(10), 260.
[39] Jiang, T., Morgan, H. M., Tsai, W., Chien, H., Yen, T., & Lee, Y. (2024). Thermochemical Conversion of Biomass into Biochar: Enhancing Adsorption Kinetics and Pore Properties for Environmental Sustainability. Sustainability, 16(15), 6623.
[40] Guel-Nájar, N. A., Rios-Hurtado, J. C., Muzquiz-Ramos, E. M., Dávila-Pulido, G. I., González-Ibarra, A. A., & Pat-Espadas, A. M. (2023). Magnetic biochar obtained by chemical coprecipitation and pyrolysis of corn COB residues: characterization and methylene blue adsorption. Materials, 16(8), 3127.
[41] Ahmed, N., Straub, A., & Ali, M. (2025). Fats, oil, and grease (FOG) in wastewater: sources, mechanisms, control, and removal strategies. International Journal of Environmental Science and Technology, 23(2).
[42] Liu, P., Boffa, L., & Cravotto, G. (2026). Biochar Derived from Agricultural Residues for Wastewater Contaminant Removal. Sustainability, 18(1), 435.
[43] Kurtulus, C., Aho, A., Murzin, D. Y., & Luukkonen, T. (2026). Adsorption of aqueous methylene blue, NH4+, Co(II) or As(III) with alkali-activated glass wool: isotherms, kinetics and thermodynamics. Ceramics International, 52(14), 23775-23789.
[44] Duwiejuah, A. B., Otoo, R. K. N., & Imoro, A. Z. (2025). Comparison of the adsorption performance of coconut husk and palm kernel shells biochars for the removal of toxic metals from mining wastewater. Waste Management Bulletin, 3(4), 100249.
[45] Azizzadeh, S. E., Bariki, S. G., & Movahedirad, S. (2025). Magnetic orange leaf biochar for favipiravir removal from wastewater. Scientific Reports, 15(1), 25388.
[46] Alhothali, A., Haneef, T., Mustafa, M. R. U., Moria, K. M., Rashid, U., Rasool, K., & Bamasag, O. O. (2021). Optimization of Micro-Pollutants’ Removal from Wastewater Using Agricultural Waste-Derived Sustainable Adsorbent. International Journal of Environmental Research and Public Health, 18(21), 11506.
[47] Shankar, V., Heo, J., Al-Hamadani, Y. A., Park, C. M., Chu, K. H., & Yoon, Y. (2017). Evaluation of biochar-ultrafiltration membrane processes for humic acid removal under various hydrodynamic, pH, ionic strength, and pressure conditions. Journal of Environmental Management, 197, 610-618.
[48] Zhang, D., Zhang, K., Chen, K., Xue, Y., Liang, J., & Cai, Y. (2022). Mitigation of organic fouling of ultrafiltration membrane by high-temperature crayfish shell biochar: Performance and mechanisms. The Science of the Total Environment, 820, 153183.
[49] Cámara, J. M., Diez, V., & Ramos, C. (2022). Neural network modelling and prediction of an Anaerobic Filter Membrane Bioreactor. Engineering Applications of Artificial Intelligence, 118, 105643.
[50] Isotuk, U. R., Uloma, A. C., & Paul, A. A. (2026). Production, Characterization and Performance Evaluation of Modified Crab Shell Chitosan for Sustainable Coagulation of Abattoir Wastewater. Chemical Science International Journal, 35(4), 171-195.
Cite This Article
  • APA Style

    Isotuk, U. R., Abel, U. A., Job, A. I., Uloma, A. C. (2026). Machine Learning-Based Prediction and Optimization of Membrane Fouling in a Hybrid Biochar-Membrane System Treating Real Cafeteria Wastewater. American Journal of Chemical Engineering, 14(4), 101-118. https://doi.org/10.11648/j.ajche.20261404.13

    Copy | Download

    ACS Style

    Isotuk, U. R.; Abel, U. A.; Job, A. I.; Uloma, A. C. Machine Learning-Based Prediction and Optimization of Membrane Fouling in a Hybrid Biochar-Membrane System Treating Real Cafeteria Wastewater. Am. J. Chem. Eng. 2026, 14(4), 101-118. doi: 10.11648/j.ajche.20261404.13

    Copy | Download

    AMA Style

    Isotuk UR, Abel UA, Job AI, Uloma AC. Machine Learning-Based Prediction and Optimization of Membrane Fouling in a Hybrid Biochar-Membrane System Treating Real Cafeteria Wastewater. Am J Chem Eng. 2026;14(4):101-118. doi: 10.11648/j.ajche.20261404.13

    Copy | Download

  • @article{10.11648/j.ajche.20261404.13,
      author = {Uzono Romokere Isotuk and Ukpong Anwana Abel and Akwayo Iniobong Job and Anaba Catherine Uloma},
      title = {Machine Learning-Based Prediction and Optimization of Membrane Fouling in a Hybrid Biochar-Membrane System Treating Real Cafeteria Wastewater},
      journal = {American Journal of Chemical Engineering},
      volume = {14},
      number = {4},
      pages = {101-118},
      doi = {10.11648/j.ajche.20261404.13},
      url = {https://doi.org/10.11648/j.ajche.20261404.13},
      eprint = {https://article.sciencepublishinggroup.com/pdf/10.11648.j.ajche.20261404.13},
      abstract = {The main characteristics of cafeteria effluents are the high organic load, varying concentration of fat/oil/grease content and nutrients, thus making them more difficult to treat than traditional domestic sewage. In this study, a combination of biochar-membrane technology was designed to treat real cafeteria wastewater from Akwa Ibom State University in Nigeria and ML for fouling prediction and process optimization. Biochar was prepared by pyrolysis and modified using iron oxide to increase the surface area (185.4 to 312.7 m2g-1) and functional groups, as indicated by FTIR spectroscopy (Fe-O at 580 cm-1), scanning electron microscopy and BET analysis (SEM). Adsorption of the main pollutant (COD) in batch mode followed Langmuir model (qm = 94.3 mg g-1, R2 = 0.986) and first-order kinetics (R2 = 0.978). Removal of COD, oil and grease, phosphate and turbidity were mainly dependent on biochar dosage and contact time. Two-stage Plackett-Burman/Box-Behnken design (45 runs) was used to produce the data set on which four ML models were developed; XGBoost and artificial neural networks exhibited the best results in terms of predictive performance (R2 = 0.91-0.96) for six response variables, surpassing random forest and support vector regression. Combination of the top-performing model with genetic algorithm, particle swarm and Bayesian optimization was used to find the optimal process parameters (14 g L-1 dose, 105 minutes, TMP 1.05 bar), leading to 89-90% COD removal with minimized membrane fouling, confirmed experimentally within ±5% from the predictions. Biochar pretreatment decreased the fouling resistance as compared to membrane-only process, while preliminary techno-economic evaluation suggested the process cost of about $0.258 m-3.},
     year = {2026}
    }
    

    Copy | Download

  • TY  - JOUR
    T1  - Machine Learning-Based Prediction and Optimization of Membrane Fouling in a Hybrid Biochar-Membrane System Treating Real Cafeteria Wastewater
    AU  - Uzono Romokere Isotuk
    AU  - Ukpong Anwana Abel
    AU  - Akwayo Iniobong Job
    AU  - Anaba Catherine Uloma
    Y1  - 2026/08/10
    PY  - 2026
    N1  - https://doi.org/10.11648/j.ajche.20261404.13
    DO  - 10.11648/j.ajche.20261404.13
    T2  - American Journal of Chemical Engineering
    JF  - American Journal of Chemical Engineering
    JO  - American Journal of Chemical Engineering
    SP  - 101
    EP  - 118
    PB  - Science Publishing Group
    SN  - 2330-8613
    UR  - https://doi.org/10.11648/j.ajche.20261404.13
    AB  - The main characteristics of cafeteria effluents are the high organic load, varying concentration of fat/oil/grease content and nutrients, thus making them more difficult to treat than traditional domestic sewage. In this study, a combination of biochar-membrane technology was designed to treat real cafeteria wastewater from Akwa Ibom State University in Nigeria and ML for fouling prediction and process optimization. Biochar was prepared by pyrolysis and modified using iron oxide to increase the surface area (185.4 to 312.7 m2g-1) and functional groups, as indicated by FTIR spectroscopy (Fe-O at 580 cm-1), scanning electron microscopy and BET analysis (SEM). Adsorption of the main pollutant (COD) in batch mode followed Langmuir model (qm = 94.3 mg g-1, R2 = 0.986) and first-order kinetics (R2 = 0.978). Removal of COD, oil and grease, phosphate and turbidity were mainly dependent on biochar dosage and contact time. Two-stage Plackett-Burman/Box-Behnken design (45 runs) was used to produce the data set on which four ML models were developed; XGBoost and artificial neural networks exhibited the best results in terms of predictive performance (R2 = 0.91-0.96) for six response variables, surpassing random forest and support vector regression. Combination of the top-performing model with genetic algorithm, particle swarm and Bayesian optimization was used to find the optimal process parameters (14 g L-1 dose, 105 minutes, TMP 1.05 bar), leading to 89-90% COD removal with minimized membrane fouling, confirmed experimentally within ±5% from the predictions. Biochar pretreatment decreased the fouling resistance as compared to membrane-only process, while preliminary techno-economic evaluation suggested the process cost of about $0.258 m-3.
    VL  - 14
    IS  - 4
    ER  - 

    Copy | Download

Author Information
  • Abstract
  • Keywords
  • Document Sections

    1. 1. Introduction
    2. 2. Materials and Methods
    3. 3. Results and Discussion
    4. 4. Conclusions
    Show Full Outline
  • Abbreviations
  • Author Contributions
  • Conflicts of Interest
  • References
  • Cite This Article
  • Author Information