Research Article | | Peer-Reviewed

Quantification of Soil Erosion Using Remote Sensing and GIS: The Case of the Anguededou Watershed

Received: 16 February 2026     Accepted: 28 February 2026     Published: 12 March 2026
Views:       Downloads:
Abstract

The Anguededou watershed belongs to the Anguededou river hydrographic system. It is located in the Abidjan district in southern Côte d’Ivoire. The present study aims to quantify water erosion of soils in the Anguededou watershed using remote sensing and GIS. The USLE (Universal Soil Loss Equation) model was chosen to quantify and spatialize water erosion processes at the watershed scale. This model, already implemented in different environments and at different scales, takes into account five determining factors in erosion processes, including: the aggressiveness of rainfall, the erodibility of soils, the inclination and length of the slope, as well as the vegetation cover and the means put in place to combat soil erosion. This study is part of a sustainable management approach for peri-urban watersheds. The result from the combination of the different factors indicates a soil loss on the Anguededou watershed which varies from 0 to 250 t/ha/year with an average of 41.27t/ha/year. The results obtained allow the identification of areas at the basin scale where interventions are needed to limit soil degradation processes. Soil loss from upstream to downstream of the catchment area could contribute in the long term to pollution and silting of the lagoon, thus causing a drastic reduction in the water surface area.

Published in American Journal of Environmental Protection (Volume 15, Issue 2)
DOI 10.11648/j.ajep.20261502.11
Page(s) 51-59
Creative Commons

This is an Open Access article, distributed under the terms of the Creative Commons Attribution 4.0 International License (http://creativecommons.org/licenses/by/4.0/), which permits unrestricted use, distribution and reproduction in any medium or format, provided the original work is properly cited.

Copyright

Copyright © The Author(s), 2026. Published by Science Publishing Group

Keywords

Erosion, Remote Sensing, GIS, USLE, Anguededou, Côte d’Ivoire

1. Introduction
Soil is a fundamental natural resource, providing the biophysical support for the functioning of terrestrial ecosystems . It makes a decisive contribution to the provision of a wide range of ecosystem services that are essential to human societies, including food production, water cycle regulation, carbon storage, nutrient recycling and biodiversity conservation . Thus, soil represents a strategic lever for the sustainability of socio-ecological systems and resilience to global change (Wu et al., 2011). Soil erosion is one of the most worrying phenomena for watershed management. This phenomenon is linked to natural and human-induced factors that are difficult to control over time and space . Demographic pressure, the expansion of various human activities and urbanisation, combined with the amplifying effects of climate change, have led to land exposure to runoff and soil degradation through water erosion . Changes linked to the development of societies and human activities cause soil denudation, which in turn accelerates erosion processes .
In Ivory Coast, the excessive exploitation of forest resources for agricultural and urbanization purposes is the cause of significant soil loss . In the Anguédédou watershed, located on the northwestern outskirts of the city of Abidjan, this problem takes on a particular dimension due to increasing demographic pressure, the anarchic expansion of urban areas, and the progressive disappearance of protective vegetation cover . These environmental changes accentuate rainwater runoff, thus promoting the triggering of more intense and frequent erosion processes.
Quantifying soil erosion in this watershed is therefore a major issue for urban planning, natural resource conservation, and sustainable environmental management. It not only identifies the most vulnerable areas, but also suggests appropriate anti-erosion measures. In this context, the use of spatial modelling tools, such as the Universal Soil Loss Equation (USLE) model coupled with Geographic Information Systems (GIS), offers an effective approach to estimating soil loss and guide land use planning decisions. This empirical soil erosion model has been revised (Revised Universal Soil Equation, RUSLE) .
The present study aims to quantify water erosion in the Anguededou watershed, highlighting the determining factors of this dynamic and identifying areas at risk. It is part of an integrated soil resource management approach in a context of high anthropogenic pressure.
2. Materials and Methodology
Geographically, the Anguededou watershed is located in the district of Abidjan in southern Ivory Coast between longitudes 4°4’30’’ and 4°9’30’’ West and latitudes 5°18’0’’ and 5°27’30’’ North (Figure 1). It covers an area of 87 km² with a perimeter of 65 km. The climate is classified as a transitional equatorial regime. Average annual rainfall was around 1500 mm in 2500 mm in 2017 . The population surrounding the basin increased from 4 707 404 inhabitants in 2014 to 6 321 017 inhabitants in 2021 .
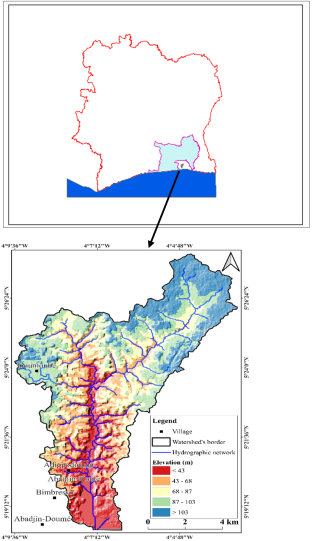
Figure 1. Location of the Anguededou watershed in the Abidjan district.
Several methods are generally used to assess soil erosion, with varying degrees of complexity. The empirical model developed by was used to estimate the soil loss rate (USLE) in the watershed. This is best-known and most widely used mathematical model for estimating water erosion. According to this model, erosion is a multiplicative function of the five factors that control water erosion: climate aggressiveness, soil erodibility, slope inclination and length, land use and anti-erosion practices. This equation, which is well suited to GIS , has been used by several researchers around the world to assess erosion . The RUSLE formula is as follows:
A= R.K.LS.C. P
Where:
A: expressing the average annual soil losses possible in the long term (t.ha. year).
R: expressing the rainfall erosivity index (MJ. mm/ha.h.an). In the absence of data on rainfall intensity, the formula developed by . based on monthly and annual precipitation is used to calculate this factor. It is expressed as follows:
R=n=112p2p
With:
P: Monthly rainfall (mm) and P: Annual rainfall (mm). Based on the erosion values obtained, an erosion map is produced using kriging with rainfall data from six (06) stations (Abidjan-Cocody, Adiopudoume-ORSTOM, Azaguie-IRFA, Nieky's banana plantation, Banco and Kossi-Houan) over the period 1994-2024, i.e. 30 years.
K: expressing the soil erodibility index (t.ha.h/ha.MJ.mm). It depends on the texture, organic matter content, and permeability of the soil .). The K factor was calculated using a series of equations that mimic and translate the nomogram developed by .), instead of the classic equation, which has limitations and is responsible for more than 50% of prediction errors . It is presented as follows:
K = 2,77 ×10⁻⁵ × ((fli+ fsf) (100− farg)) 1,14 × (12– fMO) ⁄ 10 + (0,043 × (S − 2) × 0,033 × (P − 3))
With K expressed in [(t.ha.h) /(h.MJ.mm)] in the International System of Units (SI). fli + fsf: Fraction of silt and fine sand; farg: Fraction of clay; fMO: Fraction of organic matter; S: Soil structure; P: Soil permeability
Once the resistance of each soil type has been calculated, a new field containing the calculated values is added to the vector file containing the polygons corresponding to the different soil types, which allows this factor to be spatialised and a soil erodibility map to be obtained.
LS: expressing the slope factor (dimension less). There are many different equations available for calculating the LS factor. presented that slope length and slope inclination can be used in a single index, which expresses the ratio between soil loss as defined by . As shown below:
LS=(X/22,13)m(0,065+0,045S+0,0065S²)
Where:
X: slope length (m);
S: slope gradient (%)
The values of X and Y can be obtained from the digital elevation model (DEM). To calculate the value of X, the flow accumulation was derived from the DEM after conducting flow direction and filling processes in ArcGIS.
X = (flowaccumulation * resolution)
Substituting the value of X, the LS equation will be:
LS = (runoff accumulation * resolution/22.13) m (0.065 + 0.045S + 0.065S2)
(m= Constant equal to 0.5 for S >5%; 0.4 for 3.5< S <5%; 0.3 for 1 <S < 3.5%, and 0.2 for S > 1%).
C: expressing the vegetation factor (dimension less). It allows the soil's capacity to mitigate the effect of raindrops to be estimated . This factor was determined based on the land use map. Table 1 shows the type of vegetation cover existing in the study area and the assigned C value.
Table 1. Land use coefficient C according to land use type.

Land use type

Factor C

Bare ground

1

Scrubland or mosaic of crops

0,5

Built-up area

0,2

Reforested area

0,18

Dense forest

0,001

Water body

0

P: expressing the support practice factor (dimension less). The P factor describes human actions to conserve soil that are pratised to counter water erosion . It generally varies from 0 to 1, depending on the practice adopted and the slope. However, given that no anti-erosion practices have been adopted throughout the study area, this factor has been considered a unit value equal to 1.
The organizational chart below (Figure 2) presents the methodology adopted to estimate and map potential erosion. It aims to develop a soil loss map for the Anguededou catchmed area. This map takes into account most of the factors included in the Wischmeier and Smith equation (1978), which are themselves expressed in the form of thematic maps. By cross-referencing these digital maps using GIS, we were able to estimate the rate of soil loss at the watershed scale.
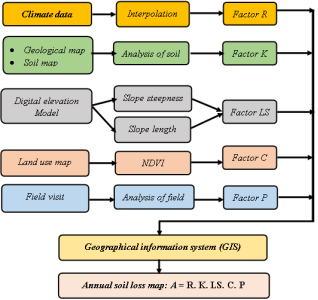
Figure 2. Methodology used to produce the water erosion map for the Anguededou catchment area.
3. Results and Discussion
3.1. Results
3.1.1. R. Factor
The rainfall erosivity map was estimated based on rainfall levels at two rain gauge stations over a 30-year period (1994-2024). In the watershed, the R factor ranges from 389 in the south-east to 452 in the north, with a value of 422.46 in the centre (Figure 3 and Table 2). High rainfall aggressiveness values are observed in the North of the catchment area. The impact of rainfall intensity is manifested in the processes of sediment detachment and transport. Given the very low variability but high values, it can be concluded that the R factor could only cause slight variability in erosion; however, it could accentuate linear erosion and therefore high values of solid transport.
Table 2. Rainfall erosion statistics.

Soil erodibility statistics

Min

389

Max

452

Average

422,46

Standard deviation

17,39

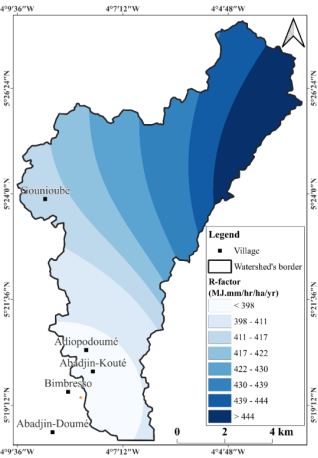
Figure 3. Map of the R climate factor the Anguededou watershed.
3.1.2. K. Factor
Lithology influences the erosion process in terms of the substrate and surface formations. To understand the degree of resistance of lithological substrates to erosion, a classification is made based on the degree of erodibility of the rocks. This varies from a minimum value of 0.013 for soft rocks to a maximum value of 0.019 for resistant substrates (Figure 4 and Table 3). Approximately 95% of the catchment area is characterized by a K factor of less than 0.010, and 5% by a K factor of more than 0.010. This shows the fragility of the soils and their susceptibility to erosion.
Table 3. Soil erodibility factor statistics.

Soil erodibility statistics

Min

0.013

Max

0.019

Average

0,016

Standard deviation

0,004

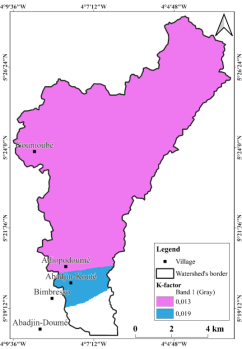
Figure 4. Map of the factor (K) for the Anguededou watershed.
3.1.3. Topographical Factor (Ls)
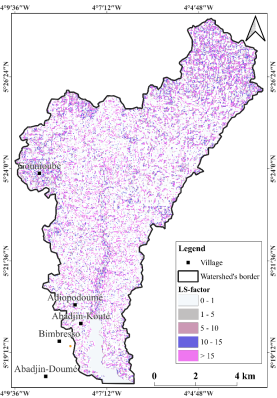
Figure 5. Map of the LS factor in the Anguededou catchment area.
The LS factor is synthesized from slope and basin length maps (Figure 5). Slope is the main constraint on soils in the basin. This factor is represented by the degree of inclination of the terrain, as it is the slope that gives runoff the energy it needs to strip away soil and transport sediment. High LS values can promote all types of erosion, mainly gully erosion and rill erosion. The class corresponding to the highest LS values (5-10) covers a large part of the basin and is located on the steepest slopes, particularly in the northern part of the basin.
3.1.4. Map of the C Factor and Erosion Control P
Vegetation cover protects the soil and cushions raindrops, slowing runoff and infiltration. The map showing the distribution of factor C in the basin (Figure 6) shows the sensitivity of different types of land use to erosion processes. Across the entire catchment area, factor C varies between 0 and 1. Vegetated areas, such as dense forest, palm and rubber tree plantations, are characterized by very low factor (0.10), while the highest factors (1) correspond to bare soil, habitats and rocky areas. Anthropogenic activities such as deforestation and agricultural activities are factors that make soils vulnerable to erosion. The P factor represents soil protection and anti-erosion practices that reduce runoff velocity and thus decrease the risk of water erosion. It varies according to the developments carried out. In the case of the Anguededou watershed, the values of this factor generally vary between 0.5 in developed and protected areas and 1 where soil and slope protection and development are almost non-existent.
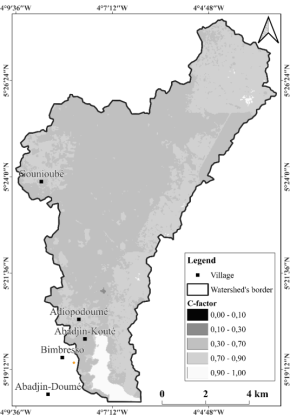
Figure 6. Map of factor C for the Anguededou watershed.
3.1.5. Assessment of Soil Loss
The soil loss map shows that soil loss in the basin varies from 0 to 250 t/ha/year, with an average of 41.27 t/ha year (Figure 7). The erosion rate calculated using the USLE Wischmeier et Smith (1978) model provides information on the distribution of erosion risk. It varies from one area of the catchment to another depending on the influence of various explanatory factors that control erosion, such as slope, climate aggressiveness, type and rate of vegetation cover, and anthropogenic action. Analysis of the annual soil loss result shows that areas at high risk of erosion are located on hills and slopes characterized by steep gradients and favourable substrates. The resulting map is subdivided into five soil loss classes: 0-1 t/ha/year, 1-10 t/ha/year, 10-50 t/ha/year, 50-100 t/ha/year and > 100 t/ha/year. The threshold considered in this study is 7 t/ha/year, a value used in other erosion studies .
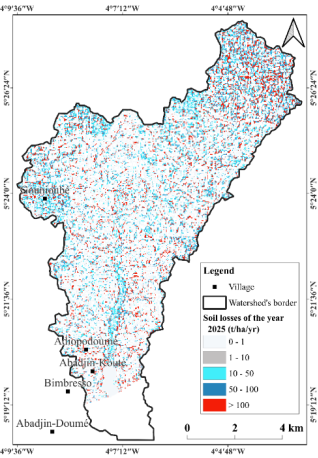
Figure 7. Soil loss map of the Anguededou watershed.
From Table 4, we can see that soil loss classes between 0-1 t/ha/year represent an area of 6.02 km. The 1-10 t/ha/year class represents 15.5 km. 25.2 km for the 10-50 t/ha/year class, and 16.78 km for the 50-100 t/ha/year class. And finally, 23.5 km for the area of soil loss greater than 100 t/ha/year. Based on a comparative analysis of the maps of the factors in the soil loss equation, we observe that the spatial distribution of the high erosion classes corresponds to that of the steep slope classes with a high density of waterways. This shows that erosion is significant in the rugged parts of the catchment area that have very steep slopes. It is accentuated by watercourses. Areas subject to severe erosion generally correspond to rugged terrain with little or no vegetation cover. In general, these are the areas most at risk from erosion.
Table 4. Area of soil loss classes in t/ha/year.

Soil loss class A (t/ha/year)

Area (km²)

Degrees of erosion

0-1

6.02

Low

1-10

15.2

Moderately low

10-50

25.2

Medium

50-100

16.78

High

>100

23.5

Very high

Total

87

3.2. Discussion
The model presented in this study combines the elements of the USLE equation (R, K, LS, C, P). However, integrating the model into a GIS offered many advantages, particularly those related to the factors involved in erosion. This integration made it possible to rationally manage a multitude of qualitative and quantitative data relating to the various factors of soil degradation. According to the summary map, the rate of soil loss varies from one area to another depending on the impact of the factors determining erosion. The impact of the rainfall aggressiveness factor (R) is manifested in the processes of sediment detachment and transport. Given the variable but high values, it can be concluded that the R factor could cause significant variability in erosion. The soils of the Anguededou watershed consist largely of ferralitic and ferruginous soils. According to , ferralitic soils are generally permeable and fairly resistant when K varies from 0.015 to 0.20. The K factor for the watershed varies between 0.013 and 0.019 MJ.mm/ha.h.year. This indicates that the soils in the watershed studied are permeable and therefore less resistant to erosion. Thus, , noted that soil erodibility is not homogeneous across space and changes over time: it increases during the rainy season and varies according to soil characteristics, age of clearing and cultivation techniques. The calculated LS factor shows that the erosive power is relatively strong. Indeed, the average LS value is 11.72. The erosion rate between 0t/ha/year and 250 t/ha/year, spread across the entire study area, with an average of 41.27 t/ha/year. This average value is higher than 7.41 t/ha/year, because according to the classification accepted by RUSLE, soils can tolerate losses of up to 7.41 t/ha/year while still allowing a high of agricultural production . The average value of soil loss is 41.27 t/ha/year in the basin, which is consided very high. These high values of soil loss may be due to the topographical factor, which includes the length of slopes along the hydrographic network . Overall, the increased risk of erosion in the watershed could be explained by rapid urbanisation and overgrazing leading to the destruction of existing vegetation. In addition, this degradation exposes the watershed to very high runoff and very low infiltration . Soil displaced by erosion carried nutrients, pesticides and other chemicals . Most of these harmful products can be carried by the Anguededou river to lagoon. The deposition of soil losses and substances in the lagoon could contribute to its pollution and siltation in the long term, causing a drastic reduction in surface water .
4. Conclusions
Soil sensitivity to erosion depends on soil type, season and farming techniques. The study conducted in the Anguededou watershed highlights the combined impact of natural factors and human activities on erosion dynamics. The summary map shows the high amount of soil loss. The empirical soil loss estimation model (USLE) developed by Wischmeier & Smith (1978) was used to map the areas affected by sheet erosion. The study showed that the average soil loss in the basin is estimated at 41.27 t/ha/year, which is higher than 7t/ha/year (the tolerance threshold). Topography and hydrographic network are the main factors explaining these values, especially as they are limiting factors in the Wischmeier model. The high values could also be explained by rapid urbanization and overgrazing, leading to the destruction of existing vegetation.
It is important to note that the USLE model enables decision-makers to consider intervention strategies within the framework of sustainable development. Efforts should focus on restoring slopes and introducing soil-protective agricultural techniques. Finally, the implementation of the USLE model requires monitoring over several years. Station studies must be designed to compare estimated loss values with values measured in the field.
Abbreviations

GIS

Geographic Information Systems

RGPH

General Population and Housing Census

USLE

Universal Soil Loss Equation

RUSLE

Revised Universal Soil Loss Equation

Acknowledgments
The authors thank the Laboratory of Soil, Water, and Geomaterials Sciences at Felix Houphouet-Boigny University, the Marine Sciences Training and Research Unit at the Polytechnic University of San Pedro, and the Laboratory of Water and Environmental Sciences and Techniques at Nangui Abrogoua University. The authors also express their gratitude to all individuals and institutions who contributed to the completion and improvement of this work.
Author Contributions
Anzoumanan Kamagate: Conceptualization, Data curation, Formal Analysis, Funding acquisition, Investigation, Methodology, Project administration, Resources, Software, Supervision, Validation, Visualization, Writing – original draft, Writing– review & editing
Seydou Diallo: Formal Analysis, Methodology, Resources,
Software, Validation, Visualization
Kouadio Euclide N’Goran: Formal Analysis, Investigation, Methodology, Software, Visualization
Conflicts of Interest
The authors declare no conflicts of interest.
References
[1] Lal R. Soil carbon sequestration impacts on global climate change and food security, Science. 2004, 304, 1623-1627
[2] Bardgett R., van der Putten W. Belowground biodiversity and ecosystem functioning, Nature. 2014, 515, 505–511.
[3] Orr J. A., Piggott J. J., Jackson A. L. & al. Variability of functional and biodiversity responses to perturbations is predictable and informative, Nat Commun 15, 10352 (2024).
[4] Maestre F. T., Biancari L., Chen N. & al. Research needs on the biodiversity–ecosystem functioning relationship in drylands. npj biodivers 3, 12 (2024).
[5] Eisenhauer N., Sünnemann M., Pollierer M. M. et al. Soil biodiversity effects on ecosystems. Nat. Rev. Biodivers, 2026, 76–91.
[6] Morgan R. P.C. Soil Erosion and Conservation (3rd ed.), Blackwell Publishing, 2005, 56(5), 681-687.
[7] Boudhar A., Duchemin B. L., Chaponniere A., Maisongrande P., & al. Analysis of snow cover dynamics in Morocco's High Atlas Mountains based on spot-vegetation data. Science and Global Change / Drought, 2007, 18(4), pp. 278-288.
[8] Pimentel D., & Burgess M. Soil Erosion Threatens Food Production. Agriculture, (2013), 3(3), 443-463.
[9] Borrelli P., Robinson, D. A., Fleischer, L. R. et al. An assessment of the global impact of 21st century land use change on soil erosion. Nat Commun 8, (2017).
[10] Payet E. Study of soil degradation dynamics in coastal watersheds of the Indian Ocean, Specialization in Geography, University of Reunion, Doctoral School of Humanities and Social Sciences, 2015, 316 p.
[11] N’go Y. A., Kouadio Z. A., Deguy A. J-P., Hien S. A., Goula B. T. A. et Savané I. Influence of land use dynamics on the amount of soil loss in the southern Sassandra watershed (Côte d'Ivoire), International Journal of Advanced Research, 2018 6(4), 830-838.
[12] Dao A., Koffi E. S., Noufé D. D., Kamagaté B., Goné L. D., Séguis L., and Perrin J. L. Soil loss vulnerability: the case study of Aghien lagoon watershed outskirts Abidjan city (Côte d'Ivoire), Proc. IAHS, 2021, 384, 121-126.
[13] Coulibaly M., Soro G. E., & Kouadio K. E. Impact of urbanisation on soil dynamics in the outskirts of Abidjan: the case of the Anguededou watershed, Revue de Géographie Tropicale, 2020, 14(2), 45–60.
[14] Renard K. G., Foster G. R., Weesies G. A., McCool D. K. and Yoder D. C. Predicting Soil Erosion by Water: A Guide to Conservation Planning with the Revised Universal Soil Loss Equation (RUSLE), Agriculture Handbook US Department of Agriculture, Washington DC., 1997, 703, 1-251.
[15] Prasannakumar V., Shiny R., Geetha N., & Vijith H. Spatial prediction of soil erosion risk by remote sensing, GIS and RUSLE approach: A case study of Siru vani River watershed in Attapady Valley, Kerala, India, Environmental Earth Sciences, 2011, 64(4), 965-972.
[16] Koffi E.S, Dao A., Noufé D. D., Diallo S., Kamagaté B., Effebi R. K., Goné D. L., Paturel J. E., Perrin J.L et Seguis L., Tra Bi. Z.A. Impact of water erosion in the sub-catchments of the Aghien lagoon (Bete and Djibi) located on the periphery of Abidjan. Environmental and Water Sciences, public Health and Territorial Intelligence Journal, 2023, 7(1), 916-930.
[17] RGPH: General Population and Housing Census, Publishing, Agence Nationale de la Statistique 2021, 12 p.
[18] Wischmeier W. H., Smith D. D. Prediction rainfall erosion losses, a guide to conservation planning Science, U. S. Dept. Agriculture. Agric. Handbook., 1978, (537), 1- 60.
[19] Khemiri K., & Jebari S. Assessment of water erosion in watersheds in Tunisia's semi-arid zone using the RUSLE and MUSLE models coupled with a Geographic Information System, Cah. Agric. 2021, 30(7), 1-11.
[20] Driss E.H & Brahim A. Quantification of water erosion using the Rusle model and integrated deposition in a GIS. Case study of the Oued Isly watershed (Eastern Morocco), European scientific Journal, ESJ. 2018, 14(5), 373.
[21] Kassou A., Essahlaoui N., Azzi Y., & Essahlaoui A. Quantification of Water Erosion at the Watershed Level Upstream of the Hassan II Dam, Upper Moulouya, Morocco, using the Universal Soil Loss Equation, European Scientific Journal (ESJ). 2022, 9(1), 1-21.
[22] Haouach A., & Chadli K. Assessment of water erosion using GIS at the OUED LBÈNE watershed upstream of the Sidi Abbou dam, central prerif, MOROCCO, Spaces, journal of Geography, 2024, 11, 72-78.
[23] Rango A. & Arnoldus H. M. J. Watershed management. In: FAO Technical Papers, 1987, pp. 1–11.
[24] Roose E. & Sarrailh J. M. Erodibility of Some Tropical Soils. Twenty Years of Measurements in Erosion Plots under Natural Rainfall. In: Special Issue on Erosion. ORSTOM Pedology Series, 1987, vol. 25, pp. 7–30.
[25] Auerswald, K., Fiener, P., Martin, W. and Elhaus, D. Use and Misuse of the K Factor Equation in Soil Erosion Modeling: An Alternative Equation for Determining USLE Nomograph Soil Erodibility Values. Elsevier BV Catena, 2014, Vol.118 pp. 220-225.
[26] Bizuwerk A., Taddese, G. & Getahun, Y. (2008) Application of GIS for Modeling Soil Loss Rate in Awash Basin, Ethiopia. International Livestock Research Institute, Addis Ababa, Ethiopia.pp 1-11.
[27] Molla T. and Swishier B. Estimating Soil Erosion Risk and Evaluating Erosion Control Measures. Copernicus Publications, the European Geosciences Union, Solid Earth, 2017, pp 14-25,
[28] Sadiki A., Bouhlassa S., Auajjar J., Faleh A. & Macaire J. J. Use of a GIS for assessing and mapping erosion risks using the Universal Soil Loss Equation in the Eastern Rif (Morocco): the case of the Boussouab river basin. Bulletin of the Scientific Institute, Rabat, Earth Sciences section, 2004, no. 26, pp. 69–79.
[29] Roose E. J., Lelong F. Factors of the chemical composition of seepage and groundwaters in the intertropical zone (West Africa), Journal of Hydrology. 1981, 54, 1-22.
[30] Quantin P., & Combeau A. Soil erosion and structural stability, AIHS. 1962, 59, 124-130.
[31] El garouani A., Chen H., Lewis L. The impacts of land use/land cover changes and climate regime on the spatial patterns of erosion and deposition by remote sensing and GIS: Case of Tlata river catchment (Morocco). 2nd International Conference of GIS/RS in Hydrology, Water Resources and Environment, 2007, 7-13.
[32] Payet, E., Dumas, P. & Pennober, G. Modelling of soil water erosion in a watershed in south-western Madagascar, the Fiherenana. Vertigo. 2012, 11(3), pp 26.
[33] El hafid D. and Akdim B. Quantification of water erosion using the Rusle model and integrated deposition in a GIS. Case study of the Isly River Basin (Eastern Morocco), European Scientific Journal, ESJ. 2018, 14(5), 373.
[34] Benkaci S., Abir D., Oumellal A., Remini B. Modelling erosion in the upper and middle Cheliff basin using the Model builder application on ArcGIS, Journal of Materials and Engineering Structures. 2018, 5(1), 81-93.
[35] Meliho M., Khattabi A., Mhammdi N., and Zhang H. Mapping water erosion risks using the revised universal soil loss equation, remote sensing and GIS in the Ourika watershed (High Atlas, Morocco), Eur. Scient. J. 2016, 12(32), 277-297.
[36] Zouagui A., Sabir M., Naimi M., and Benmansour M. Modelling the risk of water erosion using the universal soil loss equation in the western Rif: the case of the Moulay Bouchta watershed (Morocco), Eur. Scient. J. 2018, 14(3), 524-544.
Cite This Article
  • APA Style

    Kamagate, A., Diallo, S., N’Goran, K. E. (2026). Quantification of Soil Erosion Using Remote Sensing and GIS: The Case of the Anguededou Watershed. American Journal of Environmental Protection, 15(2), 51-59. https://doi.org/10.11648/j.ajep.20261502.11

    Copy | Download

    ACS Style

    Kamagate, A.; Diallo, S.; N’Goran, K. E. Quantification of Soil Erosion Using Remote Sensing and GIS: The Case of the Anguededou Watershed. Am. J. Environ. Prot. 2026, 15(2), 51-59. doi: 10.11648/j.ajep.20261502.11

    Copy | Download

    AMA Style

    Kamagate A, Diallo S, N’Goran KE. Quantification of Soil Erosion Using Remote Sensing and GIS: The Case of the Anguededou Watershed. Am J Environ Prot. 2026;15(2):51-59. doi: 10.11648/j.ajep.20261502.11

    Copy | Download

  • @article{10.11648/j.ajep.20261502.11,
      author = {Anzoumanan Kamagate and Seydou Diallo and Kouadio Euclide N’Goran},
      title = {Quantification of Soil Erosion Using Remote Sensing and GIS: The Case of the Anguededou Watershed},
      journal = {American Journal of Environmental Protection},
      volume = {15},
      number = {2},
      pages = {51-59},
      doi = {10.11648/j.ajep.20261502.11},
      url = {https://doi.org/10.11648/j.ajep.20261502.11},
      eprint = {https://article.sciencepublishinggroup.com/pdf/10.11648.j.ajep.20261502.11},
      abstract = {The Anguededou watershed belongs to the Anguededou river hydrographic system. It is located in the Abidjan district in southern Côte d’Ivoire. The present study aims to quantify water erosion of soils in the Anguededou watershed using remote sensing and GIS. The USLE (Universal Soil Loss Equation) model was chosen to quantify and spatialize water erosion processes at the watershed scale. This model, already implemented in different environments and at different scales, takes into account five determining factors in erosion processes, including: the aggressiveness of rainfall, the erodibility of soils, the inclination and length of the slope, as well as the vegetation cover and the means put in place to combat soil erosion. This study is part of a sustainable management approach for peri-urban watersheds. The result from the combination of the different factors indicates a soil loss on the Anguededou watershed which varies from 0 to 250 t/ha/year with an average of 41.27t/ha/year. The results obtained allow the identification of areas at the basin scale where interventions are needed to limit soil degradation processes. Soil loss from upstream to downstream of the catchment area could contribute in the long term to pollution and silting of the lagoon, thus causing a drastic reduction in the water surface area.},
     year = {2026}
    }
    

    Copy | Download

  • TY  - JOUR
    T1  - Quantification of Soil Erosion Using Remote Sensing and GIS: The Case of the Anguededou Watershed
    AU  - Anzoumanan Kamagate
    AU  - Seydou Diallo
    AU  - Kouadio Euclide N’Goran
    Y1  - 2026/03/12
    PY  - 2026
    N1  - https://doi.org/10.11648/j.ajep.20261502.11
    DO  - 10.11648/j.ajep.20261502.11
    T2  - American Journal of Environmental Protection
    JF  - American Journal of Environmental Protection
    JO  - American Journal of Environmental Protection
    SP  - 51
    EP  - 59
    PB  - Science Publishing Group
    SN  - 2328-5699
    UR  - https://doi.org/10.11648/j.ajep.20261502.11
    AB  - The Anguededou watershed belongs to the Anguededou river hydrographic system. It is located in the Abidjan district in southern Côte d’Ivoire. The present study aims to quantify water erosion of soils in the Anguededou watershed using remote sensing and GIS. The USLE (Universal Soil Loss Equation) model was chosen to quantify and spatialize water erosion processes at the watershed scale. This model, already implemented in different environments and at different scales, takes into account five determining factors in erosion processes, including: the aggressiveness of rainfall, the erodibility of soils, the inclination and length of the slope, as well as the vegetation cover and the means put in place to combat soil erosion. This study is part of a sustainable management approach for peri-urban watersheds. The result from the combination of the different factors indicates a soil loss on the Anguededou watershed which varies from 0 to 250 t/ha/year with an average of 41.27t/ha/year. The results obtained allow the identification of areas at the basin scale where interventions are needed to limit soil degradation processes. Soil loss from upstream to downstream of the catchment area could contribute in the long term to pollution and silting of the lagoon, thus causing a drastic reduction in the water surface area.
    VL  - 15
    IS  - 2
    ER  - 

    Copy | Download

Author Information
  • Department of Coastal Sciences, University of San-Pedro, San Pedro, Côte d’Ivoire

    Biography: Anzoumanan Kamagate is a doctor. I obtained my PhD in hydrology, specializing in water resources and the environment. I am a senior lecturer at the University of San Pedro in Côte d'Ivoire. I work on issues related to water resource management and land use modelling. My work also focuses on climate change and coastal erosion issues.

    Research Fields: hydrology, hydrogeology, climate change, erosion, water resources.

  • Department of Geosciences and Environment, Nangui Abrogoua University, Abidjan, Côte d’Ivoire

    Biography: Seydou Diallo is a doctor of hydrology-GIS, an expert in hydrology/hydrogeology and the environment.

    Research Fields: hydrology, geographic information system, water resources.

  • Department of Geosciences and Environment, Nangui Abrogoua University, Abidjan, Côte d’Ivoire

    Biography: Kouadio Euclide N’Goran. I am a doctoral student in environmental science and management at NANGUI ABROGOUA University in Côte d'Ivoire, specializing in hydrogeomatics.

    Research Fields: hydrogeomatics, remote sensing, water resources.