This study has been conducted to assess the current state of noise pollution across various regions of Khulna City. 6 distinct zones and 39 locations were identified in Khulna City according to land use criteria. A sound level meter (REED SD-4023) was utilized to monitor noise levels in Khulna City from January 1, 2021, to April 30, 2021. At each sampling site, multiple samples were collected. The noise level at all locations had been measured three times per day. The mean noise level and Leq in Khulna City were found to be 72.82 dBA and 94.99 dBA, respectively. The measured mean and Leq values were 68.16 dBA and 80.22 dBA for silent areas, 67.82 dBA and 80.45 dBA for residential areas, 78 dBA and 100.95 dBA for mixed areas, 72.77 dBA and 83.24 dBA for commercial areas, 79.89 dBA and 85.36 dBA for industrial areas, and 78.76 dBA and 101.60 dBA for road intersections. The hierarchy in various land uses based on mean noise level was Industrial Area > Road Intersection > Mixed Area > Commercial Area > Silent Area > Residential Area. The three highest noise-polluted areas were Shib Bari Mor Bus Stand (106.94 dBA), Khulna Stadium Area (105.81 dBA), and Sonadanga Bus Station (104.50 dBA), whereas the three lowest noise-polluted areas were Khulna Govt. Girls High School (65.87 dBA), Khulna New Market (70.85 dBA), and Karim Nagar (74.92 dBA) based on Leq. However, we found that the noise level in all study locations exceeded the national standard.
| Published in | American Journal of Environmental Science and Engineering (Volume 9, Issue 2) |
| DOI | 10.11648/j.ajese.20250902.16 |
| Page(s) | 86-97 |
| Creative Commons |
This is an Open Access article, distributed under the terms of the Creative Commons Attribution 4.0 International License (http://creativecommons.org/licenses/by/4.0/), which permits unrestricted use, distribution and reproduction in any medium or format, provided the original work is properly cited. |
| Copyright |
Copyright © The Author(s), 2025. Published by Science Publishing Group |
Noise Pollution, Land Use, Noise Standard, Khulna City, and Bangladesh
Land Use (N) | Mean | Minimum | Maximum | Standard Deviation | Range | Median | Rank |
|---|---|---|---|---|---|---|---|
Silent Area (11) | 68.16 | 36.60 | 99.70 | 9.81 | 63.10 | 67.80 | 5 |
Residential Area (6) | 67.82 | 47.50 | 103.00 | 9.10 | 55.50 | 66.50 | 6 |
Mixed Area (6) | 78.00 | 60.60 | 128.10 | 8.78 | 67.50 | 76.40 | 3 |
Commercial Area (8) | 72.77 | 54.60 | 105.60 | 8.78 | 51.00 | 72.40 | 4 |
Industrial Area (2) | 79.89 | 57.20 | 97.70 | 8.17 | 40.50 | 80.40 | 1 |
Road Intersection (6) | 78.76 | 50.30 | 128.60 | 9.76 | 78.30 | 78.10 | 2 |
Overall (39) | 72.82 | 36.60 | 128.60 | 10.40 | 92.00 | 72.60 | - |
(I) Land Use | (J) Land Use | Mean Difference (I-J) | Standard Error | Sig. |
|---|---|---|---|---|
Silent Area | Mixed Areas | 0.3363 | 0.30122 | 0.264 |
Residential Area | -9.8416* | 0.28578 | 0 | |
Commercial Area | -4.6135* | 0.27353 | 0 | |
Industrial Area | -11.7248* | 0.51743 | 0 | |
Road Intersection | -10.5984* | 0.29067 | 0 | |
Mixed Areas | Silent Area | -0.3363 | 0.30122 | 0.264 |
Residential Area | -10.1779* | 0.33544 | 0 | |
Commercial Area | -4.9498* | 0.32507 | 0 | |
Industrial Area | -12.0611* | 0.54642 | 0 | |
Road Intersection | -10.9347* | 0.33962 | 0 | |
Residential Area | Silent Area | 9.8416* | 0.28578 | 0 |
Mixed Areas | 10.1779* | 0.33544 | 0 | |
Commercial Area | 5.2281* | 0.31082 | 0 | |
Industrial Area | -1.8832* | 0.53807 | 0 | |
Road Intersection | -.7568* | 0.32601 | 0.02 | |
Commercial Area | Silent Area | 4.6135* | 0.27353 | 0 |
Mixed Areas | 4.9498* | 0.32507 | 0 | |
Residential Area | -5.2281* | 0.31082 | 0 | |
Industrial Area | -7.1113* | 0.53167 | 0 | |
Road Intersection | -5.9849* | 0.31533 | 0 | |
Industrial Area | Silent Area | 11.7248* | 0.51743 | 0 |
Mixed Areas | 12.0611* | 0.54642 | 0 | |
Residential Area | 1.8832* | 0.53807 | 0 | |
Commercial Area | 7.1113* | 0.53167 | 0 | |
Road Intersection | 1.1263* | 0.54068 | 0.037 | |
Road Intersection | Silent Area | 10.5984* | 0.29067 | 0 |
Mixed Areas | 10.9347* | 0.33962 | 0 | |
Residential Area | .7568* | 0.32601 | 0.02 | |
Commercial Area | 5.9849* | 0.31533 | 0 | |
Industrial Area | -1.1263* | 0.54068 | 0.037 | |
* The mean difference is significant at the 0.05 level. | ||||
Land Use (N) | Location | Standard Value | Within Standard (%) |
|---|---|---|---|
Silent Area (11) | Bagan Bari Jame Mosjid | 50 | 0.00% |
Bangladesh Water Development Board | 0.00% | ||
District Officers Office | 0.00% | ||
Khulna Circuit House | 0.00% | ||
Khulna Collegiate School | 0.00% | ||
Khulna Govt Girls High School | 25.68% | ||
Khulna Nagar Bhovon | 0.00% | ||
Khulna Physiotherapy Division | 0.00% | ||
Khulna Textile Mills High School | 0.00% | ||
Khulna Zila Porishod Karjaloy | 0.00% | ||
P W D High School | 0.00% | ||
Mean | 2.33% | ||
Residential Area (6) | East Sonadanga Para | 55 | 2.70% |
Karim Nagar | 8.97% | ||
Lucas Colony | 8.67% | ||
Nur Nagar Para | 12.16% | ||
P W D Para | 0.00% | ||
Sonadanga Para | 2.70% | ||
Mean | 5.87% | ||
Mixed Areas (6) | B D B L Bhabon | 60 | 0.00% |
Boyra Area | 0.00% | ||
Khulna Stadium Area | 0.00% | ||
Power House Area | 0.00% | ||
Shib Bari Shri Kali Mandir | 0.00% | ||
Sonadanga Bus Station | 0.00% | ||
Mean | 0.00% | ||
Commercial Area (8) | Clay Road Boro Bazar | 70 | 57.09% |
Helatola Road | 15.53% | ||
Khulna New Market | 71.58% | ||
Khulna Sador Kacha Bazar | 24.38% | ||
Kodom Tola Bazar | 52.58% | ||
Launch Gate Terminal | 71.48% | ||
Mojid Sarok | 7.42% | ||
Upper Jashore Road | 5.29% | ||
Mean | 38.17% | ||
Industrial Area (2) | Bhai Bhai Food Factory | 75 | 0.00% |
West Zone Power Distribution Company Ltd | 48.17% | ||
Mean | 24.09% | ||
All Mean | 14.09% | ||
AC | Alternating Current |
BDBL | Bangladesh Development Bank PLC |
CAPS | Center for Atmospheric Pollution Studies |
dBA | A-weighted Decibel |
DoE | Department of Environment |
GB | Gigabyte |
GIS | Geographic Information System |
Govt | Government |
KDA | Khulna Development Authority |
Leq | Equivalent Continuous Sound Pressure Level |
Ltd | Limited |
MAX | Maximum |
MIN | Minimum |
N | Number (in terms of quantity) |
NIHL | Noise-Induced Hearing Loss |
PC | Personal Computer |
PWD | Public Works Department |
REC | Record |
SD | Secure Digital |
SPSS | Statistical Package for the Social Sciences |
WHO | World Health Organization |
| [1] | Islam Z, Abdullah F, Khanom M. Evaluation of traffic accessibility condition and noise pollution in Dhaka City of Bangladesh. American Journal of Traffic and Transportation Engineering. 2021; 6(2): 43-51. |
| [2] | Rao PR, Rao MGS. Community Reaction to Road Traffic Noise. Applied Acoustics. 1992; 37: 51-64. |
| [3] | United Nations Environment Programme (UNEP). Frontiers 2022: Noise, Blazes and Mismatches – Emerging Issues of Environmental Concern. Nairobi: UNEP; 2022. |
| [4] | Alam MJB, Rauf, AFMA, Ahmed, MF. Traffic induced noise pollution in Dhaka City. J Civil Engineer 2001; 29(1):1-9. |
| [5] | Moniruzzaman SM, Rahman MM, Arifuzzaman M, Gazder U. Study on noise pollution in some selected areas of khulna city area. In 2021 International Conference on Decision Aid Sciences and Application (DASA) 2021; 73-79. |
| [6] | Wongsurakiat P, Maranetra KN, Nana A, Naruman C, Aksornint M, Chalermsanyakorn T. Respiratory symptoms and pulmonary function of traffic policemen in Thonburi. Journal of the Medical Association of Thailand; Chotmaihet thangphaet. 1999 May 1; 82(5): 435-43. |
| [7] | Karita K, Yano E, Jinsart W, Boudoung D, Tamura K. Respiratory symptoms and pulmonary function among traffic police in Bangkok, Thailand. Archives of Environmental Health: An International Journal. 2001 Sep 1; 56(5): 467-70. |
| [8] | Shrestha I. Health Effects of Vehicular Noise Pollution on Traffic Police Personnel in Kathmandu. Dissertation submitted in partial fulfillment of the requirements for the degree of Bachelor of Science, Department of Environment Science, St Xavier’s College. 1998. |
| [9] | Shakya S. Health problems prevalent in the Traffic police personnel due to vehicular air pollution in Kathmandu (Doctoral dissertation, Dissertation submitted in partial fulfillment of the requirement of the requirements of the degree of Bachelor of Science (Environmental Science), St. Xavier’s College, Kathmandu). 2001. |
| [10] | Tamura K, Jinsart W, Yano E, Karita K, Boudoung D. Particulate air pollution and chronic respiratory symptoms among traffic policemen in Bangkok. Archives of Environmental Health: An International Journal. 2003 Apr 1; 58(4): 201-7. |
| [11] | DeToni A, Finotto L. Respiratory diseases in a group of traffic police officers: results of a 5-year follow-up. Giornale italiano di medicina del lavoro ed ergonomia. 2005; 27(3): 380-2. |
| [12] | Tripathi SR, Tiwari RR. Self-reported hearing quality of traffic policemen: A questionnaire-based study. Indian journal of occupational and environmental Medicine. 2006; 10(2): 82-4. |
| [13] | Majumder AK. Noise Induced Hearing Quality Assessments of Traffic Police Personnel in Dhaka City. Journal of Environment Pollution and Human Health. 2018; 6(4): 121-5. |
| [14] | Majumder AK, Bhuiyan, ML, Akter, S. Status of Noise Pollution in Different Silent Zone of Lalmatia Residential Area of Dhaka City. Journal of SUB. 2016; 6(1): 81–91. |
| [15] | Majumder AK. Health Impact Assessment of Noise Pollution on Traffic Policemen of Kathmandu Valley, Nepal. Stamford Journal of Environment and Human Habitat. 2012; 1: 120–32. |
| [16] | Majumder AK, Rauniyar R, Carter WS, Khanal SN, Bajracharya RM, Joshi SK. Noise induced hearing loss of Kathmandu valley traffic police: A self reported occupational health study. Bangladesh J Environ Sci. 2010; 18: 77-82. |
| [17] | World Health Organization. The world health report 2002: reducing risks, promoting healthy life. World Health Organization; 2002. |
| [18] | Nandi SS, Dhatrak SV. Occupational noise-induced hearing loss in India. Indian journal of occupational and environmental medicine. 2008; 12(2): 53-6. |
| [19] | NIOSH. Criteria for a recommended standard: occupational noise exposure. Cincinnati, OH, National Institute for Occupational Safety and Health. 1998. |
| [20] | World Health Organization. Occupational and community noise. In Occupational and community noise 2001. |
| [21] | Majumder AK, Islam, KMN, Biswas, JD, Paul, B. Assessment of Citizens Perception towards Traffic Noise Induced Hearing Loss in Dhaka City. Stamford Journal of Civil Engineering. 2011; 3(1). |
| [22] | Suter A. The noise manual. 5th ed. Berger E, Royster L, Rozster J, Driscoll D, Layne M, editors. American Industrial Hygiene Association, Fairfax, VA.; 2000. |
| [23] | Goelzer BI. Hazard prevention and control programmes. Goelzer, B., Hansen, CH, Sehrndt, GA (Ed.). Occupational Exposure to Noise: Evaluation. Prevention and Control, WHO, Geneva. 2001; 233: 244. |
| [24] | Murthy VK, Majumder AK, Khanal SN, Subedi DP. Assessment of traffic noise pollution in Banepa, a semi urban town of Nepal. Kathmandu University journal of science, engineering and technology. 2007; 3(2): 12-20. |
| [25] | Bluhm G, Nordling E, Berglind N. Road traffic noise and annoyance-An increasing environmental health problem. Noise and Health. 2004; 6(24): 43-9. |
| [26] | Meijer H, Knipschild P, Sallé H. Road traffic noise annoyance in Amsterdam. International archives of occupational and environmental health. 1985; 56: 285-97. |
| [27] | Ouis D. Annoyance caused by exposure to road traffic noise: An update. Noise and Health. 2002; 4(15): 69-79. |
| [28] | Öhrström E. Longitudinal surveys on effects of changes in road traffic noise—annoyance, activity disturbances, and psycho-social well-being. The Journal of the Acoustical Society of America. 2004; 115(2): 719-29. |
| [29] | De Hollander AE, van Kempen EE, Houthuijs DJ, Van Kamp I, Hoogenveen RT, Staatsen BA. Environmental noise: an approach for estimating health impacts at national and local level. Geneva: World Health Organization (Environmental Burden of Disease series). 2004. |
| [30] | Environmental Conservation Rules. Ministry of Environment & Forest, Government of the People’s Republic of Bangladesh. 2006. |
APA Style
Majumder, A. K., Paul, A., Ahamed, M. R. (2025). Assessment of Noise Pollution in Khulna City, Bangladesh. American Journal of Environmental Science and Engineering, 9(2), 86-97. https://doi.org/10.11648/j.ajese.20250902.16
ACS Style
Majumder, A. K.; Paul, A.; Ahamed, M. R. Assessment of Noise Pollution in Khulna City, Bangladesh. Am. J. Environ. Sci. Eng. 2025, 9(2), 86-97. doi: 10.11648/j.ajese.20250902.16
@article{10.11648/j.ajese.20250902.16,
  author = {Ahmad Kamruzzaman Majumder and Aniruddha Paul and Md. Rizvee Ahamed},
  title = {Assessment of Noise Pollution in Khulna City, Bangladesh
},
  journal = {American Journal of Environmental Science and Engineering},
  volume = {9},
  number = {2},
  pages = {86-97},
  doi = {10.11648/j.ajese.20250902.16},
  url = {https://doi.org/10.11648/j.ajese.20250902.16},
  eprint = {https://article.sciencepublishinggroup.com/pdf/10.11648.j.ajese.20250902.16},
  abstract = {This study has been conducted to assess the current state of noise pollution across various regions of Khulna City. 6 distinct zones and 39 locations were identified in Khulna City according to land use criteria. A sound level meter (REED SD-4023) was utilized to monitor noise levels in Khulna City from January 1, 2021, to April 30, 2021. At each sampling site, multiple samples were collected. The noise level at all locations had been measured three times per day. The mean noise level and Leq in Khulna City were found to be 72.82 dBA and 94.99 dBA, respectively. The measured mean and Leq values were 68.16 dBA and 80.22 dBA for silent areas, 67.82 dBA and 80.45 dBA for residential areas, 78 dBA and 100.95 dBA for mixed areas, 72.77 dBA and 83.24 dBA for commercial areas, 79.89 dBA and 85.36 dBA for industrial areas, and 78.76 dBA and 101.60 dBA for road intersections. The hierarchy in various land uses based on mean noise level was Industrial Area > Road Intersection > Mixed Area > Commercial Area > Silent Area > Residential Area. The three highest noise-polluted areas were Shib Bari Mor Bus Stand (106.94 dBA), Khulna Stadium Area (105.81 dBA), and Sonadanga Bus Station (104.50 dBA), whereas the three lowest noise-polluted areas were Khulna Govt. Girls High School (65.87 dBA), Khulna New Market (70.85 dBA), and Karim Nagar (74.92 dBA) based on Leq. However, we found that the noise level in all study locations exceeded the national standard.
},
 year = {2025}
}
TY  - JOUR
T1  - Assessment of Noise Pollution in Khulna City, Bangladesh

AU  - Ahmad Kamruzzaman Majumder
AU  - Aniruddha Paul
AU  - Md. Rizvee Ahamed
Y1  - 2025/06/23
PY  - 2025
N1  - https://doi.org/10.11648/j.ajese.20250902.16
DO  - 10.11648/j.ajese.20250902.16
T2  - American Journal of Environmental Science and Engineering
JF  - American Journal of Environmental Science and Engineering
JO  - American Journal of Environmental Science and Engineering
SP  - 86
EP  - 97
PB  - Science Publishing Group
SN  - 2578-7993
UR  - https://doi.org/10.11648/j.ajese.20250902.16
AB  - This study has been conducted to assess the current state of noise pollution across various regions of Khulna City. 6 distinct zones and 39 locations were identified in Khulna City according to land use criteria. A sound level meter (REED SD-4023) was utilized to monitor noise levels in Khulna City from January 1, 2021, to April 30, 2021. At each sampling site, multiple samples were collected. The noise level at all locations had been measured three times per day. The mean noise level and Leq in Khulna City were found to be 72.82 dBA and 94.99 dBA, respectively. The measured mean and Leq values were 68.16 dBA and 80.22 dBA for silent areas, 67.82 dBA and 80.45 dBA for residential areas, 78 dBA and 100.95 dBA for mixed areas, 72.77 dBA and 83.24 dBA for commercial areas, 79.89 dBA and 85.36 dBA for industrial areas, and 78.76 dBA and 101.60 dBA for road intersections. The hierarchy in various land uses based on mean noise level was Industrial Area > Road Intersection > Mixed Area > Commercial Area > Silent Area > Residential Area. The three highest noise-polluted areas were Shib Bari Mor Bus Stand (106.94 dBA), Khulna Stadium Area (105.81 dBA), and Sonadanga Bus Station (104.50 dBA), whereas the three lowest noise-polluted areas were Khulna Govt. Girls High School (65.87 dBA), Khulna New Market (70.85 dBA), and Karim Nagar (74.92 dBA) based on Leq. However, we found that the noise level in all study locations exceeded the national standard.

VL  - 9
IS  - 2
ER  -
Department of Environmental Science, Stamford University Bangladesh, Dhaka, Bangladesh
Center for Atmospheric Pollution Studies (CAPS), Dhaka, Bangladesh
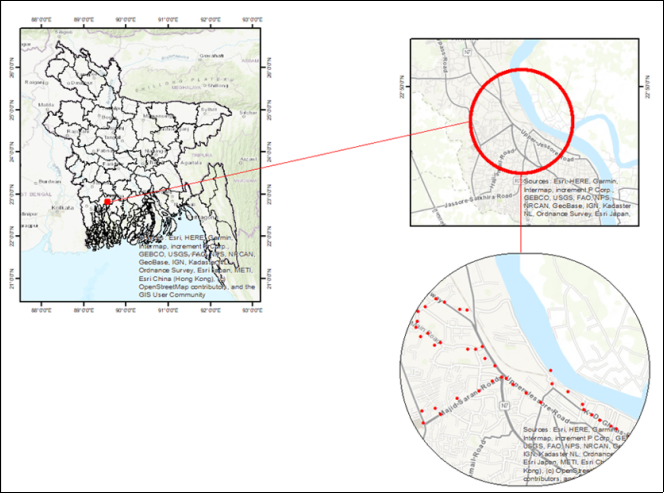
Figure 1. Sampling Locations of Khulna City.
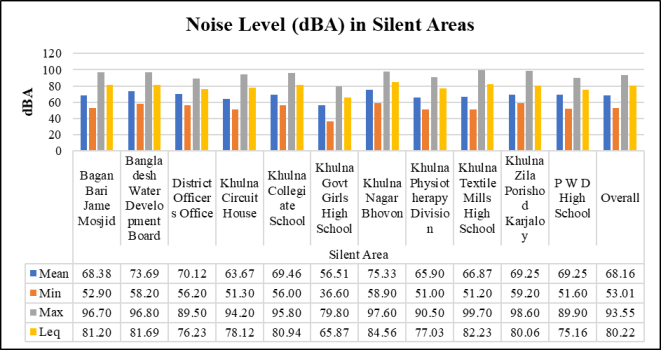
Figure 2. Noise Level (dBA) in Silent Areas.
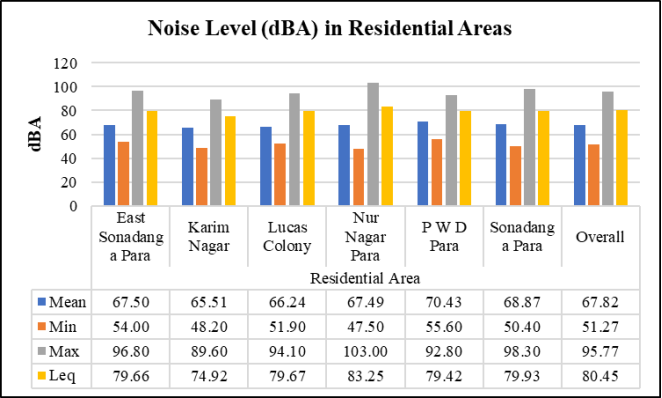
Figure 3. Noise Level (dBA) in Residential Areas.
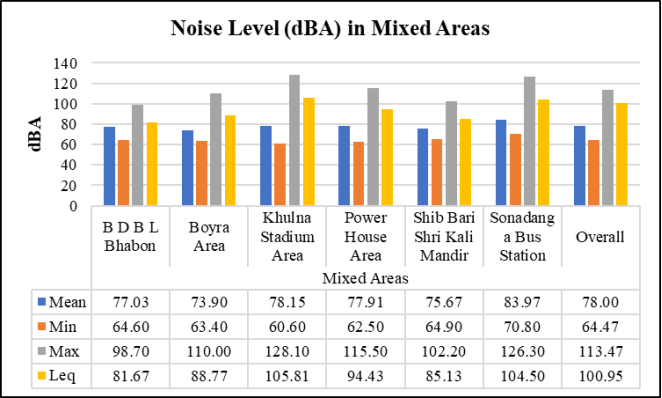
Figure 4. Noise Level (dBA) in Mixed Areas.
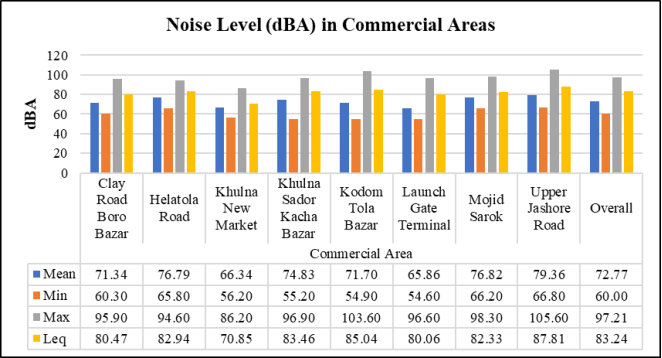
Figure 5. Noise Level (dBA) in Commercial Areas.
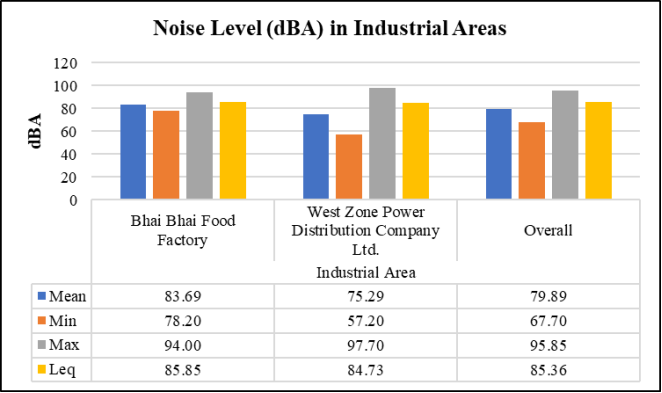
Figure 6. Noise Level (dBA) in Industrial Areas.
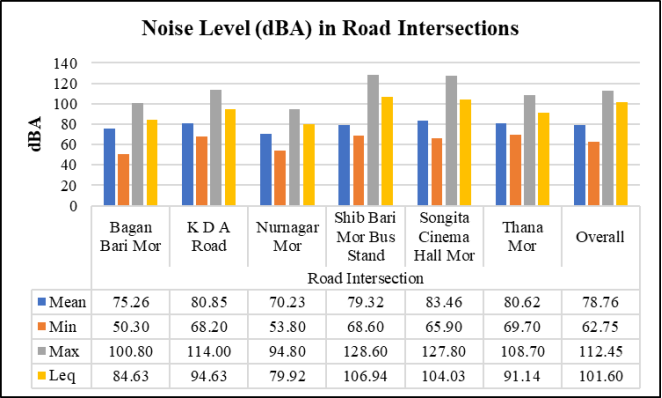
Figure 7. Noise Level (dBA) in Road Intersections.
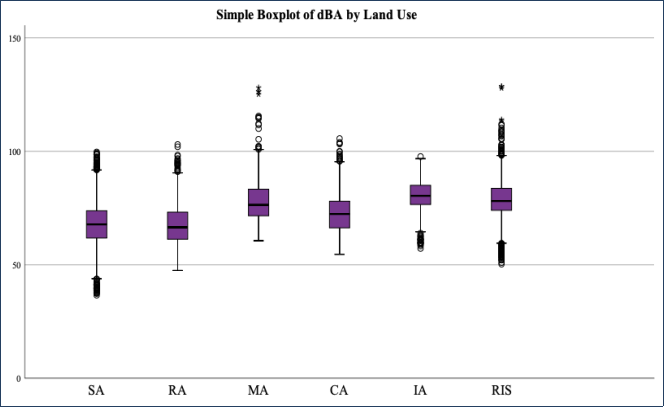
Figure 8. Mean Noise Pollution (dBA) in Khulna City.
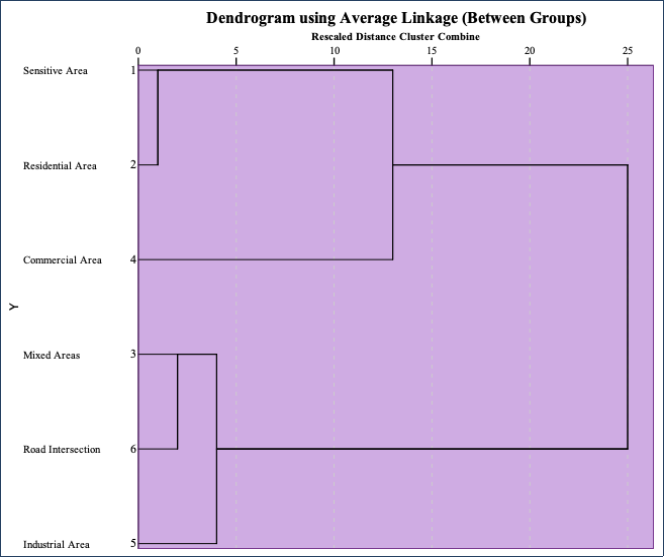
Figure 9. Land Use Based Cluster, in Terms of dBA.
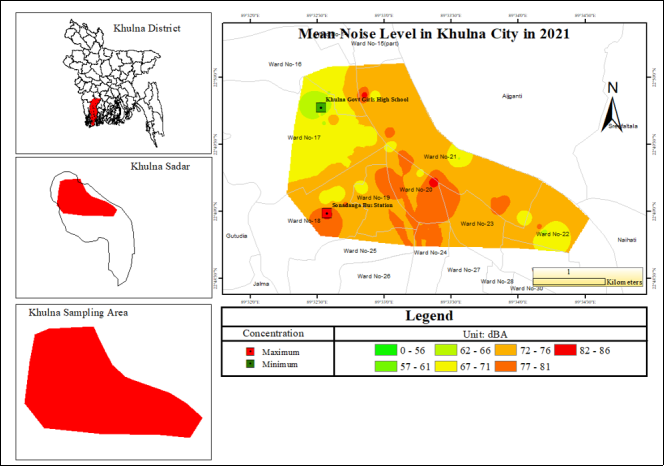
Figure 10. Spatial Map of Mean Noise Pollution.
Information

