
 ,
Arooj Sajjad,
Iqra Arshad,
Sajid Hussain*,
Muhammad Javid,
Muhammad Sajid Abbas,
Muhammad Hasnain,
Abuzar Hasnain Raza,
Samina Liaqat,
Iqra Khaliq,
Ateeq Ur Rehman
,
Arooj Sajjad,
Iqra Arshad,
Sajid Hussain*,
Muhammad Javid,
Muhammad Sajid Abbas,
Muhammad Hasnain,
Abuzar Hasnain Raza,
Samina Liaqat,
Iqra Khaliq,
Ateeq Ur Rehman
The present study give information about Ag-doped cerium dioxide (Ag@CeO2) nanoparticles (Agx Ce1-x O2, where x = 0, 0.02, 0.04, and 0.06 molar ratios, corresponding to 0, 2, 4, and 6 mol% Ag) that were synthesized via a cost-effective and novel sol-gel method. Pure and Ag-doped CeO2 samples with varying dopant concentrations were prepared to evaluate the influence of Ag-doping on the fluorite cubic structure of ceria. Characterization Techniques like X-ray diffraction analysis confirmed the phase change from amorphous to face centered cube (FCC) in Ag@CeO2 and crystallite size from 19.29 nm for pure CeO2 to 18.70 nm for Ag-doped CeO2, as calculated using the Scherrer equation. Scanning Electron Microscopy analysis revealed the non-uniform and irregular surface morphology of Ag@CeO2 NPs using SEM micrograph. notable red shift in the absorption edge, corresponding to a bandgap (Eg) narrowing from ~ 3.2 eV down to ~ 2.7 eV with increasing silver concentration. Scanning electron microscopy (SEM) and transmission electron microscopy (TEM) analysis’s showed significant morphological changes, transitioning from uniform spherical grains to agglomerated nanostructures with enhanced surface-to-volume ratios. UV-Visible analysis conformed Fourier-transform infrared (FTIR) spectroscopy, which further validated the formation of Ce-O and Ag-O vibrational modes. Energy-dispersive X-ray spectroscopy (EDX) verified elemental composition and weight percentage distributions. The enhanced optical response and tailored nanostructure make these Ag-CeO2 nanoparticles highly promising candidates for optoelectronic devices, photocatalytic degradation, and biomedical applications.
| Published in | American Journal of Materials Synthesis and Processing (Volume 11, Issue 2) |
| DOI | 10.11648/j.ajmsp.20261102.11 |
| Page(s) | 38-51 |
| Creative Commons |
This is an Open Access article, distributed under the terms of the Creative Commons Attribution 4.0 International License (http://creativecommons.org/licenses/by/4.0/), which permits unrestricted use, distribution and reproduction in any medium or format, provided the original work is properly cited. |
| Copyright |
Copyright © The Author(s), 2026. Published by Science Publishing Group |
Ag@CeO2) NPs, Cerium Dioxide, Morphological Properties, Ag-doped, Materials Characterizations
Compound | Molecular waight(g) |
|---|---|
Silver Nitrate | 169.87 |
Acetic acid | 60.052 |
Sodium hydroxide | 39.99 |
DI water | 18.015 |
Cerium (IV) Sulfate tetrahydrate | 404.3 |
Properties | Silver Nitrate |
|---|---|
The molecular weight of AgNO3 | 169.87 g/mol |
Density of silver Nitrate | 4.35g/cm3 |
Melting point of AgNO3 | 212°C |
Boiling point of AgNO3 | 440°C |
FCC | Face Centered Cube |
TEM | Transmission Electron Microscopy |
SEM | Scanning Electron Microscopy |
FTIR | Fourier Transform Infrared |
XRD | X-Ray Power Diffraction |
NPs | Nanoparticles |
| [1] | Sun, H., Sohail, A., Shah, A., Liaqat, Z., & Gul, M. (2025). From precursors to performance: Diverse synthesis strategies for cerium oxide nanoparticles. Phytopharmacology Research Journal, 4(2), 28-42. |
| [2] | Selvaraj, S., Chauhan, A., Radhakrishnan, A., Rana, G., Dutta, V., Batoo, K. M., & Ghotakar, S. (2024). Cerium oxide nanoparticles and their polymeric composites: advancements in biomedical applications. Journal of Inorganic and Organometallic Polymers and Materials, 34(12), 5691-5717. |
| [3] | Peera, S. G., & Kim, S. W. (2025). Rare earth Ce/CeO2 electrocatalysts: role of high electronic spin state of Ce and Ce3+/Ce4+ redox couple on oxygen reduction reaction. Nanomaterials, 15(8), 600. |
| [4] | Zhu, C., Tian, Q., Wang, B., Liu, J., Han, J., Le, S.,... & Xu, H. (2025). Applications of CeO2-based heterojunctions in photocatalytic bactericidal and antitumor therapy. Journal of Rare Earths, 43(3), 441-452. |
| [5] | Zhuang, X., Magnone, E., Han, S. W., & Park, J. H. (2024). Novel surface modification strategies for enhanced CeO2 nanoparticle dispersion and suspension stability. Ceramics International, 50(13), 24801-24814. |
| [6] | Alaguvel, K., Arun, V., Rahmayanti, Y. D., Handayani, M., Parvathy, S., Vijayakumar, P.,... & Sivakumar, S. (2025). Inorganic-carbon nanohybrid rGO/Ag-CeO2 nanocomposites with structural insights and dual photocatalytic-antibacterial properties. Journal of Inorganic and Organometallic Polymers and Materials, 1-17. |
| [7] | Negi, K., Umar, A., Chauhan, M. S., & Akhtar, M. S. (2019). Ag/CeO2 nanostructured materials for enhanced photocatalytic and antibacterial applications. Ceramics International, 45(16), 20509-20517. |
| [8] | Yaqoob, A. A., Umar, K., & Ibrahim, M. N. M. (2020). Silver nanoparticles: various methods of synthesis, size affecting factors and their potential applications–a review. Applied Nanoscience, 10(5), 1369-1378. |
| [9] | Mustapha, N., & Hjiri, M. (2026). Advances in eco-efficient and accelerated sol–gel routes for hybrid nanostructures. Journal of Sol-Gel Science and Technology, 117(2), 59. |
| [10] | Engineering, A. I. M. S. A. (2025). RETRACTION: Nanomaterial by Sol‐Gel Method: Synthesis and Application. |
| [11] | Vedhantham, K., Karthik, K., Keerthi, P., & Ramalingam, K. (2025). Biogenic novel Z-scheme Ag–CeO2/MgAl-LDH composite for enhanced photocatalytic dye degradation. Materials Chemistry and Physics, 337, 130539. |
| [12] | Hussain, M., Ali, G., Hussain, F., Hussain, M., & Arif, M. M. (2024). Silver doped CO2 nanocomposites for photo degradation of selected azo dyes. Journal of the Pakistan Institute of Chemical Engineers, 52(2). |
| [13] | Katta, V. K. M., & Dubey, R. S. (2021). Green synthesis of silver nanoparticles using Tagetes erecta plant and investigation of their structural, optical, chemical and morphological properties. Materials Today: Proceedings, 45, 794-798. |
| [14] | Pachaiappan, R., Nagesh, S. D., Nayak, A. K., Arenas-Herrera, M. J., Vinayagamurthi, B., & Cornejo-Ponce, L. (2025). An enhanced solar driven photodegradation of methylene blue and antibacterial activity by Ag doped CeO2 nanocatalyst. Chemical Papers, 1-20. |
| [15] | Arun Kumar, T., Mahimairaj, P., Venkatesh, R., Kistan, A., & Rajeswaran, P. (2026). Investigation of antibacterial and organic pollutants degradation using UV-light hypersensitive chitosan-doped CeO2-Ga2O3 binary nanocomposites. Journal of Sol-Gel Science and Technology, 118(1), 12. |
| [16] | Ortiz Ortega, E., Hosseinian, H., Rosales López, M. J., Rodríguez Vera, A., & Hosseini, S. (2022). Characterization techniques for chemical and structural analyses. In Material Characterization Techniques and Applications (pp. 93-152). Singapore: Springer Singapore. |
| [17] | Gruene, T., & Mugnaioli, E. (2021). 3D electron diffraction for chemical analysis: instrumentation developments and innovative applications. Chemical reviews, 121(19), 11823. |
| [18] | Khan, M. M. (2025). X-ray diffraction. Photocatalysts: Synthesis and Characterization Methods, 213-223. |
| [19] | Khan, H., Yerramilli, A. S., D'Oliveira, A., Alford, T. L., Boffito, D. C., & Patience, G. S. (2020). Experimental methods in chemical engineering: X‐ray diffraction spectroscopy—XRD. The Canadian journal of chemical engineering, 98(6), 1255-1266. |
| [20] | Kiani, D. (2023). X-ray diffraction (XRD). In Springer Handbook of Advanced Catalyst Characterization (pp. 519-539). Cham: Springer International Publishing. |
| [21] | Goldstein, J. I., Newbury, D. E., Michael, J. R., Ritchie, N. W., Scott, J. H. J., & Joy, D. C. (2017). X-rays. In Scanning Electron Microscopy and X-Ray Microanalysis (pp. 39-63). New York, NY: Springer New York. |
| [22] | Egdell, R. G., & Bruton, E. (2020). Henry Moseley, X-ray spectroscopy and the periodic table. Philosophical Transactions of the Royal Society A, 378(2180), 20190302. |
| [23] | Widmer, W. R., & Thrall, D. E. (2024). Radiation protection and physics of diagnostic radiology. Thrall's Textbook of Veterinary Diagnostic Radiology-E-Book, 1. |
| [24] | Newbury*, D. E., & Ritchie, N. W. (2013). Is scanning electron microscopy/energy dispersive X‐ray spectrometry (SEM/EDS) quantitative?. Scanning, 35(3), 141-168. |
| [25] | Ukkunda, N. S., Santhoshkumar, P., Paranthaman, R., & Moses, J. A. (2025). X-ray diffraction and its emerging applications in the food industry. Critical Reviews in Food Science and Nutrition, 65(24), 4660-4675. |
| [26] | Behling, R. (2021). Modern diagnostic x-ray sources: technology, manufacturing, reliability. CRC Press. |
| [27] | Vettumperumal, R., Dhineshbabu, N. R., PV, E., & Kit, C. C. (2024). XRD peak profile and inverse pole figure analysis of ceria (CeO2) nanoparticles. Iranian Journal of Science, 48(6), 1653-1661. |
| [28] | Wang, G., Mu, Q., Chen, T., & Wang, Y. (2010). Synthesis, characterization and photoluminescence of CeO2 nanoparticles by a facile method at room temperature. Journal of Alloys and Compounds, 493(1-2), 202-207. |
| [29] | Kannan, M. (2018). Scanning electron microscopy: Principle, components and applications. A textbook on fundamentals and applications of nanotechnology, 81-92. |
| [30] | Ali, A., Zhang, N., & Santos, R. M. (2023). Mineral characterization using scanning electron microscopy (SEM): a review of the fundamentals, advancements, and research directions. Applied Sciences, 13(23), 12600. |
| [31] | Prakash, D., & Kotian, R. P. (2025). Computed Tomography: Physics, Principle of Operation, Quality Control, and Safety. In Fundamentals of X-ray Imaging: Basic Principles, Quality Control, Clinical Applications, and Safety (pp. 313-415). Singapore: Springer Nature Singapore. |
| [32] | Podor, R., Bouala, G. N., Ravaux, J., Lautru, J., & Clavier, N. (2019). Working with the ESEM at high temperature. Materials Characterization, 151, 15-26. |
| [33] | Kisielowski, C. (2015). Observing atoms at work by controlling beam–sample interactions. Advanced Materials, 27(38), 5838-5844. |
| [34] | Thomson, E. E., Harfouche, M., Kim, K., Konda, P. C., Seitz, C. W., Cooke, C.,... & Naumann, E. A. (2022). Gigapixel imaging with a novel multi-camera array microscope. Elife, 11, e74988. |
| [35] | Sun, Z., Pan, J., Chen, W., Chen, H., Zhou, S., Wu, X.,... & Zhang, Q. (2024). Electrochemical processes and reactions in rechargeable battery materials revealed via in situ transmission electron microscopy. Advanced Energy Materials, 14(2), 2303165. |
| [36] | Wischnitzer, S. (2013). Introduction to electron microscopy. Elsevier. |
| [37] | Khalid, K., Ishak, R., & Chowdhury, Z. Z. (2024). UV–Vis spectroscopy in non-destructive testing. In Non-destructive material characterization methods (pp. 391-416). Elsevier. |
| [38] | Mandru, A., Mane, J., & Mandapati, R. (2023). A review on UV-visible spectroscopy. Journal of Pharma Insights and Research, 1(2), 091-096. |
| [39] | Bunzel, M., & Penner, M. H. (2024). Ultraviolet, Visible, and Fluorescence Spectroscopy. In Nielsen's Food Analysis (pp. 77-94). Cham: Springer International Publishing. |
| [40] | Haque, F., Bubli, S. Y., & Khan, M. S. (2021). UV–Vis spectroscopy for food analysis. In Techniques to measure food safety and quality: Microbial, chemical, and sensory (pp. 169-193). Cham: Springer International Publishing. |
| [41] | Gebishu, M., Fikadu, B., Bekele, B., Tesfaye Jule, L., N, N., & Ramaswamy, K. (2022). Fluorescence and UV/visible spectroscopic investigation of orange and mango fruit juice quality in case of Adama Town. Scientific Reports, 12(1), 7345. |
| [42] | Sitorus, R., Herman, and Hendro. Optical Characteristic Properties of Probiotic Drink Using Spectrophotometer UV/Vis and FTIR. in Journal of Physics: Conference Series. 2019. IOP Publishing. |
| [43] | Power, A. C., Chapman, J., Chandra, S., & Cozzolino, D. (2019). Ultraviolet-visible spectroscopy for food quality analysis. Evaluation technologies for food quality, 91-104. |
| [44] | Siddique, I. (2024). Exploring functional groups and molecular structures: a comprehensive analysis using FTIR spectroscopy. Chemistry Research Journal, 9(2), 70-76. |
| [45] | Xia, L., Liu, Y., Chen, R. T., Weng, B., & Zou, Y. (2024). Advancements in miniaturized infrared spectroscopic-based volatile organic compound sensors: A systematic review. Applied Physics Reviews, 11(3). |
| [46] | Moura, P. C., Vassilenko, V., & Ribeiro, P. A. (2023). Ion mobility spectrometry towards environmental volatile organic compounds identification and quantification: a comparative overview over infrared spectroscopy. Emission Control Science and Technology, 9(1), 25-46. |
| [47] | Xing, Y., Wang, G., Zhang, T., Shen, F., Meng, L., Wang, L.,... & He, S. (2022). VOC detections with optical spectroscopy. Progress In Electromagnetics Research, 173, 71. |
| [48] | T Tkachenko, Y., & Niedzielski, P. (2022). FTIR as a method for qualitative assessment of solid samples in geochemical research: a review. Molecules, 27(24), 8846. |
| [49] | Al-Amin, K., Kawsar, M., Mamun, M. T. R. B., & Sahadat Hossain, M. (2025). Fourier transform infrared spectroscopic technique for analysis of inorganic materials: a review. Nanoscale Advances, 7(21), 6677-6702. |
| [50] | Kassem, A., Abbas, L., Coutinho, O., Opara, S., Najaf, H., Kasperek, D.,... & Tiquia-Arashiro, S. (2023). Applications of Fourier Transform-Infrared spectroscopy in microbial cell biology and environmental microbiology: advances, challenges, and future perspectives. Frontiers in microbiology, 14, 1304081. |
| [51] | Francis, G. A., Jeyakumar, S. S., Ray, S., Supreethee, S., & Vashishth, R. (2025). Emerging roles of FTIR spectroscopy in toxic metal profiling: innovations for food safety monitoring. Food Safety and Risk, 12(1), 9. |
APA Style
Kosir, T. N., Sajjad, A., Arshad, I., Hussain, S., Javid, M., et al. (2026). Design, Synthesis, and Characterization of Ag@CeO2 Nanoparticles: Tuning Their Structural, Optical, and Morphological Properties via Sol–Gel Method. American Journal of Materials Synthesis and Processing, 11(2), 38-51. https://doi.org/10.11648/j.ajmsp.20261102.11
ACS Style
Kosir, T. N.; Sajjad, A.; Arshad, I.; Hussain, S.; Javid, M., et al. Design, Synthesis, and Characterization of Ag@CeO2 Nanoparticles: Tuning Their Structural, Optical, and Morphological Properties via Sol–Gel Method. Am. J. Mater. Synth. Process. 2026, 11(2), 38-51. doi: 10.11648/j.ajmsp.20261102.11
AMA Style
Kosir TN, Sajjad A, Arshad I, Hussain S, Javid M, et al. Design, Synthesis, and Characterization of Ag@CeO2 Nanoparticles: Tuning Their Structural, Optical, and Morphological Properties via Sol–Gel Method. Am J Mater Synth Process. 2026;11(2):38-51. doi: 10.11648/j.ajmsp.20261102.11
@article{10.11648/j.ajmsp.20261102.11,
  author = {Tasmea Noureen Kosir and Arooj Sajjad and Iqra Arshad and Sajid Hussain and Muhammad Javid and Muhammad Sajid Abbas and Muhammad Hasnain and Abuzar Hasnain Raza and Samina Liaqat and Iqra Khaliq and Ateeq Ur Rehman},
  title = {Design, Synthesis, and Characterization of Ag@CeO2 Nanoparticles: Tuning Their Structural, Optical, and Morphological Properties via Sol–Gel Method},
  journal = {American Journal of Materials Synthesis and Processing},
  volume = {11},
  number = {2},
  pages = {38-51},
  doi = {10.11648/j.ajmsp.20261102.11},
  url = {https://doi.org/10.11648/j.ajmsp.20261102.11},
  eprint = {https://article.sciencepublishinggroup.com/pdf/10.11648.j.ajmsp.20261102.11},
  abstract = {The present study give information about Ag-doped cerium dioxide (Ag@CeO2) nanoparticles (Agx Ce1-x O2, where x = 0, 0.02, 0.04, and 0.06 molar ratios, corresponding to 0, 2, 4, and 6 mol% Ag) that were synthesized via a cost-effective and novel sol-gel method. Pure and Ag-doped CeO2 samples with varying dopant concentrations were prepared to evaluate the influence of Ag-doping on the fluorite cubic structure of ceria. Characterization Techniques like X-ray diffraction analysis confirmed the phase change from amorphous to face centered cube (FCC) in Ag@CeO2 and crystallite size from 19.29 nm for pure CeO2 to 18.70 nm for Ag-doped CeO2, as calculated using the Scherrer equation. Scanning Electron Microscopy analysis revealed the non-uniform and irregular surface morphology of Ag@CeO2 NPs using SEM micrograph. notable red shift in the absorption edge, corresponding to a bandgap (Eg) narrowing from ~ 3.2 eV down to ~ 2.7 eV with increasing silver concentration. Scanning electron microscopy (SEM) and transmission electron microscopy (TEM) analysis’s showed significant morphological changes, transitioning from uniform spherical grains to agglomerated nanostructures with enhanced surface-to-volume ratios. UV-Visible analysis conformed Fourier-transform infrared (FTIR) spectroscopy, which further validated the formation of Ce-O and Ag-O vibrational modes. Energy-dispersive X-ray spectroscopy (EDX) verified elemental composition and weight percentage distributions. The enhanced optical response and tailored nanostructure make these Ag-CeO2 nanoparticles highly promising candidates for optoelectronic devices, photocatalytic degradation, and biomedical applications.},
 year = {2026}
}
TY  - JOUR
T1  - Design, Synthesis, and Characterization of Ag@CeO2 Nanoparticles: Tuning Their Structural, Optical, and Morphological Properties via Sol–Gel Method
AU  - Tasmea Noureen Kosir
AU  - Arooj Sajjad
AU  - Iqra Arshad
AU  - Sajid Hussain
AU  - Muhammad Javid
AU  - Muhammad Sajid Abbas
AU  - Muhammad Hasnain
AU  - Abuzar Hasnain Raza
AU  - Samina Liaqat
AU  - Iqra Khaliq
AU  - Ateeq Ur Rehman
Y1  - 2026/09/18
PY  - 2026
N1  - https://doi.org/10.11648/j.ajmsp.20261102.11
DO  - 10.11648/j.ajmsp.20261102.11
T2  - American Journal of Materials Synthesis and Processing
JF  - American Journal of Materials Synthesis and Processing
JO  - American Journal of Materials Synthesis and Processing
SP  - 38
EP  - 51
PB  - Science Publishing Group
SN  - 2575-1530
UR  - https://doi.org/10.11648/j.ajmsp.20261102.11
AB  - The present study give information about Ag-doped cerium dioxide (Ag@CeO2) nanoparticles (Agx Ce1-x O2, where x = 0, 0.02, 0.04, and 0.06 molar ratios, corresponding to 0, 2, 4, and 6 mol% Ag) that were synthesized via a cost-effective and novel sol-gel method. Pure and Ag-doped CeO2 samples with varying dopant concentrations were prepared to evaluate the influence of Ag-doping on the fluorite cubic structure of ceria. Characterization Techniques like X-ray diffraction analysis confirmed the phase change from amorphous to face centered cube (FCC) in Ag@CeO2 and crystallite size from 19.29 nm for pure CeO2 to 18.70 nm for Ag-doped CeO2, as calculated using the Scherrer equation. Scanning Electron Microscopy analysis revealed the non-uniform and irregular surface morphology of Ag@CeO2 NPs using SEM micrograph. notable red shift in the absorption edge, corresponding to a bandgap (Eg) narrowing from ~ 3.2 eV down to ~ 2.7 eV with increasing silver concentration. Scanning electron microscopy (SEM) and transmission electron microscopy (TEM) analysis’s showed significant morphological changes, transitioning from uniform spherical grains to agglomerated nanostructures with enhanced surface-to-volume ratios. UV-Visible analysis conformed Fourier-transform infrared (FTIR) spectroscopy, which further validated the formation of Ce-O and Ag-O vibrational modes. Energy-dispersive X-ray spectroscopy (EDX) verified elemental composition and weight percentage distributions. The enhanced optical response and tailored nanostructure make these Ag-CeO2 nanoparticles highly promising candidates for optoelectronic devices, photocatalytic degradation, and biomedical applications.
VL  - 11
IS  - 2
ER  -
Department of Physics, University of Agriculture, Faisalabad, Pakistan
Department of Chemistry, Lahore Garrison University, Lahore, Pakistan
Department of Botany, University of Agriculture, Faisalabad, Pakistan
Department of Physics, University of Agriculture, Faisalabad, Pakistan
Department of Chemistry, University of Agriculture, Faisalabad, Pakistan
Department of Physics, University of Agriculture, Faisalabad, Pakistan
Department of Chemistry, University of Agriculture, Faisalabad, Pakistan
Department of Physics, University of Agriculture, Faisalabad, Pakistan
Department of Chemistry, Government College University, Faisalabad, Pakistan
Institute of Chemistry, Khawaja Fareed University of Engineering and Information Technology, Rahim Yar Khan, Pakistan
Department of Physics, University of Agriculture, Faisalabad, Pakistan
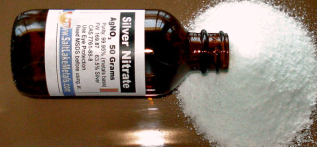
Figure 1. Silver Nitrate.
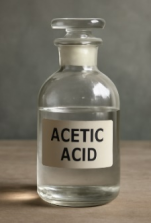
Figure 2. Acetic Acid.
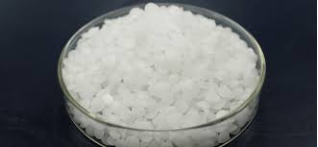
Figure 3. Sodium Hydroxide.
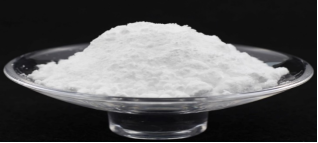
Figure 4. Cerium Sulfate.
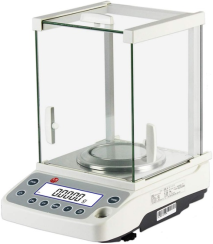
Figure 5. Electronic Balance.
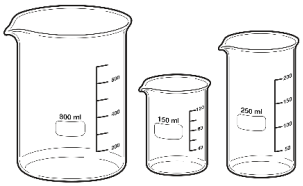
Figure 6. Beakers.
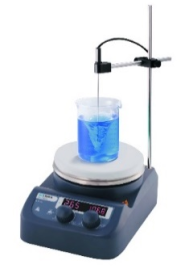
Figure 7. Magnetic Stirrer.
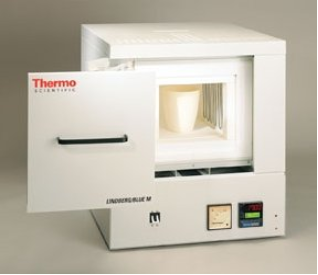
Figure 8. Centrifuge Machine.
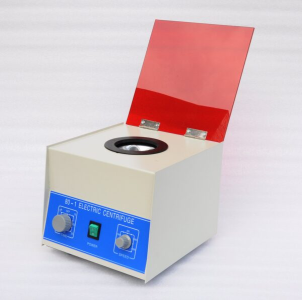
Figure 9. Furnace.
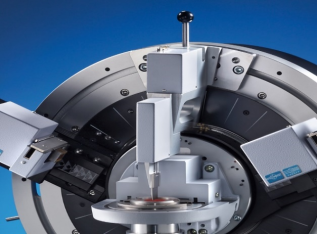
Figure 10. XRD.
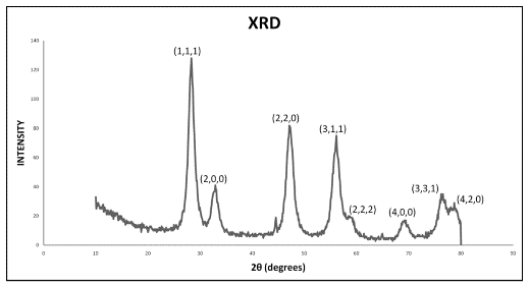
Figure 11. XRD Cerium nanoparticles.
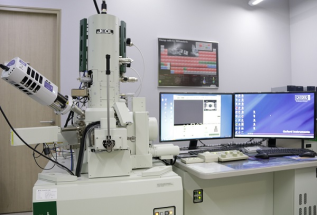
Figure 12. SEM Characterization Setup.
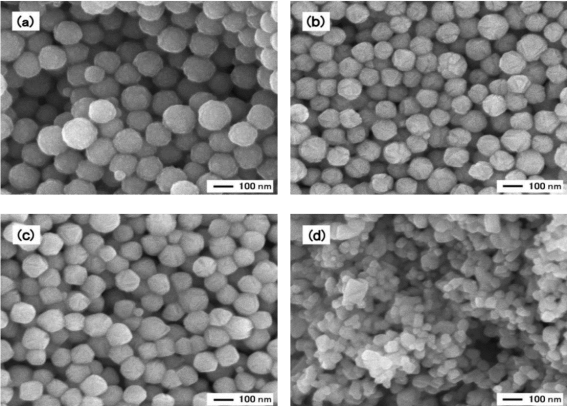
Figure 13. SEM Analysis of cerium oxide nanoparticles.
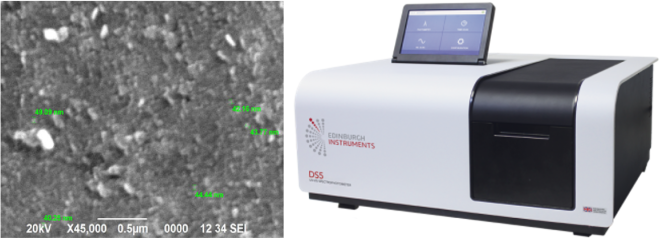
Figure 14. SEM Analysis of Ag Nanoparticles.
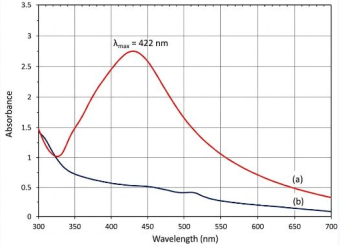
Figure 15. The UV-Visible absorption spectra of Ag nanoparticles.
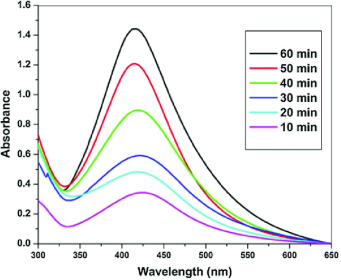
Figure 16. UV- Visible spectra.
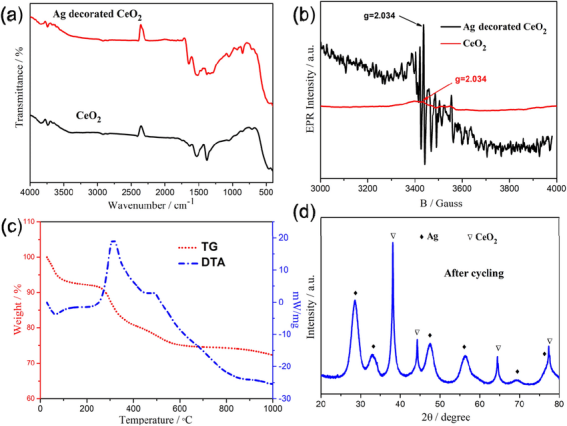
Figure 17. FTIR Ag-doped CeO2 infrared radiation.

Information


 Share This Article
 Twitter
 Linked In
 Facebook
 Copy
Copy Download