Research Article | | Peer-Reviewed

Optimization of Patient Radiation Protection and Dose Levels in Some Nigerian CT Facilities Using OSL Dosimetry

Received: 10 March 2026     Accepted: 22 April 2026     Published: 26 May 2026
Views:       Downloads:
Abstract

The increasing use of computed tomography (CT) in medical imaging has raised concerns regarding patient exposure to ionizing radiation, necessitating continuous evaluation of dose levels and optimization practices. This study presents a combined assessment of patient radiation dose and protection parameters during general and head CT examinations in selected diagnostic centers in Nigeria, utilizing Optically Stimulated Luminescence Dosimeters (OSLDs) for direct dose measurement. A retrospective analysis of 30 patients was conducted to evaluate skin dose during general CT examinations across three centers (A, B, and C), while a prospective study of 60 adult patients assessed head CT dose indices, including CTDIvol, CTDIw, dose length product (DLP), and effective dose. The mean skin doses for general CT were 9.92 mGy, 12.21 mGy, and 13.44 mGy for Centers A, B, and C respectively, corresponding to estimated effective doses of 0.15 mSv, 0.18 mSv, and 0.20 mSv. For head CT examinations, mean CTDIvol values ranged from 47.83 to 52.52 mGy, while mean DLP values varied from 1080.71 to 1485.48 mGy·cm, with effective doses between 2.49 and 3.17 mSv. Significant inter-center variations were observed, with general CT dose variability largely attributed to operator-dependent factors, whereas differences in head CT doses were primarily influenced by scan length and protocol implementation. Third-quartile values were used to establish local diagnostic reference levels (DRLs), which were higher than some international benchmarks but consistent with findings from similar healthcare settings. The study highlights the need for standardized CT protocols, routine dose monitoring, and strict adherence to the ALARA principle to enhance patient radiation protection while maintaining diagnostic image quality.

Published in American Journal of Physics and Applications (Volume 14, Issue 3)
DOI 10.11648/j.ajpa.20261403.11
Page(s) 32-39
Creative Commons

This is an Open Access article, distributed under the terms of the Creative Commons Attribution 4.0 International License (http://creativecommons.org/licenses/by/4.0/), which permits unrestricted use, distribution and reproduction in any medium or format, provided the original work is properly cited.

Copyright

Copyright © The Author(s), 2026. Published by Science Publishing Group

Keywords

Computed Tomography, Skin Dose, CTDIvol, Dose Length Product, Effective Dose, Diagnostic Reference Levels (DRLs)

1. Introduction
Computed Tomography (CT) has become an indispensable imaging modality in modern diagnostic radiology due to its ability to provide high-resolution cross-sectional images with excellent anatomical detail. It is widely utilized in the diagnosis and management of a broad spectrum of clinical conditions, including trauma, cancer, cardiovascular diseases, and neurological disorders. In particular, head CT examinations play a critical role in the rapid assessment of conditions such as traumatic brain injury, stroke, and intracranial hemorrhage. Despite these advantages, CT contributes significantly to patient exposure to ionizing radiation and represents one of the largest sources of medical radiation dose world wide .
The radiation dose associated with CT examinations is considerably higher than that of conventional radiographic procedures due to the use of multiple projections and higher tube current settings required to achieve optimal image quality. Patient dose in CT is commonly quantified using dosimetric parameters such as skin dose, volume computed tomography dose index (CTDIvol), weighted CT dose index (CTDIw), and dose length product (DLP). These parameters provide a practical basis for estimating the effective dose, which reflects the overall stochastic risk associated with radiation exposure . Although deterministic effects are unlikely at diagnostic dose levels, stochastic effects such as radiation-induced cancer remain a concern, particularly with repeated CT examinations.
To minimize radiation risks while maintaining diagnostic image quality, international radiation protection bodies have emphasized the principles of justification and optimization, with optimization guided by the As Low As Reasonably Achievable (ALARA) principle. A key tool for dose optimization is the establishment of Diagnostic Reference Levels (DRLs), which serve as benchmarks for typical radiation doses in standard imaging procedures. DRLs are typically defined at the 75th percentile of dose distributions and are used to identify unusually high radiation doses that may require corrective action . Regular dose audits and inter-institutional comparisons are essential for ensuring compliance with these guidelines and improving radiation protection practices.
In Nigeria, the use of CT imaging has increased steadily in recent years, particularly in urban centers and tertiary healthcare facilities. However, there remains limited data on patient radiation dose and the implementation of locally relevant DRLs. Previous studies have reported significant inter-facility variations in CT dose, often attributed to differences in scanning protocols, equipment performance, and operator experience . Given these challenges, there is a need for comprehensive dose assessments that incorporate both direct measurements, such as those obtained using Optically Stimulated Luminescence Dosimeters (OSLD), and scanner-reported dose indices. This study therefore aims to evaluate patient radiation dose during general and head CT examinations in selected diagnostic centers in Nigeria, with the objective of assessing current practices, identifying variability, and contributing to the establishment of local diagnostic reference levels for improved patient radiation protection.
2. Materials and Methods
2.1. Study Design and Setting
This study employed a combined retrospective and prospective descriptive design to assess patient radiation dose during computed tomography (CT) examinations in selected diagnostic centers in Nigeria. The study was conducted across three diagnostic centers, designated as Centers A, B, and C. The retrospective component evaluated patient skin dose during general CT examinations, while the prospective component focused on dose assessment during routine adult head CT examinations. All participating CT facilities were equipped with multi-slice CT scanners that had undergone routine quality control and certification by the Nigerian Nuclear Regulatory Authority (NNRA).
2.2. Study Population and Sampling
A total of 90 adult patients were included in the study. The retrospective arm consisted of 30 patients (10 per center) who had previously undergone general CT examinations with complete dose records. The prospective arm involved 60 patients (20 per center) undergoing routine head CT examinations between April 2024 and April 2025.
To ensure uniformity and comparability, only adult patients within the standard reference weight range of 70 ± 3 kg were included in the head CT study, in accordance with international recommendations. Both male and female patients were considered. Patients undergoing specialized CT procedures such as angiography, perfusion imaging, or interventional CT were excluded. Additionally, patients with incomplete dose information were not included in the analysis.
2.3. Dosimetry and Dose Measurement
Patient radiation dose was assessed using Optically Stimulated Luminescence Dosimeters (OSLD) for direct measurement of skin dose during general CT examinations. The OSLD were placed on the patient’s body surface at the region of interest prior to scanning and were read post-exposure using a calibrated OSLD reader. The dosimeters were selected due to their high sensitivity, reusability, and suitability for low-dose radiation measurements.
For head CT examinations, dose metrics were obtained directly from the CT scanner console. These included: Volume Computed Tomography Dose Index (CTDIvol) and Weighted Computed Tomography Dose Index (CTDIw), and Dose Length Product (DLP). These parameters are standardized indicators of radiation output and are routinely displayed by modern CT systems.
2.4. Data Collection
Data collection was carried out systematically for both the retrospective (general CT) and prospective (head CT) components of the study using structured data recording sheets. The process involved the collection of patient demographic information, scan parameters, and radiation dose metrics from the participating diagnostic centers (Centers A, B, and C).
For the retrospective component (general CT examinations), relevant data were obtained from existing patient records and dose reports. In addition, Optically Stimulated Luminescence Dosimeters (OSLD) were used to measure skin dose. The OSLD were carefully positioned on the patient’s skin at the anatomical region of interest prior to CT scanning. After exposure, the dosimeters were retrieved and analyzed using a calibrated OSLD reader to determine the absorbed dose in milligray (mGy).
For the prospective component (head CT examinations), data were collected in real time during each patient’s scan. Patient demographic information, including age, sex, and body weight, was recorded to ensure compliance with the standard reference range (70 ± 3 kg). Scan parameters such as tube voltage (kVp), tube current-time product (mAs), pitch, scan length, and scan time were documented. Radiation dose indices, including CTDIvol, CTDIw, and Dose Length Product (DLP), were obtained directly from the CT scanner console immediately after each examination.
All data collection procedures were conducted by the principal investigator with the assistance of a qualified CT radiographer and a medical physicist to ensure accuracy, consistency, and adherence to standard operating procedures. Collected data were verified for completeness and accuracy before being entered into a Microsoft Excel spreadsheet for subsequent analysis.
2.5. Dose Calculations
Radiation dose calculations were performed to quantify patient exposure during both general CT and head CT examinations using standard dosimetric relationships. The calculations included determination of mean skin dose, dose range, standard deviation, dose length product (DLP), and effective dose.
2.5.1. Mean Skin Dose
The mean skin dose for each diagnostic center was calculated from individual patient measurements obtained using Optically Stimulated Luminescence Dosimeters (OSLD). The mean value provides an estimate of the average radiation dose delivered to patients during general CT examinations.
D̅=1ni=1nDi(1)
where D̅ is the mean skin dose, Di represents individual dose measurements, and n is the total number of patients.
2.5.2. Dose Range and Standard Deviation
The dose range (R) was calculated as the difference between the maximum and minimum recorded skin doses for each center:
R=Dmax-Dmin(2)
The standard deviation (SD) was computed to assess the variability of dose distribution among patients within each center.
2.5.3 Effective Dose Estimation
The effective dose for general CT examinations was estimated using a standard conversion factor that relates skin dose to overall radiation risk:
E=k×D̅(3)
where E is the effective dose in millisieverts (mSv), D̅ is the mean skin dose (mGy), and k=0.015 mSv/mGy is the conversion coefficient for body CT examinations.
2.5.4 Dose Length Product
For head CT examinations, the Dose Length Product (DLP) was calculated using the relationship:
DLP=CTDIvol×L(4)
where CTDIvol is the volume computed tomography dose index (mGy) and L is the scan length (cm). DLP represents the total radiation output over the scanned volume.
2.5.5. Effective Dose Estimation (Head CT)
The effective dose for head CT examinations was derived from DLP using a region-specific conversion coefficient:
E=DLP×k(5)
where E is the effective dose (mSv), DLP is the dose length product (mGy·cm), and k is the conversion factor for the head region (mSv/mGy·cm), as recommended by international guidelines.
2.6. Establishment of Diagnostic Reference Levels (DRLs)
Diagnostic Reference Levels (DRLs) were established in this study as a practical tool for dose optimization and quality assurance in computed tomography (CT) examinations. The DRLs were derived from the dose distribution data obtained across the three diagnostic centers (A, B, and C) for head CT examinations. Specifically, the third quartile (75th percentile) values of key dose metrics, including CTDIvol and Dose Length Product (DLP), were calculated for each center to represent typical upper reference levels for standard-sized adult patients. These values were not intended as dose limits but rather as investigational benchmarks to identify unusually high radiation doses that may indicate suboptimal scanning protocols or equipment settings. The derived DRLs were then compared with established international reference levels, such as those recommended by the European Commission and other radiation protection bodies, to assess compliance and variability across centers. This approach provided a basis for evaluating current CT practice, highlighting areas requiring optimization, and supporting the development of locally relevant DRLs to enhance patient radiation protection and standardize imaging protocols.
2.7. Ethical Considerations
Ethical approval for this study was obtained from the Institutional Review Boards (IRBs) of the participating diagnostic centers prior to data collection, and all procedures were conducted in accordance with the principles of the Declaration of Helsinki. For the retrospective component, patient data were retrieved from existing records and fully anonymized, with no personal identifiers recorded to ensure confidentiality. In the prospective component, informed consent was obtained from all participants after explaining the purpose of the study, the procedures involved, and the use of Optically Stimulated Luminescence Dosimeters (OSLD) for dose measurement. Participation was voluntary, and patients were assured that their decision would not affect their clinical care. All collected data were handled with strict confidentiality and used solely for research purposes, while the use of OSLDs did not interfere with routine clinical procedures or result in additional radiation exposure, thereby ensuring patient safety and privacy throughout the study.
3. Results and Discussion
This study presents a comprehensive evaluation of patient radiation dose from both general CT and head CT examinations across three diagnostic centers (A, B, and C). The findings demonstrate significant inter-center variability in radiation dose, reflecting differences in scanning protocols, operator practices, and optimization strategies.
3.1. General CT Dose Assessment
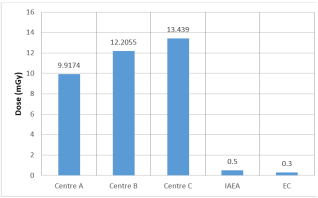
Skin dose measurements obtained using Optically Stimulated Luminescence Dosimeters (OSLDs) revealed mean values of 9.92 mGy, 12.21 mGy, and 13.44 mGy for Centers A, B, and C, respectively (Table 2 and Figure 1). The relatively lower mean dose observed in Center A suggests better optimization of scanning parameters, while the higher mean dose in Center C indicates a tendency toward consistently elevated exposure levels. Center B exhibited the highest variability (SD ≈ 9.2 mGy), suggesting inconsistent application of scanning protocols.
Table 1. Individual Skin Dose Measurements (mGy).

S/n

Center A

Center B

Center C

1

4.79

5.35

6.56

2

11.85

4.22

6.56

3

4.68

11.56

8.35

4

13.65

4.22

12.50

5

20.50

11.85

6.76

6

12.50

20.34

9.56

7

5.50

33.45

13.40

8

4.65

8.13

9.56

9

12.60

16.39

13.45

10

8.45

6.55

7.55

Table 2. Descriptive Statistics for Skin Dose.

Parameter

Center A

Center B

Center C

Minimum (mGy)

4.65

4.22

6.56

Maximum (mGy)

20.50

33.45

13.45

Mean (mGy)

9.92

12.21

13.44

Range (mGy)

15.85

29.23

6.89

Standard Deviation (mGy)

5.5

9.2

2.6

Figure 1. Comparison of Entrance skin dose with International reference Dose.
The results of comparison of mean of the Entrance surface Dose (ESD) obtained in the present work with some international reference dose values in (mGy) are presented in Figure 1: The mean entrance surface dose to the chest is higher than the corresponding mean 0.5mGy and 0.3 mGy recommended by IAEA and EC. The variations in ESD among the different radiological departments studied may be attributed to several factors: exposure parameters, radiological technique and accuracies of the (OSLD) dosimeters used. Also, the efficiency of the Tube voltage generator in the department. Several factors could have positively contributed to the results. Equipment performance can be a major factor as well.
Although direct comparison with literature is limited due to fewer studies reporting skin dose using OSLDs, similar variability trends have been reported in CT dose studies. Variations in patient dose are commonly attributed to differences in operator experience, selection of exposure parameters (mAs, kVp), and scan coverage .
The high variability observed in Center B aligns with findings from other studies, which emphasize that lack of standardized protocols can lead to inconsistent patient exposure even when similar CT systems are used. This reinforces the importance of protocol harmonization and staff training in dose optimization.
3.2. Head CT Dose Assessment
The mean CTDIvol values recorded in this study ranged from 47.83 mGy to 52.52 mGy. These values are consistent with internationally recommended diagnostic reference levels (approximately 50 mGy for adult head CT). However, slight exceedances observed in Centers A and B suggest the need for optimization (Table 3).
When compared with other studies, the results show good agreement. For example, a Nigerian study reported a mean CTDIvol of approximately 48 mGy for non-contrast head CT and 54 mGy for contrast studies . Similarly, another Nigerian study reported even higher 75th percentile CTDIvol values of up to 85 mGy, indicating that the values obtained in this study are relatively lower and closer to acceptable limits .
This study evaluated radiation dose parameters, including CTDIw, CTDIvol, DLP, and effective dose, across three diagnostic centers (A, B, and C) in order to assess compliance with established diagnostic reference levels (DRLs) and international optimization standards.
Table 3. CTDIv for Head CT Examination.

S/n

CTDIv for the Head

Centre A (mGy)

Centre B (mGy)

Centre C (mGy)

1

51.3

51.3

42.56

2

51.3

51.3

61.59

3

51.3

52.5

62.42

4

52.3

51.3

41.82

5

51.3

52.5

42.62

6

52.3

52.5

46.00

7

51.3

60.5

70.86

8

51.3

60.5

46.21

9

52.3

51.3

44.78

10

51.3

51.3

21.21

MEAN

51.60

53.50

48.01

MAX

52.30

60.50

70.86

MIN

51.30

51.30

21.21

Internationally, a recent study reported a DRL CTDIvol of 58.18 mGy for head CT examinations, which is slightly higher than the values observed in this study, further confirming that the dose levels reported here fall within acceptable global ranges .
3.3. Dose Length Product (DLP) Analysis
The mean DLP values ranged from 1080.71 mGy·cm to 1485.48 mGy·cm, with Centers A and B exceeding the commonly recommended international reference value of approximately 1050 mGy·cm (Table 4).
These findings are consistent with previous studies conducted in Nigeria and other developing regions. For instance, a Nigerian study reported mean DLP values of 874–1476 mGy·cm for head CT examinations, which closely aligns with the results of this study . Another study reported a 75th percentile DLP value of approximately 1437 mGy·cm, further confirming that the observed values fall within the upper range of reported doses .
Table 4. Dose Length Product for the Head.

S/N

Centre A (mGy.cm)

Centre B (mGy.cm)

Centre C (mGy.cm)

1

1066.9

1862.1

936.36

2

1759.4

1349.1

1577.88

3

1708.1

1932.5

1599.07

4

1597

14.37

1087.45

5

1092

1748.6

1193.28

6

1143.6

1879.9

1196.05

7

1374.7

1490.8

20.98

8

1656.8

1430.3

1109.12

9

1512.3

1041.3

985.25

10

1066.9

1836.4

426.85

MAEN

1.397.77

1.458.54

1013.23

MAX

1.759.40

1.932.50

1.599.07

MIN

1.066.90

14.37

20.98

In contrast, lower DLP values have been reported in developed countries. For example, a national survey in the United Arab Emirates reported DLP values as low as 695–820 mGy·cm for head CT examinations, reflecting more optimized protocols and advanced dose reduction technologies .
The higher DLP values observed in this study are primarily attributable to increased scan length and possible multiphase acquisitions, highlighting scan length as a major determinant of patient dose.
3.4. Effective Dose Comparison
The mean effective dose values obtained in this study ranged from 2.49 mSv to 3.17 mSv for head CT examinations. These values fall within the typical global range of 1–4 mSv reported in the literature for adult head CT (Table 5).
Comparatively, a Nigerian study reported effective dose values of approximately 1.8–3.1 mSv for head CT, which is consistent with the findings of this study . This suggests that despite variations in DLP, the overall radiation risk remains within acceptable limits.
However, the higher effective dose observed in Center A reflects the influence of increased scan length and protocol differences, emphasizing the importance of optimization strategies that focus not only on tube output but also on scan coverage.
Table 5. Effective Dose to the Head.

Effective Dose to the Head (mSv)

S/N

Centre A

Centre B

Centre C

1

4.28

2.15

2.15

2

3.10

3.63

3.63

3

4.44

3.68

3.68

4

0.03

2.50

2.50

5

4.02

2.74

2.74

6

4.32

2.75

2.75

7

3.43

0.05

0.05

8

3.29

2.55

2.55

9

2.39

2.27

2.27

10

4.22

0.98

0.98

MEAN

3.35

2.33

2.33

MAX

4.44

3.68

3.68

3.5. Diagnostic Reference Levels (DRLs)
The locally derived DRLs (75th percentile values) for CTDIvol (≈52–53 mGy) and DLP (≈1209–1795 mGy·cm) were higher than some international benchmarks but consistent with values reported in similar healthcare settings (Table 6).
Table 6. 75th Percentile of CTDIv and DLP for Head for Centre A, B and C 3rd Quartile Local diagnostic Reference level.

Body region CTDIv (mGy)

DLP (mGy.cm)

Head

Min. Value

Mean ± SD

Max. Value

3rdquartile

Min. Value

Mean ± SD

Max Value

3rdquartile

A

41.3

51.9±3.7

60.5

52.3

1015.70

1485.5±360.8

2125.80

1782.6

B

51.30

52.5±2.8

60.5

52.5

14.4

1376.3±547.7

1932.5

1794.9

C

21.1

47.8±10.6

70.9

52.7

20.9

1080.71±381.8

1762.6

1209.1

For instance, a recent study reported DRLs of 58.18 mGy (CTDIvol) and 1018 mGy·cm (DLP), which are slightly lower than the values obtained in this study . In contrast, studies conducted in Nigeria have reported even higher DRL values, with CTDIvol up to 85 mGy and DLP exceeding 1400 mGy·cm .
These comparisons indicate that while dose levels in this study are somewhat elevated relative to developed countries, they are consistent with regional trends and reflect the current stage of CT practice in developing healthcare systems.
4. Conclusion
This study provides a comprehensive assessment of patient radiation dose during both general and head computed tomography (CT) examinations in selected diagnostic centers in Nigeria, highlighting significant inter-center variability in dose levels and radiation protection practices. The findings showed that general CT dose variations were largely influenced by operator-dependent factors, while differences in head CT doses were primarily driven by scan length and protocol design. Although the measured CTDIvol and effective dose values were generally within internationally reported ranges, dose length product (DLP) and locally derived diagnostic reference levels (DRLs) exceeded some global benchmarks, indicating the need for further optimization. The use of Optically Stimulated Luminescence Dosimeters (OSLD) provided reliable direct dose measurements, enhancing the accuracy of the assessment. Overall, the study underscores the importance of standardized scanning protocols, routine dose monitoring, establishment of local DRLs, and continuous staff training, as well as strict adherence to the ALARA principle to minimize patient radiation exposure while maintaining diagnostic image quality.
Abbreviations

OSLD

Optically Stimulated Dosimeter

CT

Computed Tomography

DRLs

Diagnostic Reference Levels

CTDIv

Represents the Volume Computed Tomography Dose Index

DLP

Dose Length Product

ALARA

As Low As Reasonably Achievable

ICRP

The International Commission on Radio-logical Protection

UNSCEAR

United Nations Scientific Committee on the Effects of Atomic Radiation

Conflicts of Interest
The authors declare no conflicts of interest.
References
[1] Kalender WA. Computed Tomography: Fundamentals, System Technology, Image Quality, Applications. 3rd ed. Erlangen: Publicis Publishing; 2011.
[2] Abuzaid, M. M., Elzain, M. E., Aljubairy, A. A., Alshamrani, K. M., & Alshamrani, G. M. (2020). Establishment of diagnostic reference levels for computed tomography examinations in the United Arab Emirates. Insights into Imaging, 11(1), 1–10.
[3] Adejoh, T., & Nzotta, C. C. (2016). Head computed tomography: Dose output and optimization in a Nigerian tertiary hospital. West African Journal of Radiology, 23(2), 87–93.
[4] Adejoh, T., Umar, I. M., & Yusuf, M. A. (2022). Assessment of patient radiation dose from computed tomography examinations in selected Nigerian hospitals. Radiation Protection Dosimetry, 198(3), 245–253.
[5] Al Suwaidi, J. S., Al Naemi, H., Al Kuwari, H., & Al Kaabi, M. (2024). Establishment of diagnostic reference levels for computed tomography examinations in Qatar. Biomedicines, 12(11), 2446.
[6] Bernner,,D.J.,& Hall, E.J.(2007).Computed Tomography an increasing source of Radiation Exposure. New England Journal of Medicine, 357(22), 2277–2284.
[7] Tomography (EUR 16262 EN). Office for Official Publications of the European Communities. International Commission on Radiological Protection (ICRP). (2007). The 2007 recommendations of the International Commission on Radiological Protection (ICRP Publication 103).
[8] International Commission on Radiological Protection (ICRP). (2017). Diagnostic reference levels in medical imaging (ICRP Publication 135).
[9] McCollough, C. H., & Schueler, B. A. (2000). Calculation of effective dose. Medical Physics, 27(5), 828–837.
[10] Ngaram, N., & Mohammed, I. M. (2019). Assessment of radiation dose from computed tomography examinations in northern Nigeria. International Journal of Medical Physics, Clinical Engineering and Radiation Oncology, 8(4), 375–385.
[11] Sadiq, A. A., Musa, B. G., & Garba, I. (2020). Evaluation of radiation doses from CT examinations in northern Nigeria. Journal of Radiological Protection, 40(4), 1023–1035.
[12] United Nations Scientific Committee on the Effects of Atomic Radiation (UNSCEAR). (2021). Sources, effects and risks of ionizing radiation. United Nations.
[13] European Commission. European Guidelines on Quality Criteria for Computed Tomography. EUR 16262 EN. Luxembourg; 1999.
Cite This Article
  • APA Style

    Yemisi, I., Okafor, T. H., Pada, I., Samson, O. O., Abdul-Jamiu, A., et al. (2026). Optimization of Patient Radiation Protection and Dose Levels in Some Nigerian CT Facilities Using OSL Dosimetry. American Journal of Physics and Applications, 14(3), 32-39. https://doi.org/10.11648/j.ajpa.20261403.11

    Copy | Download

    ACS Style

    Yemisi, I.; Okafor, T. H.; Pada, I.; Samson, O. O.; Abdul-Jamiu, A., et al. Optimization of Patient Radiation Protection and Dose Levels in Some Nigerian CT Facilities Using OSL Dosimetry. Am. J. Phys. Appl. 2026, 14(3), 32-39. doi: 10.11648/j.ajpa.20261403.11

    Copy | Download

    AMA Style

    Yemisi I, Okafor TH, Pada I, Samson OO, Abdul-Jamiu A, et al. Optimization of Patient Radiation Protection and Dose Levels in Some Nigerian CT Facilities Using OSL Dosimetry. Am J Phys Appl. 2026;14(3):32-39. doi: 10.11648/j.ajpa.20261403.11

    Copy | Download

  • @article{10.11648/j.ajpa.20261403.11,
      author = {Ilupeju Yemisi and Tobenna Henry Okafor and Isaac Pada and Odeleye Olagoke Samson and Aribisala Abdul-Jamiu and Sunday Habila Sarki},
      title = {Optimization of Patient Radiation Protection and Dose Levels in Some Nigerian CT Facilities Using OSL Dosimetry},
      journal = {American Journal of Physics and Applications},
      volume = {14},
      number = {3},
      pages = {32-39},
      doi = {10.11648/j.ajpa.20261403.11},
      url = {https://doi.org/10.11648/j.ajpa.20261403.11},
      eprint = {https://article.sciencepublishinggroup.com/pdf/10.11648.j.ajpa.20261403.11},
      abstract = {The increasing use of computed tomography (CT) in medical imaging has raised concerns regarding patient exposure to ionizing radiation, necessitating continuous evaluation of dose levels and optimization practices. This study presents a combined assessment of patient radiation dose and protection parameters during general and head CT examinations in selected diagnostic centers in Nigeria, utilizing Optically Stimulated Luminescence Dosimeters (OSLDs) for direct dose measurement. A retrospective analysis of 30 patients was conducted to evaluate skin dose during general CT examinations across three centers (A, B, and C), while a prospective study of 60 adult patients assessed head CT dose indices, including CTDIvol, CTDIw, dose length product (DLP), and effective dose. The mean skin doses for general CT were 9.92 mGy, 12.21 mGy, and 13.44 mGy for Centers A, B, and C respectively, corresponding to estimated effective doses of 0.15 mSv, 0.18 mSv, and 0.20 mSv. For head CT examinations, mean CTDIvol values ranged from 47.83 to 52.52 mGy, while mean DLP values varied from 1080.71 to 1485.48 mGy·cm, with effective doses between 2.49 and 3.17 mSv. Significant inter-center variations were observed, with general CT dose variability largely attributed to operator-dependent factors, whereas differences in head CT doses were primarily influenced by scan length and protocol implementation. Third-quartile values were used to establish local diagnostic reference levels (DRLs), which were higher than some international benchmarks but consistent with findings from similar healthcare settings. The study highlights the need for standardized CT protocols, routine dose monitoring, and strict adherence to the ALARA principle to enhance patient radiation protection while maintaining diagnostic image quality.},
     year = {2026}
    }
    

    Copy | Download

  • TY  - JOUR
    T1  - Optimization of Patient Radiation Protection and Dose Levels in Some Nigerian CT Facilities Using OSL Dosimetry
    AU  - Ilupeju Yemisi
    AU  - Tobenna Henry Okafor
    AU  - Isaac Pada
    AU  - Odeleye Olagoke Samson
    AU  - Aribisala Abdul-Jamiu
    AU  - Sunday Habila Sarki
    Y1  - 2026/05/26
    PY  - 2026
    N1  - https://doi.org/10.11648/j.ajpa.20261403.11
    DO  - 10.11648/j.ajpa.20261403.11
    T2  - American Journal of Physics and Applications
    JF  - American Journal of Physics and Applications
    JO  - American Journal of Physics and Applications
    SP  - 32
    EP  - 39
    PB  - Science Publishing Group
    SN  - 2330-4308
    UR  - https://doi.org/10.11648/j.ajpa.20261403.11
    AB  - The increasing use of computed tomography (CT) in medical imaging has raised concerns regarding patient exposure to ionizing radiation, necessitating continuous evaluation of dose levels and optimization practices. This study presents a combined assessment of patient radiation dose and protection parameters during general and head CT examinations in selected diagnostic centers in Nigeria, utilizing Optically Stimulated Luminescence Dosimeters (OSLDs) for direct dose measurement. A retrospective analysis of 30 patients was conducted to evaluate skin dose during general CT examinations across three centers (A, B, and C), while a prospective study of 60 adult patients assessed head CT dose indices, including CTDIvol, CTDIw, dose length product (DLP), and effective dose. The mean skin doses for general CT were 9.92 mGy, 12.21 mGy, and 13.44 mGy for Centers A, B, and C respectively, corresponding to estimated effective doses of 0.15 mSv, 0.18 mSv, and 0.20 mSv. For head CT examinations, mean CTDIvol values ranged from 47.83 to 52.52 mGy, while mean DLP values varied from 1080.71 to 1485.48 mGy·cm, with effective doses between 2.49 and 3.17 mSv. Significant inter-center variations were observed, with general CT dose variability largely attributed to operator-dependent factors, whereas differences in head CT doses were primarily influenced by scan length and protocol implementation. Third-quartile values were used to establish local diagnostic reference levels (DRLs), which were higher than some international benchmarks but consistent with findings from similar healthcare settings. The study highlights the need for standardized CT protocols, routine dose monitoring, and strict adherence to the ALARA principle to enhance patient radiation protection while maintaining diagnostic image quality.
    VL  - 14
    IS  - 3
    ER  - 

    Copy | Download

Author Information
  • Abstract
  • Keywords
  • Document Sections

    1. 1. Introduction
    2. 2. Materials and Methods
    3. 3. Results and Discussion
    4. 4. Conclusion
    Show Full Outline
  • Abbreviations
  • Conflicts of Interest
  • References
  • Cite This Article
  • Author Information