Research Article | | Peer-Reviewed

Interpretation of Aeromagnetic Data to Assess Structures and Solid Mineral Potentials at Kataeregi and Its Environ, Niger State, Nigeria

Received: 25 May 2026     Accepted: 5 June 2026     Published: 15 October 2026
Views:       Downloads:
Abstract

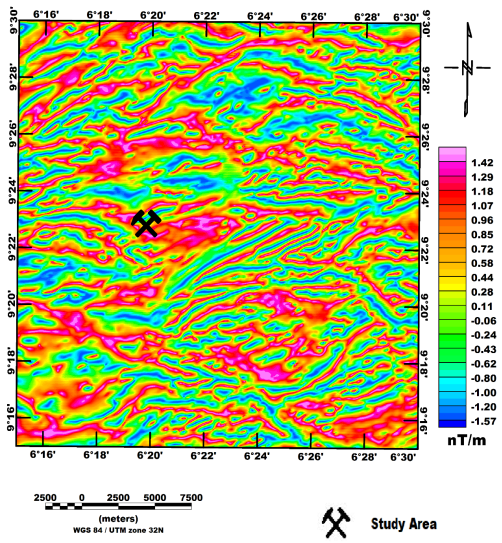
The objective of the study are to delineate structurally controlled mineralisation zone in the study area and map out subsurface structures below the ground surface that play host to minerals (fractured zones, fault lines and lithologic contact). The mineralisation potential of Kataeregi (Latitudes 09º21ꞌN and 09º25ꞌN and Longitudes 006º17ꞌE and 006º22ꞌE) and its environs have been investigated using aeromagnetic data. Aeromagnetic data acquired from Nigeria Geological Survey Agency was used to analyse and interpret the magnetic signatures using different filters. The 3-DEuler deconvolution map locate and estimate the depth to various anomalous bodies with depth to source body between 30 m and 428.5 m. The results revealed lineaments trending majorly in NE-SW directions. The FVD anomaly map established the oval and linear shapes anomalies with values between -5.78 to 0.34 nT/m, the ASA amplitude map reveals wide range of values between 0.03 to 0.76 nT/m, the TDR map showed variations in anomalies with values ranging from -0.06 to 1.42 rad/m. The unveiled subsurface structural features are responsible for hosting mineralised deposits. The highlighted lineament represents the short wavelength magnetic anomalies which cut across the migmatite gneiss and amphibolites schist of the study area. The depth was estimated using a window size of 2550 m width and a maximum depth tolerance of 14%. Generally, these suggested that these lineaments reflect real continuous fault/fractures in depth.

Published in American Journal of Physics and Applications (Volume 14, Issue 4)
DOI 10.11648/j.ajpa.20261404.12
Page(s) 68-82
Creative Commons

This is an Open Access article, distributed under the terms of the Creative Commons Attribution 4.0 International License (http://creativecommons.org/licenses/by/4.0/), which permits unrestricted use, distribution and reproduction in any medium or format, provided the original work is properly cited.

Copyright

Copyright © The Author(s), 2026. Published by Science Publishing Group

Keywords

Kataeregi, Magnetic Data, Fractures, Folds, Faults and Lineaments

1. Introduction
The recent priority given to the diversification of the Nigerian economy, the development of the solid mineral sector has become very active. The focus on how to locate and develop metalliferous deposits in the country has taken a centre stage. Gold deposit is by far the most important exploration target in the schist belts of Nigeria and contains world class potential gold reserves. Structural and hydrothermal alterations, which are critically important in controlling gold mineralization throughout the schist belts can be mapped out using geophysical methods . Lithologic units, lithologic boundaries, fractures and mineral accumulations are more accurately identified and delineated using the combination of surface geological mapping, geophysical data, and geochemical data on subsurface samples. Recent improvement in the analysis of geophysical data and enhancement transforms, have increased geophysical dataset resolution, so that very insidious changes in responses can be seen .
Geological and geophysical interpretation of the area will be done to gain insight into the structural setting, lithological contacts and possible alteration zones as well as identify prospective structurally controlled mineralisation of the area. Primarily, mineralisation in Nigeria is mostly lithologically and structurally controlled. Structures include faults, shear zones (lineament), pegmatites, quartz and quartzite veins. The methodology for the research is to capture the general trends of surface and subsurface structures which control primary gold mineralization in the area. The exercise comprises surface geological mapping, lithologic and structural analysis of geophysical and geochemical data . Magnetic minerals present in soils may either be inherited from the parent rocks (lithogenic origin) formed during pedogenesis (pedogenic origin) or may stem from anthropogenic activities (secondary ferromagnetic materials). Hematite and magnetite are common minerals that occur as primary and secondary minerals in soil and provide a major sink for pollutants such as heavy metals in soils. They have been known as major minerals contributing to the magnetic susceptibility of a soil . In the light of the current challenges in improving economic base of the country, there is a need to derive detailed information on the extent, the trend and depth to structures (e.g., dykes, shear or fracture/fault zones) that might be controlling emplacement of mineral deposits in the area. Regional features are of fundamental importance in selection of targets for mineral exploration, while localize features such as contact and shear zones are responsible for the localisation of the mineral deposits . These geologic features could be either directly observed or interpreted from data sets such as aeromagnetic and Landsat imageries.
2. Description of the Study Area
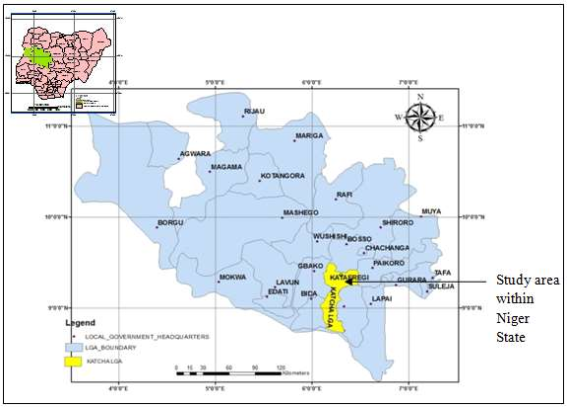
The study area (Kataeregi) Figure 1 is located 39 km along Minna – Bida road, in Katcha Local Government Area of Niger State, North-central Nigeria. The area is part of Bida Sheet 184 NE and is located between Latitudes 09º21ꞌN and 09º25ꞌN and Longitudes 006º17ꞌE and 006º22ꞌE. It lies between the geographical co-ordinates of Northing’s 1038000 – 1037700 mN and Easthing’s 206030 – 206455 mE in the Universal Traverse Mercator (UTM) Minna Zone 31.
Figure 1. Location map of Kataeregi, Niger State, Nigeria .
3. Geology of the Study Area
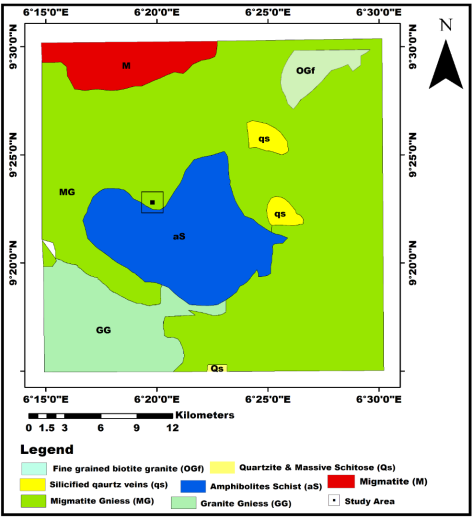
The area consists of mixed geology of both basement and sedimentary rocks. The rocks units consist of schists, migmatites, gneisses, granites, quartzite of Precambrian age (> 550 million years old) . The area is dominated by schistose rocks that serves as host to auriferous quartz vein where the mining is taking place (Figure 2). The schists are intercalated with amphibolites observable along the River Chanchaga, the schists had already been mapped and considered as part of the Kusharki Schists. The schists are intruded by plutonic rock and exposed at sabon Eregi and Kataeregi with xenoliths of phyllites. The study area is dominated by migmatites-gneisses complex and granites at the North and South-eastern parts and Bida sandstone to the extreme South-western part . The sedimentary terrain falls within the Bida Basin of central Nigeria and covers the central and southern part of the state. The rocks of the basin comprise of conglomerates, sandstones, siltstones, mudstones and ironstones .
Figure 2. Geological map of the study area.
4. Review of Geophysical Methods
Adebiyi et al. uses structural interpretation of magnetic and satellite remotely sensed data of Osun State, Southwestern, Nigeria The magnetic lineament map reveals that the structural trend in the area is dominant by NE-SW and NNE-SSW. These structural trends were found to be consistent with the regional tectonics of the Southwest Basement of Nigeria. The NE-SW is the most conspicuous structural trend in the study area.
Tawey et al. utilises application of aeromagnetic data to assess the structures and solid mineral potentials in part of north central Nigeria. The result indicates that lineaments mapped trending in the ENE-WSW followed by WNW-ESE with some NE-SW, NNE-SSW and NNW-SSE trends. The second vertical derivative (SVD) map also helped in delineating structures and possible mineralization zones that are pronounced within the study area, around high analytic signal zones. Delineated possible and favorable mineralisation zones from second vertical derivative map correlate with portion of the study area with rocks showing high analytic signal amplitude suggesting the rocks to be of later magmatic intrusions where mineralisation fluids solidify within the host rocks.
Ejepu et al. used integrated geosciences prospecting for gold mineralization in Kwakuti, North-Central Nigeria, it was observed that schist occupies moderate to low elevation areas and they display high magnetic field intensity values. The migmatites are dotted with quartz veins which constitute the gold mineralisation zone. Gold concentration distribution pattern in the area is skewed NE-SW, thereby suggesting that the NE-SE structures control the mineralization. Mining activities will be more efficient if directed along the NE-SW structurally trend.
Olomo et al. applied integrated approach involving aeromagnetic and land sat for delineating structures and its implication on mineralisation Enhancement of the magnetic anomalies observed from the interpreted magnetic anomaly map involved the use of reduction to equator, wavelength, upward continuation and derivative filters. The 3-D Euler deconvolution and radial spectral analysis were applied to locate and estimate the depth to various anomalous bodies, with depth to source body between 50 m and 500 m. The processed images revealed lineaments trending majorly in NE-SW directions diagnostic of primary structures of potential targets for mineralisation in the area. Generally, coincidence of both Landsat and aeromagnetic lineaments trends were observed in the study area, which suggested that these lineaments reflect real continuous fault/fractures in depth.
5. Material and Method
High resolution magnetic data was acquired from the Nigerian Geological Survey Agency. The data were processed to the following:
1) Production of total magnetic intensity (TMI)
2) The total magnetic intensity (TMI) anomalies were subjected to reduction to equator (RTE) to subdue the effect of the low latitude region.
3) The RTE anomalies structural lineaments were extracted using Centre for exploration targeting (CET)
4) The Rose diagram which reveals the trends dissecting the study area was determined.
5) The reduced to equator anomaly data was subjected to the first vertical derivative, analytical signal and tilt derivative to enhance the near-surface using oasis montaj.
6) The depths to the concealed structures were estimated using 3-D Euler deconvolution technique.
6. Theories of the Adopted Magnetic Interpretation Methods
6.1. Reduction to Equator (RTE)
The Reduction to magnetic equator (RTE) is a filter that is usually applied to the TMI anomalies in order to centre structures and anomalous bodies over their respective causative positions.
The RTE filter depend on the inclination and declination of the body’s magnetisation of the local earth’s field and orientation of the body with respect to the magnetic north . The RTE is governed by the equation below ;
(1)
If
If , Ia= I(2)
Where is the reduction to equator (RTE), I is the geomagnetic inclination, is the inclination for amplitude correction and D is the geomagnetic declination.
6.2. First Vertical Derivative (FVD) Map
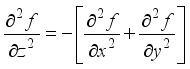
The first vertical derivative (FVD) is applied to the reduced to pole anomaly data. The FVD allows the vertical imaging of the shallow causative structures. This is the FVD refines the effect of high frequency (short wavelength) magnetic features at the expense of the short frequency (long wavelength). It also enhances the textural variation in the data and hence helps to visualised subsurface structural features such as folds, faults, fracture and contact zones which could not be depicted clearly from the reduced to pole map. The FVD computes the high frequency anomalies using the Laplace transformation expressions as thus;
∇2𝑓=0(3)
where ∇2𝑓 is the Laplace transform which can be expressed in full as;
(4)
𝜕𝑧, 𝜕𝑦 𝑎𝑛𝑑 𝜕𝑥 are the differentials in z, y and x coordinate.
Then nth vertical derivative can be computed once the Fourier transformation is known by using the equation (5).
(5)
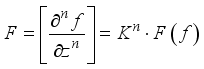
where F is the Fourier representation of the field, K is the wave number or frequency and f is the input to be filtered . As such, the n is taken as one (1) for the first vertical derivative filter.
6.3. Centre for Exploration Targeting (CET) Structural Lineaments
The CET plugin on the Oasis montaj software identifies and enhances linear geologic structures on from a potential field data . This technique was applied to the RTE grid using the following steps;
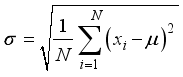
(a). The textural analysis which involves the calculation of the standard deviation in order to determine the magnetic discontinuities and complex textures zones. The standard deviation works based on the equation as thus; For a window containing N cells, whose mean value is μ, the standard deviation σ of the cell values xi is given as;
(6)
(b). The created standard deviation grid was subjected to the lineation and vectorisation transformation to producing the structural complexity map of the study area.
7. Estimation of Depths to the Concealed Structures
The 3-D Euler deconvolution method is also independent of the direction of source magnetization, which makes it deem fit for low-latitude region. The 3-D Euler deconvolution technique detect the subsurface structural features as well as estimate their respective depths. It makes use of the x, y, and z derivatives of the TFA anomaly data to determine the depth and boundaries of different geologic model of interest using a structural index (N). For example; N = 0 for geologic contact, N = 1 for thin dyke or sill, N = 2 for horizontal or vertical cylinder and N = 3 for magnetic sphere or dipole . The structural index of one (1) for thin dykes or sills was used. The 3-D Euler deconvolution is based on the Euler’s homogeneity equation given as:
x-x0∂F∂x+y-y0∂F∂y+z-z0∂F∂z=N(B-F)(7)
Where, x0, y0 and z0 are the position or coordinate of the magnetic source, (x, y, z) are the location of the field measurement, F is the total field value, B is the regional value of the total field and N is the degree of homogeneity is also referred to as structural index . The 3-D Euler deconvolution map of the study area was produced using 6000 m width window size and a maximum depth tolerance of 50%.
8. Results and Discussion
8.1. Results of Aeromagnetic Data
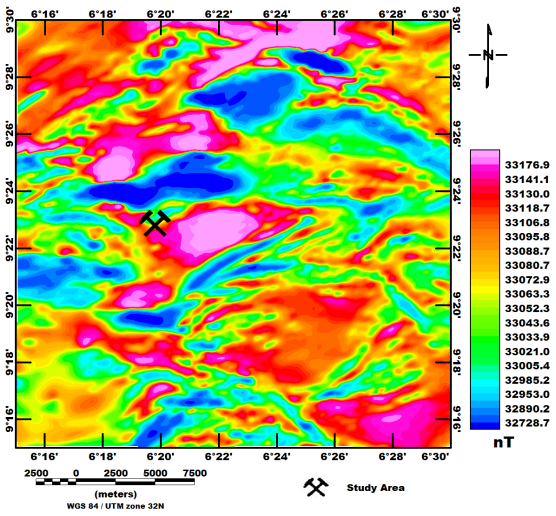
Figure 3 represent the total magnetic intensity (TMI) map of Kataeregi mining site. The TMI map was formed by adding a constant value of 33000 nT to the field anomaly data. The analysis of the TMI data were used to delineate the geologic structures that are concealed within the study area.
8.2. Interpretation of Total Magnetic Intensity (TMI) Anomaly Map
In general, the northern, mid and southeastern parts (Figure 3) of Kataeregi mining site are characterised by high magnetic intensities denoted in red to pink colours with values between 331168.7 and 33176.9 nT respectively. The regions of moderate magnetic intensities (green to yellow colours) had values between 33005.4 and 33072.9 nT. The areas characterised by low magnetic intensities (blue to magenta colours) had values between 32728.2 and 32985.2 nT. However, the present study area (Kataeregi) marked by mine symbol falls within the moderate to high magnetic intensity zones. The TMI map was spatially correlated with the geologic map of the study area (Figure 2). It was observed that two major lithologic units namely; Migmatite gneiss and amphibolites schist were observed in the northern and southern part of the study area respectively. Migmatite gneiss and amphibolites schist usually have high and low magnetic intensities respectively. The study area falls within the low latitude region there is therefore the need to place the magnetic sources anomalies directly above the causative sources . This can be achieved by subjecting the total magnetic intensity anomaly data to reduction to equator (RTE), for easier interpretation and understanding.
Figure 3. Airborne total magnetic intensity anomalies map of the study area.
8.3. Interpretation of the Reduced to Equator (RTE) Anomaly Map
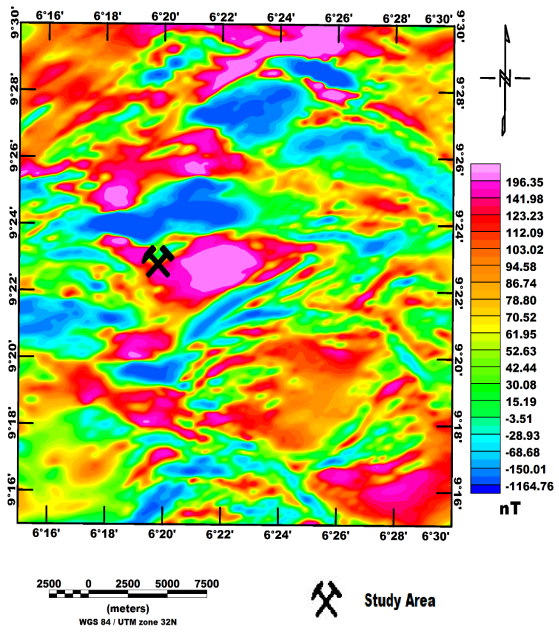
The TMI anomalies (Figure 3) were reduced to equator in a bid to subdue the effects of the low latitude region. It is important to note that, at low latitude with which the study area falls into. There is decrease in the magnetic field intensity which causes local magnetic bodies to have lower magnitude than those produced by an identical structure at high latitude . As such, the reduced to equator anomaly map (Figure 4) represents a well-positioned magnetic anomalies directly above their respective sources. In contrast, there is a slight shift in the position of the magnetic anomalies in TMI map (Figure 3) and the reduced to equator map (Figure 4). It is worth knowing that the area of interest Kataeregi denoted by black mining symbol, is bounded relatively low (yellow to green) to high magnetic (red to pink colours) intensity anomalies north to south. The relatively low to high magnetic intensity anomalies coincide with migmatite gneiss and amphibolites schist respectively.
Figure 4. Reduced to equator (RTE) anomaly map derived from TMI data.
8.4. Interpretation of the Reduce to Equator (RTE) Structural Lineaments Map
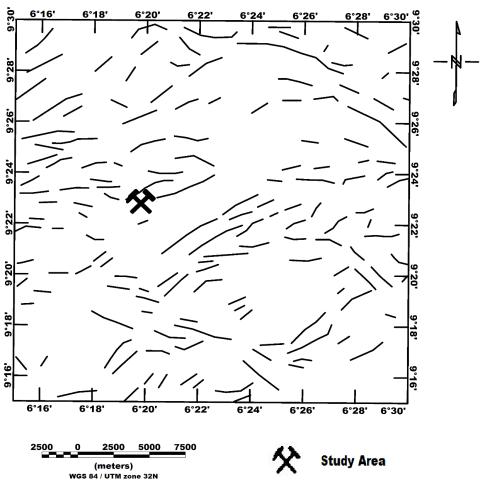
The RTE structural lineaments map (Figure 5) denotes the subsurface structural features such as; faults, folds, fractures and shear zones which are concealed in and around the study area. The subsurface structural features were automatically extracted and produce for better pictorial view in contrast to the TMI and RTE figures 3 and 4 maps respectively. The unveiled subsurface structural features (lineaments) are possibly responsible for hosting mineralised deposits . The study area (Kataeregi mining site) is dissected by series of trending lineaments (ENE-WSW, NNE-SSW and ESE-WNW). The highlighted lineament represents the short wavelength magnetic anomalies which cut across the migmatite gneiss and amphibolites schist of the study area.
Figure 5. Subsurface structural lineaments map derived from the RTE data.
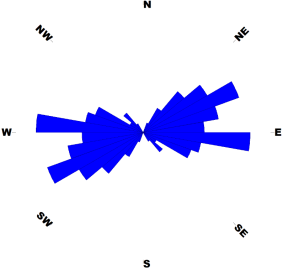
In addition, the Rose diagram (Figure 6) of the reduced to equator, reveals the lineaments predominantly trending in the ENE-WSW directions. However, the observed ENE–WSW trends could be due faults of Eburnean 2000 Ma event of deformation . The NNE-SSW trends on the other hand are attributed to the Pan-African 600 Ma orogenic event of deformation . Meanwhile, the ENE-WSW, NNE-SSW and ESE-WNW obtained from this study correlated with most of the NNE-SSW trends that host mineralised deposits in accordance with .
Figure 6. Rose diagram derived from reduced to pole lineaments of the study area.
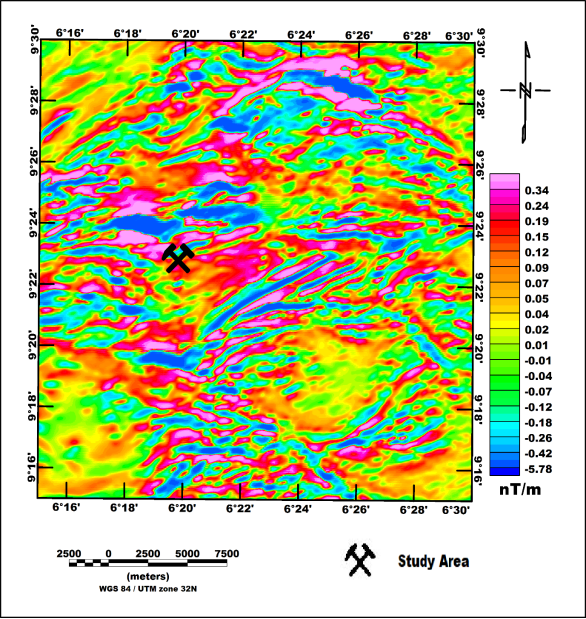
8.5. Interpretation of the Reduced to Equator First Vertical Derivative (FVD) Maps
The visual inspection of the FVD map (Figure 7) reveals negative and positive FVD anomalies of different amplitudes. This map reveals both (positive and negative) anomalies. Evidently, the study area falls within the low to high negative FVD anomalies in yellow to pink colours with values between -5.78 and 0.34 nT/m. The low to high negative FVD anomalies over the study area coincided with the relatively low RTE anomalies (Figure 4).
Figure 7. First vertical derivative map derived from the RTE data.
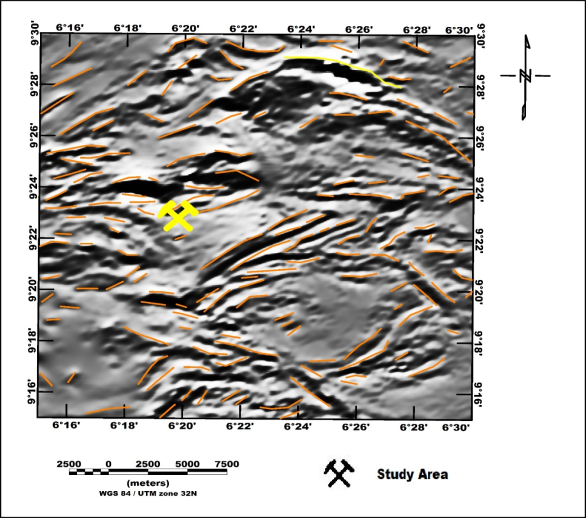
The FVD map (Figure 7) enhanced the visibility of the short wavelength anomalies such as; faults, folds, shear zones among others, which were veiled up by the long wavelength anomalies in contrast to the RTE map (Figures 4). In a bid to examine the structural geologic features, the FVD anomalies were transformed into grayscale colour to have an enhanced view of the subsurface lineaments. The grayscale colour map (Figure 8) of the FVD unveils the distribution of the various oval and elongated subsurface structural features. These structural features can be observed in bright white colour segments over the entire map. Interestingly, part of this bright white colour (lineament) cut across the study area. The RTE lineaments (Figure 5) were superimposed on the FVD grayscale map and a good correlation was observed. Thus, implying that the adopted methods complimented each other.
Figure 8. Grayscale first vertical derivative map derived from RTE anomalies.
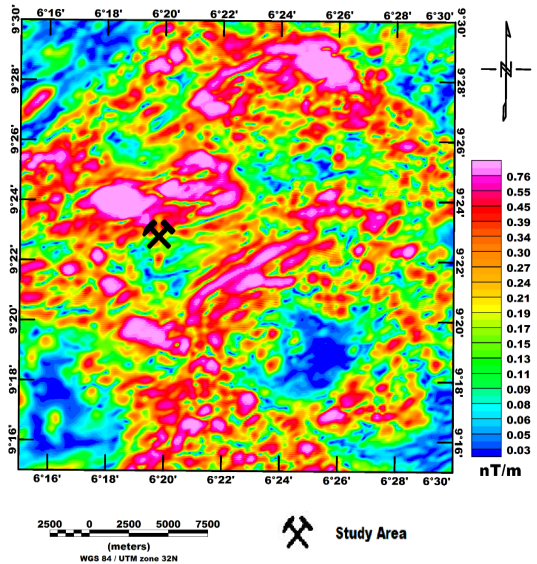
8.6. Interpretation of the Reduced to Equator Analytic Signal (ASA) Map
The analytic signal (AS) amplitude map (Figure 9) displays the subsurface variations in the magnetic responses of the study area. The AS amplitude was estimated through the integrated calculations of both vertical and horizontal field components of the RTE anomalies. The AS amplitude map reveals wide range of values between 0.03 to 0.76 nT/m. Although, the regions of low RTE anomalies (Figure 4) signifies high AS amplitude (Figure 9) and vice versa. This sudden variation could be attributed to the suitability of analytic signal method at low latitude region. The AS method unlike first vertical derivative is independent of the direction of magnetisation. The present study area lies between high AS amplitude from the north and moderate AS amplitude from the south. The observed high and moderate AS amplitudes are due to short-wavelength anomalies that could be associated with mineralised deposits. These high and moderate AS amplitudes are quite similar to the short-wavelength as observed in Figures 7 and 8 resulting from the first vertical derivative maps.
Figure 9. Analytic signal amplitude map produced from RTE anomaly.
8.7 Interpretation of the Reduced to Equator Tilt Derivative (TDR) Map
Tilt derivative (TDR) map (Figure 10) is an output of one of the shallow enhancement techniques is similar to first vertical derivative (FVD) and analytic signal (AS) amplitude. The TDR technique is less vulnerable to noise and thus, is suitable for mapping shallow basement structures and mineral exploration targets . This technique depends on locating particular set of contours resulting from tilt angles . The Tilt derivative is an effective technique used in locating vertical contacts from the reduced to magnetic equator (RTE) in low latitude region like the study area. The zero contours are employed to depict the spatial position of the edges of magnetic bodies. In general, the tilt derivative technique works under the presumption that source bodies are having vertical edges with no remnant magnetisation . The TDR map (Figure 10) show broad ranges of variations in anomalies with values from -0.06 to 1.42 rad/m, covering the study area and its environs. This map enhanced the edges of sources in contrast to the FVD and AS maps as shown in Figures 7 and 9.
Figure 10. Tilt derivative (TDR) map produced from RTE anomaly.
8.8. Interpretation of the 3-D Euler Deconvolution Depths Map
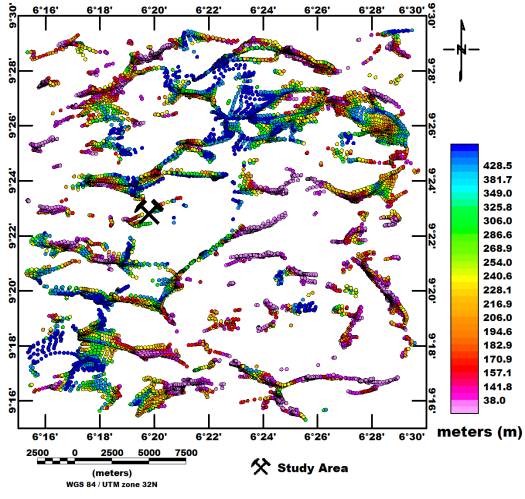
The 3-D Euler deconvolution map (Figure 11) reveals the trend as well as estimate their respective causative depths to the structural features. The depths obtained from these structures varies between 38.0 and 428.5 m. The 3-D Euler deconvolution technique was carried out on the total magnetic intensity anomaly data. This is because the 3-D Euler deconvolution method is independent of the direction of magnetisation i.e., it does not require the inclination and declination information prior to the depth estimation . The depth was estimated using a window size of 2550 m width and a maximum depth tolerance of 14%. In addition, structural index of one for sills and dykes geological model was used. Additionally, the subsurface structural lineaments (Figure 5) map is similar to the 3-D Euler deconvolution depth trends (Figure 11). Though, the trends from the 3-D Euler deconvolution depths solutions yields a better result in contrast to the subsurface structural lineaments (Figure 5). This is because a linear structure with NNE-SSW cut across the study area (Kataeregi mining site) which was not well captured in the RTE lineament map (Figure 5).
Figure 11. 3-D Euler deconvolution map computed from TMI data.

9. Conclusion
It can be concluded at magnetic data has aided in delineating areas of mineralisation potential of Kataeregi and its environs. The visual inspection of the FVD map reveals negative and positive anomalies of different amplitudes with values that varies between -0.01 and 0.34 nT/m. This map reveals both (positive and negative) oval and linear shapes anomalies. Evidently, the study area falls within the low to high negative anomalies with values that varies between -0.01 and -0.34 nT/m. The unveiled subsurface structural features are responsible for hosting mineralised deposits. The study area is dissected by a NE-SW and E-W trending lineaments. The highlighted lineament represents the short wavelength magnetic anomalies which cut across the migmatite gneiss and amphibolites schist of the study area. The 3-D Euler deconvolution technique was carried out on the total magnetic intensity anomaly data, the depths obtained from these structures varies between 38.0 and 428.5 m. Generally, these suggested that these lineaments reflect real continuous fault/fractures in depth.
10. Recommendations
1) The researchers recommend that relevant Government agencies should utilize the research and harnessed the natural resources in the study
2) Ground truthing should also be conducted to further ascertain the anomalous bodies in the study
Abbreviations

NE

Northeast

SW

Southwest

AS

Analytic Signal

FVD

First Vertical Derivatives

TDR

Tilt Deravatives

TMI

Total Magnetic Intensity

RTE

Reduction to Equator

CET

Centre for Exploration Targetting

NNE

North North East

Author Contributions
Jamilu Shehu: Conceptualization, Investigation, Resources
Aliyu Saleh: Data curation, Methodology
Sabo Muhammed Lawal: Formal Analysis
Aisha Alkali: Software, Writing – review & editing
Alhassan Defyan Usman: Supervision
Adewuyi Abdulwaheed Rafiu: Project administration, Validation
Conflicts of Interest
This is to certify that all authors have seen and approved the final version of the manuscript being submitted.
References
[1] Adebiyi S. Adebayo, Emmanuel A. Ariyibi, Oluwaseyi A. Dasho, Charles I. Adenika & Emmanuel O. Olagunju (2021) Structural Interpretation of Magnetic and Satellite Remotely Sensed Data of Osun State, Southwestern, Nigeria, NRIAG Journal of Astronomy and Geophysics, 10: 1, 347-360.
[2] Ajakaiye D. E., Hall D. H., Ashiekaa JA, Udensi E. E. (1991). Magnetic anomaliesin the Nigerian Continental mass based on aeromagnetic surveys. Tectonophysics 192(1): 211-23.
[3] Amstrong M, Rodegheiro A (2006). Airborne Geophysical Techniques in Aziz. Coal Operators’ Conference, University of Wollongong and the Australasian Institute of Mining and Metallurgy 113-131.
[4] Baranov, V. (1957). A new method for interpretation of aeromagnetic maps: pseudo-gravimetric anomalies. Geophysics 22, 359-383.
[5] Beard, L. P. & Goitom, B. (2000). Some Problems in Interpreting Low Latitude Magnetic Surveys. 6th EAGE/EEGS Meeting.
[6] Brempong F., Mariam Q. and Preko K. (2016) The use of magnetic susceptibility measurements to determine pollution of agricultural soils in road proximity, African Journal of Environmental Science and Technology 10(9), pp. 263-271.
[7] Core, D., Buckingham, A & Belfield, S. (2009). Detailed structural analysis of magnetic data done quickly and objectively, SGEG Newsletter.
[8] David L. Campbell and David V. Fitterman (2014). Geoelectrical Methods for Investigating Mine Dumps, Proceeding of the Symposium on the Application of Geophysics to Engineering and Environmental Problems, march 23 – 26, 19 Reno Nevada, 261 – 270.
[9] Dimitri Ilich Kerbauy Veloso, Cesar Augusto Moreira and Ariane Raissa Pinheira Cortes (2015) Integration of Geoelectrical Methods in the Diagnostic of a Diesel Contaminated site in Santa Ernestina (Sp. Brazil), Revista Brasilera de Geofisica 33(4): 667-676.
[10] Douglas I. and Lawson N. (2000) An earth science approach to assessing the disturbance of the Earth’s surface by mining, School of Geography, the University of Manchester.
[11] Ejepu J. S., Unuevho C. I., Ako T. A. and Abdullahi S. (2018). Integrated geosciences prospecting for gold mineralization in Kwakuti, North-Central Nigeria. Journal of Geology and Mining Research, 10(7): 81-94.
[12] Idris-Nda A., Waziri N. M., Bida A. D. and Abdullahi S. (2018) Socio-Economic Impacts of Artisanal and Small-Scale Mining in Parts of Niger State, North Central Nigeria. International Journal of Mining Science (IJMS), 4(3): 21 – 30.
[13] Leu, L. K. (1981). Use of reduction - to- equator process for data interpretation: presented at the 51st Ann, internat. Mtg. Sot. Exnl. Geonhv, Geophysics, Vol 47, p 445.
[14] Miller, H. G. & Singh, V. (1994). Potential Field Tilt-A New Concept for Location of Potential Field Sources. Journal of Applied Geophysics, 32, 213-217.
[15] Mccury, P. (1976). the geology of part of pre-Cambrian to lower paleozoic rocks of Northern Nigeria. A review in geology of Nigeria (Editor Kogbe, C. A) Elizabeth & publishing co. Lagos Nigeria, 7, 15-39.
[16] Obaje, N. G. (2009). Geology and Mineral Resources of Nigeria, Lecture Notes in the Earth Science Springer: Heidelberg.
[17] Okpoli C, & Akingboye A. (2016). Reconstruction and appraisal of Akunu–Akoko area iron ore deposits using geological and magnetic approaches. RMZ – Materials and Geoenvironment Journal, 63, 19-38.
[18] Olomo, K. O., Olayanju, G. M., Adiat K. A. N., Akinlalu, A. A. (2018) Applied Integrated Approach Involving Aeromagnetic and Landsat for Delineating Structures and Its Implication on Mineralisation. International Journal of Scientific & Technology Research. (7)2, 208 – 217.
[19] Omanayin, Y. A., Ogunbajo, M. I., Amadi, A. N., Abdulfatai, I. A., and Mamodu, A. (2016) Water quality investigation within the neighbourhood of Kataeregi artisanal gold mining sites, North-Central Nigeria. Journal of information, Education, Science and Technology (JIEST), 3(2): 123-130.
[20] Reid, A. B., Ebbing., J and Webb., S. J (2013). Avoidable Euler errors-the use and abuse of Euler deconvolution applied to potential fields. Geophysics Prospecting.
[21] Salem, A., Williams, S., Fairhead, D., Smith, R., & Ravat, D. (2008). Interpretation of Magnetic Data Using Tilt-angle Derivatives. Geophysics, 73, L1-L10.
[22] Salawu, N. B., Olatunji, S., Adebiyi, S. L., Olasunkanmi, K. N. & Dada, S. S. (2019). Edge detection and magnetic basement depth of Danko area, north western Nigeria, from low‑latitude aeromagnetic anomaly data. Springer Nature Switzerland Applied Sciences, 1, 1056.
[23] Tawey M. D., Alhassan D. U., Adetona A. A., Salako K. A., Rafiu A. A. and Udensi E. E. (2020) Application of Aeromagnetic Data to Assess the Structures and Solid Mineral Potentials in Part of North Central Nigeria. Journal of Geography, Environment and Earth Science International, 24(5): 11-29.
[24] Thompson, D. T. (1982). EULDPH-A new technique for making computer-assisted depth Estimates from magnetic data. Geophysics, 47: 31–37.
Cite This Article
  • APA Style

    Shehu, J., Saleh, A., Lawal, S. M., Alkali, A., Alhassan, U. D., et al. (2026). Interpretation of Aeromagnetic Data to Assess Structures and Solid Mineral Potentials at Kataeregi and Its Environ, Niger State, Nigeria. American Journal of Physics and Applications, 14(4), 68-82. https://doi.org/10.11648/j.ajpa.20261404.12

    Copy | Download

    ACS Style

    Shehu, J.; Saleh, A.; Lawal, S. M.; Alkali, A.; Alhassan, U. D., et al. Interpretation of Aeromagnetic Data to Assess Structures and Solid Mineral Potentials at Kataeregi and Its Environ, Niger State, Nigeria. Am. J. Phys. Appl. 2026, 14(4), 68-82. doi: 10.11648/j.ajpa.20261404.12

    Copy | Download

    AMA Style

    Shehu J, Saleh A, Lawal SM, Alkali A, Alhassan UD, et al. Interpretation of Aeromagnetic Data to Assess Structures and Solid Mineral Potentials at Kataeregi and Its Environ, Niger State, Nigeria. Am J Phys Appl. 2026;14(4):68-82. doi: 10.11648/j.ajpa.20261404.12

    Copy | Download

  • @article{10.11648/j.ajpa.20261404.12,
      author = {Jamilu Shehu and Aliyu Saleh and Sabo Muhammed Lawal and Aisha Alkali and Usman Defyan Alhassan and Adewuyi Abdulwaheed Rafiu},
      title = {Interpretation of Aeromagnetic Data to Assess Structures and Solid Mineral Potentials at Kataeregi and Its Environ, Niger State, Nigeria},
      journal = {American Journal of Physics and Applications},
      volume = {14},
      number = {4},
      pages = {68-82},
      doi = {10.11648/j.ajpa.20261404.12},
      url = {https://doi.org/10.11648/j.ajpa.20261404.12},
      eprint = {https://article.sciencepublishinggroup.com/pdf/10.11648.j.ajpa.20261404.12},
      abstract = {The objective of the study are to delineate structurally controlled mineralisation zone in the study area and map out subsurface structures below the ground surface that play host to minerals (fractured zones, fault lines and lithologic contact). The mineralisation potential of Kataeregi (Latitudes 09º21ꞌN and 09º25ꞌN and Longitudes 006º17ꞌE and 006º22ꞌE) and its environs have been investigated using aeromagnetic data. Aeromagnetic data acquired from Nigeria Geological Survey Agency was used to analyse and interpret the magnetic signatures using different filters. The 3-DEuler deconvolution map locate and estimate the depth to various anomalous bodies with depth to source body between 30 m and 428.5 m. The results revealed lineaments trending majorly in NE-SW directions. The FVD anomaly map established the oval and linear shapes anomalies with values between -5.78 to 0.34 nT/m, the ASA amplitude map reveals wide range of values between 0.03 to 0.76 nT/m, the TDR map showed variations in anomalies with values ranging from -0.06 to 1.42 rad/m. The unveiled subsurface structural features are responsible for hosting mineralised deposits. The highlighted lineament represents the short wavelength magnetic anomalies which cut across the migmatite gneiss and amphibolites schist of the study area. The depth was estimated using a window size of 2550 m width and a maximum depth tolerance of 14%. Generally, these suggested that these lineaments reflect real continuous fault/fractures in depth.},
     year = {2026}
    }
    

    Copy | Download

  • TY  - JOUR
    T1  - Interpretation of Aeromagnetic Data to Assess Structures and Solid Mineral Potentials at Kataeregi and Its Environ, Niger State, Nigeria
    AU  - Jamilu Shehu
    AU  - Aliyu Saleh
    AU  - Sabo Muhammed Lawal
    AU  - Aisha Alkali
    AU  - Usman Defyan Alhassan
    AU  - Adewuyi Abdulwaheed Rafiu
    Y1  - 2026/10/15
    PY  - 2026
    N1  - https://doi.org/10.11648/j.ajpa.20261404.12
    DO  - 10.11648/j.ajpa.20261404.12
    T2  - American Journal of Physics and Applications
    JF  - American Journal of Physics and Applications
    JO  - American Journal of Physics and Applications
    SP  - 68
    EP  - 82
    PB  - Science Publishing Group
    SN  - 2330-4308
    UR  - https://doi.org/10.11648/j.ajpa.20261404.12
    AB  - The objective of the study are to delineate structurally controlled mineralisation zone in the study area and map out subsurface structures below the ground surface that play host to minerals (fractured zones, fault lines and lithologic contact). The mineralisation potential of Kataeregi (Latitudes 09º21ꞌN and 09º25ꞌN and Longitudes 006º17ꞌE and 006º22ꞌE) and its environs have been investigated using aeromagnetic data. Aeromagnetic data acquired from Nigeria Geological Survey Agency was used to analyse and interpret the magnetic signatures using different filters. The 3-DEuler deconvolution map locate and estimate the depth to various anomalous bodies with depth to source body between 30 m and 428.5 m. The results revealed lineaments trending majorly in NE-SW directions. The FVD anomaly map established the oval and linear shapes anomalies with values between -5.78 to 0.34 nT/m, the ASA amplitude map reveals wide range of values between 0.03 to 0.76 nT/m, the TDR map showed variations in anomalies with values ranging from -0.06 to 1.42 rad/m. The unveiled subsurface structural features are responsible for hosting mineralised deposits. The highlighted lineament represents the short wavelength magnetic anomalies which cut across the migmatite gneiss and amphibolites schist of the study area. The depth was estimated using a window size of 2550 m width and a maximum depth tolerance of 14%. Generally, these suggested that these lineaments reflect real continuous fault/fractures in depth.
    VL  - 14
    IS  - 4
    ER  - 

    Copy | Download

Author Information
  • Abstract
  • Keywords
  • Document Sections

    1. 1. Introduction
    2. 2. Description of the Study Area
    3. 3. Geology of the Study Area
    4. 4. Review of Geophysical Methods
    5. 5. Material and Method
    6. 6. Theories of the Adopted Magnetic Interpretation Methods
    7. 7. Estimation of Depths to the Concealed Structures
    8. 8. Results and Discussion
    9. 9. Conclusion
    10. 10. Recommendations
    Show Full Outline
  • Abbreviations
  • Author Contributions
  • Conflicts of Interest
  • References
  • Cite This Article
  • Author Information