Research Article | | Peer-Reviewed

Evaluation of Improved Head Cabbage (Brassica oleraceae var capitata oleraceae L.) Varieties for Head Yield in West Hararghe, Eastern Oromia, Ethiopia

Received: 27 April 2026     Accepted: 22 June 2026     Published: 22 July 2026
Views:       Downloads:
Abstract

Cabbage (Brassica olearacea var capitata L.) is one of the most important leafy vegetables worldwide and is adapted to cool, moist conditions. This study aimed to identify high-yielding, disease-tolerant and adaptable cabbage varieties suitable for the study areas. Four head cabbage varieties (Chaka, Tana, Cabbice and Copenhagen Market) were evaluated using randomized complete block design with four replications. The experiment was conducted in Chiro, Tulo and Oda bultum districts during 2023 and 2024 cropping season. The results of the combined analysis of variance (ANOVA) showed the presence of highly significant (P<0.01) differences among varieties for all traits studied, except number of expanded true leaves. The mean squares for location were also significant, indicating the influence of environmental factor on the performances of the tested varieties. From the combined analysis of variances, Cabbice variety produced the highest head yield (126. t ha-1, followed by Tana variety (100.38t ha-1). In contrast, the lowest total head yield (92.52 t ha-1) was recorded from Copenhagen Market variety. AMMI analysis showed that the effect of environments, varieties and their interaction effects were highly significant. The stability and yield performance of the varieties were further explained using a GGE bi-plot. Significant variation in head yield among the varieties was observed across different environments. Cabbice variety exhibited wide adaptability and superior yield performance across high yielding environments. Generally, the study indicated that Cabbice variety was recommended for the study areas and other similar ago-ecologies for further demonstration and scaling up.

Published in American Journal of Plant Biology (Volume 11, Issue 3)
DOI 10.11648/j.ajpb.20261103.12
Page(s) 45-55
Creative Commons

This is an Open Access article, distributed under the terms of the Creative Commons Attribution 4.0 International License (http://creativecommons.org/licenses/by/4.0/), which permits unrestricted use, distribution and reproduction in any medium or format, provided the original work is properly cited.

Copyright

Copyright © The Author(s), 2026. Published by Science Publishing Group

Keywords

Adaptation, Cabbage, Genotype x Environment Interaction, Head Yield, Stability Analysis

1. Introduction
Cabbage (Brassica oleracea var. capitata L.) is an important Cole crop which is a member of the family Brassicaceae. It is native of Western Europe and the Northern Shore of Mediterranean Region . Cabbage originated from the wild, leafy, non-heading types ‘Cole wart’ (Brassica olearacea var. sylvestris) . Cabbage is one of the most ancient vegetables cultivated for more than 4,000 years . Cabbage is used commonly as vegetables. It is also used for salad mixed in tomato, green chilies, beetroot etc. It is a rich source of sulfur containing amino acids, minerals, carotenes ascorbic acid and antioxidants, and is reported to have anti-carcinogenic properties . It is also an excellent source of vitamins A, C, K, B1, B2, and B6, calcium, dietary fiber and protein when it is eaten raw as salad and boiled or cooked as stew or soup . There are three types of heading cabbage namely green, red and Savoy. They contain different amounts of nutrients with Savoy being more superior .
Cabbage and other brassicae are produced in more than 145 countries in the world. The leading cabbage producing countries in the world are China, India, Russian, Federation, Japan and Republic of Korea, respectively. China and India produced about 60% of the world’s cabbage production with a share of 46.4% and 12.8% respectively. Cabbage is the second most important vegetable crop in Ethiopia both in area coverage as well as level of production next to red pepper, or capsicum species .
Head cabbage has a short stem and a globular head of tightly overlapping green to purplish leaves. As far as their heads are concerned, they are compactor loose. It is a biennial crop that is grown as an annual which takes 6 - 11 weeks from planting to the end of the vegetative stage. Cabbage is a cool season crop which requires adequate availability of soil water and plant nutrients for optimum growth. It has a moderately high frost tolerance. It will grow at 7°C, but it does best from 15.5-18°C, above 27°C the plants may bolt, causing the heads to split open . Cabbage seed germinates in about two weeks in soils with temperature as low as 10°C, which allows for early plantings in cooler regions . Depending on the variety, cabbage requires 60 to 100 days from sowing to reach market maturity. A well-drained sandy loam soil with good organic content and soil pH of between 6.0 and 6.5 is preferred .
According to a CSA (Central Statistical Agency) report, in and , in Ethiopia the total production of head cabbage was 245,650.47 and 561,042.34 quintals, respectively which were increased by 128.39%. In the same year the area covered by head cabbage was 3,629.92 and 6,649.67 ha, respectively which was increased by 83.19%. Similarly, in Oromia the crop is now produced by 268,506.47 farmers with area coverage of the crop 4,198.46 ha and who collectively yield 92.59qt/ha . The productivity of cabbage in Ethiopia is very low (9.259 t ha-1) . According to under rain fed conditions, yields of 25 to 35 tone ha-1 fresh heads are normal, with a maximum of about 50 tone ha-1 when sprayed and well-fertilized. Under ideal climatic conditions and good irrigation and crop management, yields can be as high as 85ton/ha.
In the West hararghe zone, head cabbage is produced by small scale farmers for food stuff and local markets throughout the year; however, the growers are growing less productive and unimproved varieties. In order to increase the production and productivity of head cabbage, there was no exhaustive research done so far; rather some adaptation and agronomic trial was conducted in some other part of Ethiopia. So far there has been no cabbage adaption trial conducted in the study area. However, there is a shortage of research on head cabbage in terms of variety release, adaptation and agronomic aspects in west hararghe despite the importance of the crop. So, it is very important to support the production of head cabbage by research in order to improve the production and productivity. For this reason, the experiment was conducted with the objective of selecting and identifying the most adaptable, high yielding and disease tolerant/resistant head cabbage varieties for the study areas.
2. Materials and Methods
2.1. Description of the Study Area
The experiment was conducted under rain fed conditions during the year 2023 and 2024 cropping season at Chiro, Tulo and Oda Bultum distincts.
Table 1. Description of the study area.

Distincts

Latitude

Longitude

Altitude (m a.s.l)

Annual Average Temperature (℃)

Annual Rainfall (mm)

Chiro

9°07′N

40°87′E

1792

21

876

Tulo

9°20′N

41°10′E

1800

19

995

Oda Bultum

8°91′N

40°77′E

1703

20

1053

2.2. Experimental Materials and Design
The experiment was conducted using four recently released varieties of head cabbage: Chaka, Tana, Cabbice and Copenhagen Market. The experiment was laid out in Randomized Complete Block Design (RCBD) with four replications. Each plot measured 3.2 m x 2.4 m = 7.68m2 wide and consisted of four rows, with 8 plant per row, making a total 32 plants per plot. Cabbage seedling were raised on a flatbed nursery for one month and then transplanted onto the sides of the ridge when they develop two pairs of true leaves or reached a height 8 - 13cm. Spacing was maintained at 40cm between plants and 60cm between rows. All Agronomic practices were applied with recommended the crop management practices.
Table 2. Description of Cabbage varieties.

S/No

Variety Name

Year of Release

Seed Source

1

Chaka

2021

Green Life Trading PLC.

2

Tana

2018

Markos Trading PLC.

3

Cabbice

2021

Green Life Trading PLC.

4

Copenhagen Market

1909

Green Life Trading PLC.

2.3. Data Collection
Data was collected from ten plants of two internal rows of each plot and randomly tagged and the relevant data was recorded. All plants from the net plot/ two internal rows of each were subjected to yield and yield traits evaluation. The following major parameters were recorded: Plant height (cm): The height of the plant was measured by placing a meter scale from ground level to the tip of the outer longest leaf of an individual centimeter (cm) plant at the time of 90% days to head maturity. Number of expanded true leaves per plant: The number of leaves per plant was counted and the mean of ten plants was recorded before the start of head initiation excluding unfolded and dead leaves. Fresh weight of trimmed head mass: The fresh weight of marketable head per plant was found from the average weight of ten plants and expressed in kilogram (kg) when yield data was taken. Fresh weight of untrimmed head mass: The fresh weight of head with unfolded leaves per plant was found from the expressed in kilogram (kg) yield data was taken. Head height: Head height (cm) was obtained from ten representative plants per plot and measured by cutting vertically using a ruler at the time of harvesting. Diameter of head (t ha-1): Head diameter was obtained from ten representative plants per plot and measured by cutting vertically using a ruler at the time of harvesting. Marketable head yield (t ha-1): Heads which were free from any damages and decay as well as those which haven’t loose and open heads were considered as marketable. Unmarketable head yield (t ha-1): Those heads which did not fulfill the criterion including the wrapper leaves were considered as unmarketable Total Head yield (t ha-1): The total yield was then obtained by adding the marketable and unmarketable yields and used for further analysis.
2.4. Data Analysis
Analysis of variance procedures was used on every measured parameter to determine the significance of differences between means of treatments by using R statistical software version 4.5.2 for each parameter and separated by the least significant difference (LSD) using the statistical package. The means was compared using LSD at a probability level of 5%.
2.4.1. AMMI Analysis
Head yield was analyzed using the additive main effect and multiplicative interaction (AMMI) model, which was proposed for the AMMI analysis of variance (ANOVA) .
The AMMI model equation is as follows:
Yij=μ+Gi+Ej+K=1nkikjk+pij+ԑij
Where, Yij is the mean grain yield of the ith genotype in the jth Environment, µ is the grand mean;
Gi and Ej are the genotype and environment deviation from the grand mean, respectively, ik and jk are the eigenvalue of the kth interaction PCA (IPCA) sustained in the AMMI model, the eigenvectors for the ith genotype from nth IPCA, and the eigenvectors for the jth Environment from the nth IPCA, respectively. n is the maximum number of multiplicative terms; pij is the GEI residual; εij is the residual error term.
2.4.2. GGE- biplot Analysis
Head yield was analyzed using the genotype main effect and genotype plus environment interaction effect (GGE) model. The GGE model equation described according to was used as below:
Yij-μ-βj=λ1ξi1-ηj1+λ2ξi2−ηj2+εij
Where, Yij is the mean for the ith genotype in the jth Environment, µ is the grand mean, βj is the main effect of environment j, λ1 and λ2 are the singular values decomposition of the first and second principal components (PC1 and PC2), ξi1 and ξi2 are the PC1 and PC2 scores, respectively, for genotype ith, ηj1 and ηj2 are the eigenvectors for the jth Environment for PC1 and PC2, and ε is the residual error term.
3. Results and Discussion
The results of analysis variances (ANOVA) based on the combined means across locations are presented in (Table 3). Highly significant differences (P < 0.01) among varieties were observed for all measured traits except number of expanded true leaves. This indicated the existence of substantial genetic variability among tested head cabbage varieties. Similarly, location had significant (P<0.05) to highly significant (P<0.01) effects on most traits, indicating the strong influence of environmental conditions on varietal performance. The year effect was significant for head length, head diameter, marketable height yield and total head yield, showing variable climatic conditions between seasons. However, fresh weight of trimmed head, number of expanded true leaves per plant, plant height and unmarketable head yield were not significantly affected by year. The Interaction effect of varieties by location (GxE) was showed significant (P<0.05) affect for all considered traits number of expanded true leave per plant, unmarketable head yield and plant height, suggesting differential varietal responses across environments.
Table 3. Mean squares from the analysis variance of four head cabbage varieties for head yield and yield related traits at three locations over two years.

Mean Square

Source of variation

DF

PH

NETL

FWTH

FWUTH

HL

HD

MHY

UMHY

THY

Variety (V)

3

310.79**

1.45ns

2.32**

4.63**

16.00**

30.44**

2142.60**

1387.90*

5205.00**

Location (L)

2

202.04**

11.86**

1.48**

2.30**

78.58**

3.72ns

1423.50**

8198.00**

3145.10*

Rep

3

7.86ns

1.73ns

0.06ns

0.16ns

4.02ns

1.03ns

58.70ns

1478.50*

1943.20*

Year (Y)

1

17.09ns

0.14ns

0.20ns

1.30*

27.86**

33.54**

4061.40**

100.30ns

5438.50**

Variety: Location

6

16.01ns

1.68ns

0.45*

0.71*

6.76*

6.19**

677.00**

262.40ns

1269.40*

Variety: Year

3

22.77ns

1.84ns

0.26ns

1.04*

3.94ns

1.07ns

150.30ns

120.60ns

395.20

Location: Year

2

230.72**

37.42**

7.57**

10.48**

84.30**

88.47**

9320.80**

244.00ns

11090.30**

V: L: Y

6

25.70*

1.52ns

0.63**

0.59*

3.82ns

3.45ns

498.80*

257.90ns

392.70ns

Residuals

69

11.40

1.23

0.18

0.27

2.32

1.99

217.60

503.40

654.10

key: **: Highly Significant (P<0.01); *: Significant (P<0.05), ns: non-significant,; DF: Degree of Freedom; PH: Plant Height (cm); NETL: Number of True Leaves per plant; FWTH: Fresh Weight of Trimmed Head (kg); FWUTH: Fresh Weight Untrimmed Head (kg); HL: Head Length (cm), HD: Head Diameter (cm); MHY: Marketable Head Yield (t ha-1); UMHY: Unmarketable Head Yield (t ha-1) and THY: Total Head yield (t ha-1)
3.1. Performance of Varieties for Growth Traits
Plant Height
The tallest plant height was recorded from Chaka variety (36.14cm), followed by Cabbice (30.88cm), which did not differ statistically from Tana (30.67cm). The shortest plant height was recorded for the Copenhagen variety (27.45cm) (Table 4). The variation in plant height among the tested varieties likely reflects genetic differences and environmental effects. These result is agree with , who found a significant effect of environments and varieties on plant height in western Ethiopia.
3.2. Performance of Varieties for Head Yield and Yield Related Traits
3.2.1. Fresh Weight of Trimmed and Untrimmed Head Mass
The highest fresh weight of trimmed head mass was recorded from Cabbice variety (2.56kg), which was statistically similar to Chaka variety (2.49kg) and the lowest fresh weight of trimmed head mass was recorded from Copenhagen variety (1.91kg) (Table 4). The variation may be attributed to the differences in genetic potential among head cabbage varieties. These results agree with , who found significant differences in fresh weight of trimmed and untrimmed head mass among cabbage varieties.
3.2.2. Head Length and Head Diameter
The maximum head length was recorded from Cabbice variety (18.10cm), which did not differ statistically from Chaka (18.07cm) and Tana (17.46cm) varieties, while the lowest head length was recorded from Copenhagen variety (16.35cm) (Table 4). The maximum head diameter was recorded from the Cabbice variety (19.34cm), which was statistically similar to Chaka variety (18.71cm). The lowest head diameter was recorded from the Copenhagen variety (16.71cm) (Table 4). The variation among varieties for agronomic and yield traits, indicated the presence of variability, which could be attributed to the genetic potential of the varieties used among the evaluated varieties and for the traits under consideration. This result is agreed with the findings of , who found significant differences in head length and head diameter among cabbage varieties.
3.2.3. Marketable and Unmarketable Head Yield
The highest marketable head yield was recorded from Cabbice variety (91.29t ha-1), followed by Chaka (83.69 t ha-1) while, the Copenhagen (69.89 t ha-1) had the lowest marketable head yield (Table 4). The highest unmarketable head yield was recorded from Cabbice variety (34.8 t/ha), which was statistically similar to Tana (25.68 t ha-1) and Copenhagen (22.21 t ha-1), which could be due to disease and produce under size heads. However, the lowest unmarketable head yield (16.67 t ha-1) was recorded from the Chaka variety (Table 4). Variation among varieties for unmarketable yield could be attributed to their genetic make-up. The research reported that marketable head yields significantly varied among varieties . Similarly, other authors reported significant differences in marketable head yield among cabbage varieties .
Table 4. Combined means yield and yield related traits of head cabbage varieties at three locations (Chiro, Tulo and Oda bultum,) over two years.

Variety

PH

NETL

FWTH

FWUTH

HL

HD

MHY

UMHY

THY

Cabbice

30.88b

9.33

2.56a

2.97a

18.10a

19.34a

91.29a

34.80a

126.10a

Chaka

36.14a

9.9

2.49a

3.13a

18.07a

18.71ab

83.69a

16.67b

100.36b

Copenhagen

27.45c

9.73

1.91b

2.15c

16.35b

16.71c

69.89b

22.21ab

92.10b

Tana

30.67b

9.75

2.10b

2.56b

17.46a

18.10b

75.05b

25.68ab

100.73b

Means

31.29

9.68

2.27

2.7

17.5

18.22

79.98

24.84

104.82

LSD (5%)

1.94

0.66ns

0.24

0.3

0.92

0.84

8.52

13.5

15.19

CV (%)

10.79

11.77

18.72

19.09

9.10

8.02

18.44

90.00

25.1

Key: PH: Plant Height (cm); NETL: Number of True Leaves per plant; FWTH: Fresh Weight of Trimmed Head (kg); FWUTH: Fresh Weight Untrimmed Head (kg); HL: Head Length (cm); HD: Head Diameter (cm) MHY: Marketable Head Yield (t ha-1); UMHY: Unmarketable Head Yield (t ha-1) and THY: Total Head Yield (t ha-1)
3.2.4. Total Head Yield
The highest total head yield was recorded from Cabbice variety (126.10t ha-1), followed by Tana (100.73 t ha-1), while the lowest total tuber yield was recorded from Copenhagen market variety (92.10 t ha-1) (Table 4) and (Table 5). The variation between varieties for head yield might be due to the presence of genetic differences used in the development of these varieties. This result is similar with the findings of who found significant differences in total head yield (88.72-118.11 t ha-1) among cabbage varieties. These result similar with , who found a significant effect of environments and varieties. also reported that cabbage varieties had a significant difference with respect to total head yield (124.49-164 t ha-1).
Table 5. Means of head yield (t ha-1) Cabbage varieties at three locations and over two years.

Distincts

Variety

Oda bultum

Tulo

Chiro

Overall Mean

2023

2024

2023

2024

2023

2024

Cabbice

164.41a

105.34

146.29a

98.52a

103.71a

138.26a

126.09a

Chaka

120.36ab

102.34

100.54b

73.83ab

88.71ab

116.40ab

100.36b

Copenhagen

113.29b

67.56

110.19b

94.96a

70.1b

96.59b

92.10b

Tana

144.31ab

111.87

112.75ab

65.68b

73.55ab

96.20b

100.73b

Means

135.59

96.77

117.44

83.25

84.02

111.86

104.82

LSD 5%

45.46

44.46ns

34.83

26.13

32.9

26.30

14.73

CV%

20.96

28.72

18.54

19.62

24.49

14.70

24.40

3.3. AMMI Analysis of Variance (AMMI ANOVA)
AMMI analysis indicated that head yield was significantly (p<0.01) affected by environments (E), varieties (G) and the first interaction principal components axis (IPCA1), while the second interaction principal component axis (IPCA2) was not significant. The genotype x environment (GxE) interaction was indicated significant at (P<0.05) in (Table 6). This showed that the varieties responded differently to different environments or those varieties responses were affected by the environment, and thus, the test environment were highly variable. The AMMI model (Table 6) explained three of the principal component axes, demonstrating the existence of GxE interaction. Many researchers observed that the most accurate AMMI model estimate can be made using the first two IPCAs . The remaining interaction principal component axis captured mostly non-predictive random variation and did not fit to predict validation observations . Based on this, the first and second interaction principal components explained 87.5% of the total variation (IPCA1= 61.8% and IPCA2 = 25.7%). The first two interaction principal components (IPCA1 and IPCA2) together captured above 50% interaction principal components.
Table 6. Analysis variance of AMMI model for head yield of Cabbage varieties.

Source of Variation

Df

SS

MS

%G*E

% Accumulated Interaction

Environment (E)

5

33909.38

6781.88**

Varieties (G)

3

15614.89

5204.96**

Interaction (G*E)

15

11158.33

743.89*

IPCA1

7

6900.80

985.83*

61.8

61.8

IPCA2

5

2865.27

573.05ns

25.7

87.5

IPCA3

3

1392.26

464.09ns

12.5

100

Residuals

54

27132.92

502.46

**: highly significant (P<0.01); *: significant (P<0.05); IPCA1: Interaction principal component axis 1; IPCA2 = Inter principal component 2; IPCA3 = Inter principal component axis 3; DF: Degree freedom; SS: Total sum squares; MS: Mean sum squares; %G*E: Percentage of genotype by environment interaction
3.4. Genotype and Genotype by Environment Interaction (GGE) Bi-plot Stability Analysis
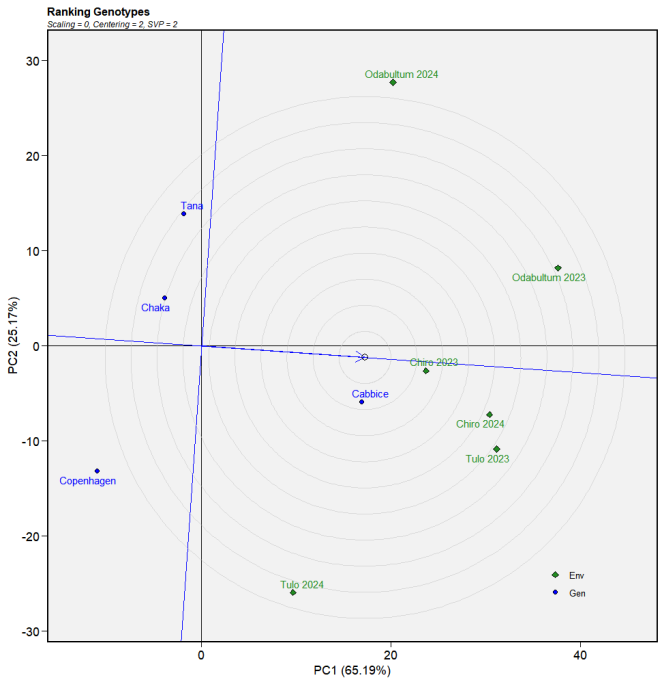
Genotypes that fall in the central (concentric) circle are considered as ideal stable genotypes . A genotype is more desirable if it is located closer to the ideal genotype. Thus, using the ideal genotype as the center, concentric circles were drawn to help visualize the distance between each genotype and the ideal genotype. Therefore, the ranking based on the genotype-focused scaling assumes that stability and mean yield are equally important . Accordingly, Cabbice variety fell into the nearest of concentric circles and thus was found to be the ideal variety in terms of higher yielding ability and stability, compared with the rest of the varieties (Figure 1).
Figure 1. GGE Biplot view of ranking Cabbage varieties. Blue and green colors stand for genotypes and environments, respectively.
3.5. Mean Performance and Stability of Varieties
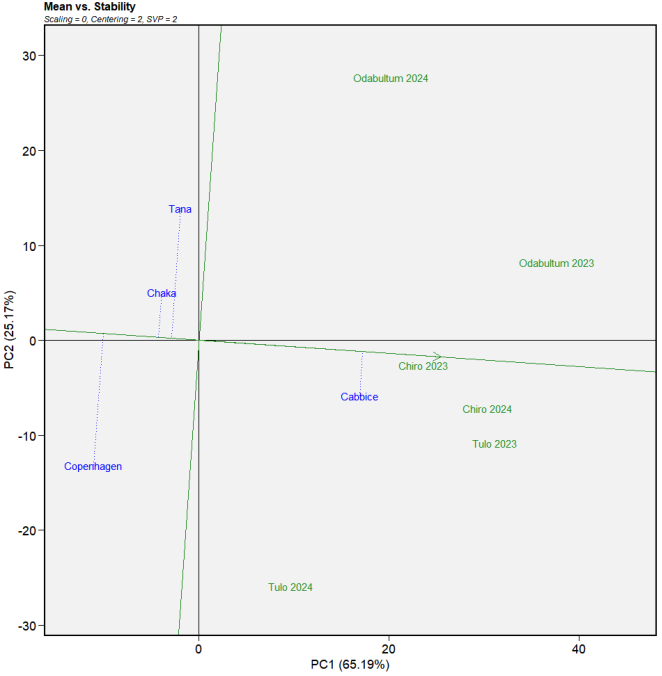
The AEC Y- axis or the stability axis passes through the plot origin with a double arrow head and is perpendicular to the AEC X-axis. The single – arrowed line is the AEC abscissa, pointing to higher mean yield across location. A genotype which has shorter absolute length of projection in either of the two directions of AEC ordinate (located closer to AEC abscissa), represents a smaller tendency of variety by location interaction, which means it is the most stable and adaptable variety across different environments. Therefore, mean performance and stability of varieties indicated that variety Cabbice was highly stable, while Tana, Chaka and Copenhagen were found to be the most variable with low yield performances and unstable (Figure 2).
Figure 2. Mean vs. stability pattern of GGE biplot showing interaction effect of cabbage varieties. Blue and green colors stand for genotypes and environments, respectively.
3.6. “Which-Won-Where” Patterns of Genotypes and Environments
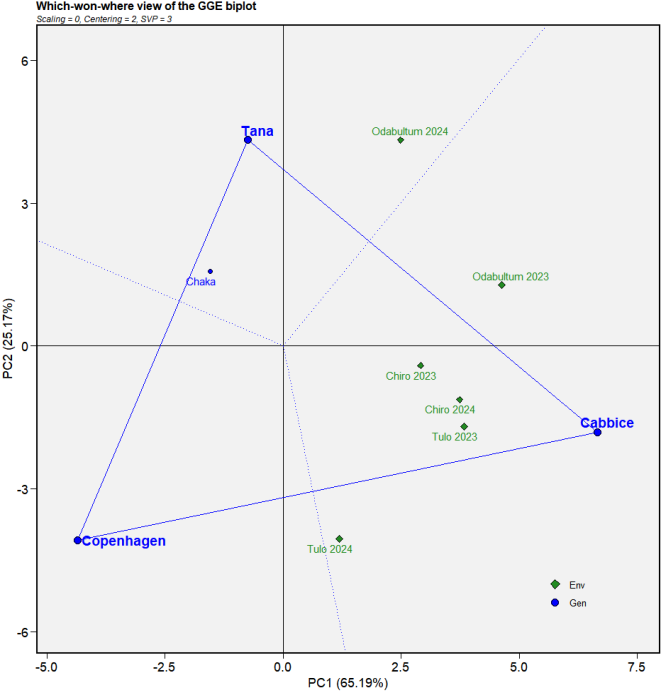
Visualization of the which-won-where pattern is important for studying the possible presence of different mega-environments (ME) in a region . The polygon view of a GGE-biplot explicitly shows the which-won-where pattern and hence, concise summary of the GEI (Figure 3). By connecting the markers of the genotypes and the rays as showed, the ray in Figure 3 are lines that are perpendicular to the sides of the triangular or their extensions. These three (3) rays divide the biplot into three (3) sectors, but environments fall into two of them, so the genotypes vertex in these sectors may have higher or the highest yield compared to other parts in all environments . Five environments, Oda bultum 2023, Tulo 2023, Chiro 2023, Tulo 2024 and Chiro 2024, fell into sector 2, and the vertex variety for this sector was Cabbice, suggesting that this is a higher- yielding variety for these five environments (Figure 3). One environment, Oda bultum 2024 fell into sector 1, and the vertex varieties for this sector were Tana and Chaka, suggesting that these are higher-yielding varieties for this one environment (Figure 3).
Figure 3. GGE-biplot views of the which-won-where pattern for cabbage varieties and environments. Blue and green colors stand for varieties and environments, respectively.

4. Conclusion and Recommendation
The Analysis results indicated significant variation among cabbage varieties for important agronomic and yield traits including, head length, fresh weight of trimmed head per plant, head diameter, marketable and total head yield were significantly different among the head cabbage varieties. Accordingly, the highest marketable head yield (91.29 t ha-1) and total head yield (126.10 t ha-1) was recorded from the Cabbice variety respectively. Generally, Cabbice variety was identified as the highest head yielding and adaptable variety to the study area under rain fed condition. Therefore, Cabbice variety was recommended for the study areas and other similar ago-ecologies for further demonstration and scaling up.
Abbreviations

ANOVA

Analysis of variance

AMMI

Additive Main Effects and Multiplicative Interaction

CSA

Central Statistical Agency

FAO

Food Agricultural Organization

GEI

Genotype by Environment Interaction

Acknowledgments
The authors would like to thank Oromia Agricultural Research Institute for granting the fund and Mechara Agricultural Research Center for providing the research facilities required, particularly Horticulture and Spice Research Team members are acknowledged for their efforts on trial management, data collection and other technical support.
Author Contributions
Dagne Assefa: Conceptualization, Methodology, Project administration, Data curation, Software, Formal Analysis, Investigation, Validation and visualization, Writing – original draft
Gezahegn Assefa: Data curation, Supervision, Investigation, Writing – review & editing
Dereje Deresa: Data curation, Supervision, Investigation, Writing – review & editing
Conflicts of Interest
The authors declare no conflicts of interest.
References
[1] Schlegel R. H. J. (2010). Dictionary of Plant Breeding. 2nd Ed. - CRC Press, Taylor and Francis Group, Boca Raton - London - New York 2010. 571 pp.
[2] Singh N., Shubha deep Roy, Pradip KC Laurasia, S. N. S., Gupta, S. and Singh, B. (2015). Improved Production Technologies in Vegetable Crops. IIVR Training Manual No. 59. ICAR Indian Institute of Vegetable Research, Varanasi, India, Pp 268.
[3] Moamogwe M. (2005). Adaptation Trial of Introduced Cabbage Cultivars. ARPT raining Reports (1995-1997) AVRDC-AFRICA Regional Program, Arusha, Tanzania. Pp.: 27-29.
[4] Jensen B. (2004). The healing power of fruits and vegetables. Global paperback edition published by global vision publishing house19A/ E, G. T. B. Enclave, Delhi 110093 (INDIA) Pp. 189 Mateljan, G. 2007. The world’s healthiest food Nutrient in cabbage, shredded, boiled. George Mateljan Foundation, Chicago.
[5] Singh B K, Sharma S. R. and Singh B. (2009). Heterosis for mineral elements in single cross hybrids of cabbage (Brassica oleracea var. capitata L). Scientia Horticulture 122(1): 326.
[6] Uddin, M. J., Islam, M. M. and Naher, M. N. A. (2009). Basic Agriculture, Part Ι.74/4, Upashahar, Rajshahi. 379 p.
[7] Pierce L. C. (2007). Vegetables: Characteristics, Production and Marketing. John Wely and Sons, Incorporation Toronto, Canada, 15: 176-223.9.
[8] Ministry of Agriculture Natural Resource Sector (MANRS). (2011). Guideline on Irrigation Agronomy. Published by Natural Resources Management Directorate, Natural Resource Sector and the Ministry of Agriculture, Addis Ababa, Ethiopia.
[9] Ashworth (2002). Seed to Seed: Seed Saving and Growing Techniques for Vegetable Gardeners. New York: Seed Savers Exchange In, Pp.: 54-68.
[10] Kennedy, A. C. and Smith, K. L. (1995) Soil Microbial Diversity and the Sustainability of Agricultural Soils. Plant and Soil, 170, 75-86.
[11] Yano F. Nakajima T. and Matsuda M. (1999). Reduction of nitrogen and phosphorus from livestock waste: A major priority for intensive animal production - Review. Asian Austral. J. Anim. Sci. 12651–656.
[12] Ethiopian Central Statistical Agency (CSA). (2020). The Federal Democratic Republic of Ethiopia Central Statistical Agency Agricultural sample survey Volume I, report on area and production of major crops, Addis Ababa, Ethiopia.
[13] Ethiopian Central Statistical Agency (CSA). (2021). The Federal Democratic Republic of Ethiopia Central Statistical Agency Agricultural sample survey Volume I, report on area and production of major crops, Addis Ababa, Ethiopia.
[14] FAO. (2024).
[15] Gauch, H. G. (1988) Model Selection and Validation for Yield Trials with Interaction. Biometrics, 44, 705-715.
[16] Yan, W., Hunt, L. A., Sheng, Q., and Szlavnics, Z. (2000). Cultivar evaluation and mega-environment investigation based on the GGE biplot. Crop Sci. 40, 597–605.
[17] Kibru Kena and Alemayehu Latera (2024). Evaluation of Commercial Head Cabbage (Brassica oleracea L.) Varieties in Kellem Wollega Zone. Science PG, Vol. 12, No. 3, pp. 76-81.
[18] Solomon Teshome, Tekile Bobo (2019). Evaluation of Improved Exotic head Cabbage (Brassica Var Capitata L.) Varieties at Adola Rede Areas, southern Oromia, Ethiopia. Aca demic Research Journal of Agricultural Science and Research. 7(1): 31-36.
[19] Gemechu Ejigu (2024). Evaluation of Improved Exotic Head Cabbage Varieties at Bale high Lands, South Eastern Ethiopia. Ann Agric Crop Sci.; 9(4): 1162.
[20] Samuel H. (2023) Evaluation of Hybrid Cabbage (Brassica oleracea L.) Varieties on Yield and Quality in Gamo Zone, Sothern Ethiopia. J Horti. 10: 005.
[21] Gauch, H. G. and Zobel, R. W. (1996). AMMI Analysis of Yield Trials. In: Kang, M. S. and Gauch, H. G., Eds., Genotype by Environment Interaction, CRC Press, Boca Raton, 85-122.
[22] Yan W. and Manjit (2002). Biplot analysis of multi-environment trial data. In: Quantitative Genetics, Genomics and Plant Breeding. Kang, M. S., (Ed.), CABI Publishing.
[23] Yan W. and Rajcan, I. (2002) Biplot analysis of test sites and trait relations of soybean in Ontario, Crop Science, 42, 11-20.
[24] Ezzatollah F., Hassan Z., and Reza M. (2011). "Evaluation of phenotypic stability in chickpea genotypes using GGE-Biplot." Annals of Biological Research, vol. 2, pp. 282-292.
Cite This Article
  • APA Style

    Assefa, D., Assefa, G., Deresa, D. (2026). Evaluation of Improved Head Cabbage (Brassica oleraceae var capitata oleraceae L.) Varieties for Head Yield in West Hararghe, Eastern Oromia, Ethiopia. American Journal of Plant Biology, 11(3), 45-55. https://doi.org/10.11648/j.ajpb.20261103.12

    Copy | Download

    ACS Style

    Assefa, D.; Assefa, G.; Deresa, D. Evaluation of Improved Head Cabbage (Brassica oleraceae var capitata oleraceae L.) Varieties for Head Yield in West Hararghe, Eastern Oromia, Ethiopia. Am. J. Plant Biol. 2026, 11(3), 45-55. doi: 10.11648/j.ajpb.20261103.12

    Copy | Download

    AMA Style

    Assefa D, Assefa G, Deresa D. Evaluation of Improved Head Cabbage (Brassica oleraceae var capitata oleraceae L.) Varieties for Head Yield in West Hararghe, Eastern Oromia, Ethiopia. Am J Plant Biol. 2026;11(3):45-55. doi: 10.11648/j.ajpb.20261103.12

    Copy | Download

  • @article{10.11648/j.ajpb.20261103.12,
      author = {Dagne Assefa and Gezahegn Assefa and Dereje Deresa},
      title = {Evaluation of Improved Head Cabbage (Brassica oleraceae var capitata oleraceae L.) Varieties for Head Yield in West Hararghe, Eastern Oromia, Ethiopia},
      journal = {American Journal of Plant Biology},
      volume = {11},
      number = {3},
      pages = {45-55},
      doi = {10.11648/j.ajpb.20261103.12},
      url = {https://doi.org/10.11648/j.ajpb.20261103.12},
      eprint = {https://article.sciencepublishinggroup.com/pdf/10.11648.j.ajpb.20261103.12},
      abstract = {Cabbage (Brassica olearacea var capitata L.) is one of the most important leafy vegetables worldwide and is adapted to cool, moist conditions. This study aimed to identify high-yielding, disease-tolerant and adaptable cabbage varieties suitable for the study areas. Four head cabbage varieties (Chaka, Tana, Cabbice and Copenhagen Market) were evaluated using randomized complete block design with four replications. The experiment was conducted in Chiro, Tulo and Oda bultum districts during 2023 and 2024 cropping season. The results of the combined analysis of variance (ANOVA) showed the presence of highly significant (P-1, followed by Tana variety (100.38t ha-1). In contrast, the lowest total head yield (92.52 t ha-1) was recorded from Copenhagen Market variety. AMMI analysis showed that the effect of environments, varieties and their interaction effects were highly significant. The stability and yield performance of the varieties were further explained using a GGE bi-plot. Significant variation in head yield among the varieties was observed across different environments. Cabbice variety exhibited wide adaptability and superior yield performance across high yielding environments. Generally, the study indicated that Cabbice variety was recommended for the study areas and other similar ago-ecologies for further demonstration and scaling up.},
     year = {2026}
    }
    

    Copy | Download

  • TY  - JOUR
    T1  - Evaluation of Improved Head Cabbage (Brassica oleraceae var capitata oleraceae L.) Varieties for Head Yield in West Hararghe, Eastern Oromia, Ethiopia
    AU  - Dagne Assefa
    AU  - Gezahegn Assefa
    AU  - Dereje Deresa
    Y1  - 2026/07/22
    PY  - 2026
    N1  - https://doi.org/10.11648/j.ajpb.20261103.12
    DO  - 10.11648/j.ajpb.20261103.12
    T2  - American Journal of Plant Biology
    JF  - American Journal of Plant Biology
    JO  - American Journal of Plant Biology
    SP  - 45
    EP  - 55
    PB  - Science Publishing Group
    SN  - 2578-8337
    UR  - https://doi.org/10.11648/j.ajpb.20261103.12
    AB  - Cabbage (Brassica olearacea var capitata L.) is one of the most important leafy vegetables worldwide and is adapted to cool, moist conditions. This study aimed to identify high-yielding, disease-tolerant and adaptable cabbage varieties suitable for the study areas. Four head cabbage varieties (Chaka, Tana, Cabbice and Copenhagen Market) were evaluated using randomized complete block design with four replications. The experiment was conducted in Chiro, Tulo and Oda bultum districts during 2023 and 2024 cropping season. The results of the combined analysis of variance (ANOVA) showed the presence of highly significant (P-1, followed by Tana variety (100.38t ha-1). In contrast, the lowest total head yield (92.52 t ha-1) was recorded from Copenhagen Market variety. AMMI analysis showed that the effect of environments, varieties and their interaction effects were highly significant. The stability and yield performance of the varieties were further explained using a GGE bi-plot. Significant variation in head yield among the varieties was observed across different environments. Cabbice variety exhibited wide adaptability and superior yield performance across high yielding environments. Generally, the study indicated that Cabbice variety was recommended for the study areas and other similar ago-ecologies for further demonstration and scaling up.
    VL  - 11
    IS  - 3
    ER  - 

    Copy | Download

Author Information
  • Abstract
  • Keywords
  • Document Sections

    1. 1. Introduction
    2. 2. Materials and Methods
    3. 3. Results and Discussion
    4. 4. Conclusion and Recommendation
    Show Full Outline
  • Abbreviations
  • Acknowledgments
  • Author Contributions
  • Conflicts of Interest
  • References
  • Cite This Article
  • Author Information