Research Article | | Peer-Reviewed

Numerical Modelling and Analysis of the Spectral Response and Performance of Single-Junction InGaN Solar Cells Under Monochromatic Illumination

Received: 2 August 2026     Accepted: 13 August 2026     Published: 24 September 2026
Views:       Downloads:
Abstract

In this work, a comprehensive numerical study of the optoelectronic properties of a single-junction photovoltaic (PV) solar cell is presented. The influence of the indium composition, active-layer thickness, and illumination wavelength on the device performance parameters is investigated. The results show that increasing the illumination wavelength broadens the spectral response and enhances optical absorption, with the absorption coefficient reaching for x ≈ 1. However, for indium compositions above 0.5, degradation of the crystalline quality leads to an increase in Shockley–Read–Hall non-radiative recombination, reducing the effective carrier generation rate g (cm-3·s-1) despite the improved optical absorption. Analysis of the photocurrent and output power reveals an optimal base thickness of 1.5 µm, beyond which recombination losses become dominant. The external quantum efficiency exhibits a minimum value of 94.7% around x ≈ 0.2 before increasing to 97.1% for indium-rich compositions, indicating that absorption becomes increasingly concentrated within the depletion region, thereby enhancing carrier collection. Current–voltage characteristics show a gradual decrease in the open-circuit voltage from 2.793 V to 2.245 V and a slight reduction in current from 0.0679 A to 0.06658 A as x increases from 0.1 to 0.2, highlighting a fundamental trade-off between optical absorption and output voltage. A maximum power conversion efficiency of approximately 28% is achieved for x ≈ 0.13 at an illumination wavelength of λ = 0.68 µm. These findings identify the optimal operating conditions of the device and provide valuable insights for the design of high-efficiency InGaN multi-junction solar cells.

Published in American Journal of Physical Chemistry (Volume 15, Issue 3)
DOI 10.11648/j.ajpc.20261503.11
Page(s) 61-71
Creative Commons

This is an Open Access article, distributed under the terms of the Creative Commons Attribution 4.0 International License (http://creativecommons.org/licenses/by/4.0/), which permits unrestricted use, distribution and reproduction in any medium or format, provided the original work is properly cited.

Copyright

Copyright © The Author(s), 2026. Published by Science Publishing Group

Keywords

InGaN Solar Cell, Indium Composition, Optical Absorption, External Quantum Efficiency, Spectral Response, Numerical Modelling

1. Introduction
InGaN-based solar cells have attracted significant interest in the field of photovoltaic energy conversion due to their exceptional optoelectronic properties and their tunable bandgap, which can be modified by varying the indium content. A thorough understanding of their spectral response under monochromatic illumination is essential for optimizing device performance and improving photovoltaic conversion efficiency .
Several studies have shown that the indium content strongly influences the optical and electronic properties of InGaN solar cells. For example, Anderson et al. modeled carrier generation profiles using comprehensive optoelectronic simulations of non-uniform InGaN structures, thereby highlighting the crucial role of spatial variations in material properties on carrier generation mechanisms . Research on optimizing the absorption coefficient as a function of doping and thickness confirms that spectral absorption and interband transitions are sensitive to the indium fraction . Furthermore, recent studies on InN/InGaN heterostructures have demonstrated that the indium composition determines the shift in absorption peaks and the strength of optical transitions, which in turn directly affects the generation of photogenerated carriers . This approach enables a quantitative analysis of the influence of the indium mole fraction (x), base thickness (z), and incident wavelength (λ) on the device performance .
The results of this study are based on a comprehensive theoretical modeling of a single-junction InxGa(1-x)N solar cell, limited to the base region. The optical and electronic parameters, which depend on the indium composition and wavelength, are first determined in order to evaluate the carrier generation rate. Minority carrier transport is then described using a dynamic diffusion equation that incorporates the effects of recombination and frequency modulation.
The analytical solution, combined with the interface boundary conditions, allows us to extract the carrier density profiles and photovoltaic parameters analyzed in the following sections.
Analysis of the carrier generation rate as a function of wavelength reveals the occurrence of a maximum at λ = 0.68 µm, obtained for an indium composition x ≈ 0.1 and a base thickness z = 1.5 µm, indicating the existence of an optimal spectral condition. At this optimum point, the conversion efficiency reaches η ≈ 28%. In comparison, at both shorter wavelengths (λ = 0.52 µm) and longer wavelengths (λ = 0.74 µm), the efficiency decreases to approximately η ≈ 20% .
The optimization of InxGa(1-x)N alloys is governed by a trade-off between spectral extension, driven by increasing indium content x, and the deterioration of crystalline quality for x > 0.5, which enhances non-radiative recombination and degrades device performance.
This work therefore provides key guidelines for spectral engineering and structural optimization of InGaN solar cells for high-efficiency photovoltaic applications in the visible spectrum.
2. Mathematical Modelling
2.1. Cell Structure
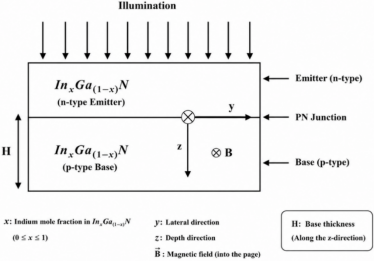
Thanks to the adjustable bandgap of the InGaN alloy (0.7–3.4 eV), which covers a large part of the solar spectrum, the cell under study – with an area of 1 mm² and a bandgap of 2.642 eV – shows great potential for photovoltaic applications . In this study, all calculations were carried out under ideal conditions, under standard AM1.5 solar irradiation (one sun) at a temperature of 300 K, based on the ideal single-diode model.
Figure 1. Schematic diagram of an InGaN-based solar cell under monochromatic illumination.
2.2. Analysis of Physical Parameters
2.2.1. Analysis of Optical Parameter
This section is devoted to the study of the optical parameters, including the bandgap energy, absorption coefficient, and refractive index .
2.2.2. Bandgap Energy
The bandgap energy Eg(x) of the InxGa(1-x)N alloy depends on the indium fraction x. It is given by the following relation:
Eg(x) = x · Eg(InN) + (1 - x) · Eg(GaN)  - b·x(1 - x)(1)
where the bandgap energies of InN (Eg(InN) ) and GaN (Eg(GaN) ) are 0.7 eV and 3.42 eV, respectively, and b is the bowing parameter (b = 1.43 eV) .
2.2.3. Absorption Coefficient
The absorption coefficient is a function of both the indium composition and the incident photon energy, and is given by :
α(λ, x) = 105.[C(x)(Eph - Eg(x)) + D(x)(Eph - Eg(x))2] (2)
Where Eph denotes the incident photon energy, given by Eph = 1.24/λ, with λ being the wavelength expressed in micrometers (µm).
C(x) = 3,525 + 18,29x− 40,22x2+ 37,52x3− 12,77x4(3)
D(x) = 0,6651 − 3,616x+ 2,46x2(4)
2.2.4. Refractive Index
The refractive index of the solar cell is also related to the incident photon energy and the indium fraction as follows :
N(λ, x) = {A(x) · (Eg/Eph)2 · [2 - (1 + Eph/Eg) - (1 - Eph/Eg)] + B(x)} (5)
With
A(x) = 13,55(1 - x) + 9,31x(6)
B(x) = 2,05(1 - x) + 3,03x (7)
The parameters A(x) and B(x) are empirical coefficients that depend on the indium fraction x in the InGaN material. These values are determined by linear interpolation between the properties of pure InN and pure GaN. For InN, the coefficients are A_InN = 13.55 and B_InN = 2.05. For GaN, the coefficients are A_GaN = 9.31 and B_GaN = 3.03. The intermediate values for the InGaN alloy are obtained by linear interpolation as a function of the indium composition .
2.2.5. Electronic Parameters
Electronic parameters are a key element in understanding the electrical behavior of InGaN photovoltaic cells. The joint analysis of these electronic parameters is essential for interpreting and optimizing the photovoltaic performance of the cell .
2.2.6. Intrinsic Concentration
The intrinsic carrier concentration is closely dependent on the indium fraction and can be expressed by the following relation.
ni = (Nc · Nv) · e-Eg/2KbT (8)
Nc = 0, 9x + 1 - x× 2, 3× 1018cm -3(9)
Nv = 5, 3x + 1 - x× 1, 8× 1019cm -3 (10)
with
1) ni: intrinsic carrier concentration
2) Nc: effective density of states in the conduction band
3) Nv: effective density of states in the valence band
4) Kb: Boltzmann constant (1.380649 × 10⁻²³ J/K)
5) T: absolute temperature (K)
2.2.7. Effective Mass
In InxGa(1-x)N alloys, the effective electron mass shows a notable dependence on the indium composition. In particular, increasing the indium fraction x generally leads to a decrease in the effective electron mass .
m*x=0,12.x + 0,2.1 - x (11)
2.2.8. Diffusion Coefficient
Using the Einstein relation and taking into account the effective mass of the carriers, the diffusion coefficient implemented in our numerical simulations is expressed as :
D(x) = Kb.T.τ0,12.x + 0,2.1 + x.m₀ (12)
1) D: represents the diffusion coefficient
2) m₀: is the rest mass of the electron
3) q: represents the elementary charge
4) τ: is the lifetime of the charge carriers
Where (m₀ = 9.1·10-31) represents the free electron mass. Knowing the relation between the mobility of the charge carriers and their effective mass (m*), expressed as:
μ =qτm* (13)
3. Electrical Parameters
The spatial and temporal distribution of minority carriers in the base of the solar cell is described by the following differential equation:
Dω,x,B.∂2δz,t∂z2-δz,tτ=-Gz,α,w,t+∂δz,t∂t (14)
where is the density of minority carriers:
δz, t= δzexpiωt(15)
and is the generation rate
Gx, λ,z = gx, λ,zexpiωt(16)
g(z) and representing the spatial components, and the temporal component. For monochromatic illumination from the front side of the solar cell, the spatial component of the generation rate is given by:
gx, λ,z= αx, λI01 - Rx, λexp- αx, λ.z(17)
where:
gx, λ,z is the incident monochromatic light intensity, R(x) and are respectively the reflection and absorption coefficients at the wavelength.
Dω,x,B is the complex diffusion coefficient of the minority charge carriers :
Dnω,x,B= D0x,B1-ω.τ21-ω.τ22+2ω.τ2+ ω.τ-1-ω.τ21-ω.τ22+2ω.τ2j (18)
where j is the imaginary unit (j² = -1).
D0x,B the diffusion coefficient depending on the indium fraction, the doping rate N, and the magnetic field B .
D0x,B=Dx1+μNB2(19)
μ(N) characterizes the carrier mobility and depends on the doping concentration expressed by :
μᵢN= μₘᵢₙ,ᵢ +μₘₐₓ,ᵢ - μₘᵢₙ,ᵢ1 + NNg,iᵞi (20)
where i represents either electrons (e) or holes (h). is the doping concentration (cm⁻³), is the critical doping concentration of the material (cm⁻³), and is a constant. The values of the corresponding parameters are given in the following table:
Table 1. Parameters used to calculate carrier mobility as a function of doping concentration.

Carrier

Parameter

Value

Electrons

μₘᵢₙ,ᵢ [cm2/V·s]

55

μₘₐₓ,ᵢ [cm2/V·s]

1000

ᵞi

2

Ng,i [cm-3]

2 × 10¹⁷

Holes

μₘᵢₙ,ᵢ [cm2/V·s]

3

μₘₐₓ,ᵢ [cm2/V·s]

170

ᵞi

1

Ng,i [cm-3]

3 × 10¹⁷

By substituting Equations (15), (16), and (17) into Equation (14), we obtain the new equation:
∂2δω, x,Sf,Sb,,H,z,B∂z2-1Lw(ω, x,B)2.δz + gx, λ,zDω, x,,B=0         (21)
Lw(ω, x,B): is the complex diffusion length in the base, defined as :
Lw(ω, x,B)=Dω, x,B.τ1+j.ω.τ (22)
The general solution of Equation (22) is given by:
δω, x,B=A.cosh⁡zLω, x,B+
B.sinh⁡zLω, x,B+K.e-αλ, x.z  (23)
K = αλ, x.I0λ, x.1-Nλ, x.L(ω, x,B2D(ω, x,B)L(ω, x,B)2.α2-1 (24)
The constants A and B are determined from the following boundary conditions:
1) At the back surface
Dω, x,,B. ∂δω, x,Sf,Sb,,H,z,B∂Z|z=H=
-Sb.δω, x,Sf,Sb,,H,z,B|z=H (25)
2) At the junction
Dω, x,,B. ∂δω, x,Sf,Sb,,H,z,B∂Z|z=0=
Sf.δω, x,Sf,Sb,,H,z,B|z=0(26)
4. Results and Discussion
In this study, a numerical analysis of the optoelectronic properties of a single-junction InxGa(1-x)N alloy-based solar cell is carried out, focusing on the influence of key parameters such as the indium fraction x, the incident wavelength λ, the recombination velocity at the junction, and the base thickness H. The simulations are performed under the following conditions: a magnetic field fixed at B = 5 × 10⁻⁵ T, a recombination velocity at the back surface of 2 × 10² cm·s⁻¹, and a doping rate N = 1019 cm-3, in order to isolate the effect of the parameters studied.
4.1. Absorption Coefficient
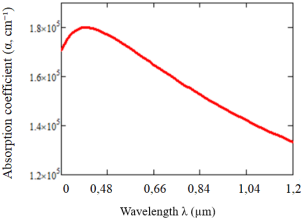
This section analyses the variation of the absorption coefficient as a function of the wavelength. It allows identifying the spectral range efficiently absorbed by the cell for different values of the wavelength a x=0,1.
Figure 2. Impact of wavelength and indium fraction on the absorption coefficient x=0,1.
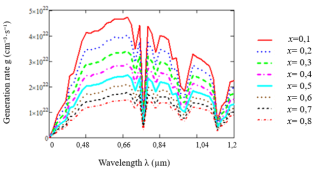
Figure 2 shows that the absorption coefficient α globally decreases with increasing wavelength λ. It reaches a maximum value of approximately 1.8 × 10⁵ cm⁻¹ in the short-wavelength range, then gradually decreases to about 1.3 × 10⁵ cm⁻¹ for λ ≈ 1.2 μm. This evolution reflects the decrease in photon energy: as it approaches the bandgap energy, absorption becomes less efficient .
4.2. Generation Rate
Figure 3 presents the evolution of the optical generation rate g (cm-3.s-1) as a function of wavelength for different values of the indium fraction x in the InxGa(1-x)N alloy. Its expression is defined as follows:
Figure 3. Variation of the carrier generation rate as a function of the normalized wavelength for different indium compositions and depths within the base region (z = 2 µm).
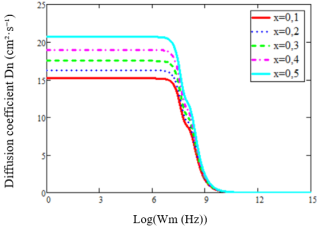
Figure 3 presents the evolution of the optical generation rate g as a function of the wavelength λ for different indium fractions x in the InxGa(1-x)N alloy.
It is observed that, for all compositions, the generation rate increases rapidly at short wavelengths, then reaches a maximum located around λ ≈ 0.68 μm, with values reaching up to g ≈ 5 × 10²² cm⁻³·s⁻¹ for low indium fractions (x ≈ 0.1). This region corresponds to strong optical absorption and efficient generation of electron-hole pairs.
Beyond this zone, the generation rate exhibits fluctuations followed by an overall decrease as the wavelength increases. This decrease is related to the reduction in photon energy, making interband transitions less efficient as the photon energy approaches the bandgap energy.
The influence of the indium fraction is also significant: an increase in x leads to a progressive decrease in the amplitude of the generation rate. Indium-rich compositions (x ≥ 0.5) show lower values of g, which can be attributed to the degradation of the crystalline quality of the material and to the increase in non-radiative recombination mechanisms.
Thus, low indium fractions appear more favourable for high optical generation, reflecting a compromise between efficient absorption and the limitation of recombination losses .
4.3. Diffusion Coefficient
Figure 4 illustrates the variation of the complex minority-carrier diffusion coefficient, Dn, with the logarithm of the modulation frequency, log (Wm), for various indium mole fractions, x. The angular frequency ω is related to the modulation frequency Wm by ω=2πWm.
Figure 4. Variation of the minority-carrier diffusion coefficient with modulation frequency for various indium mole fractions, under the conditions B=5×10⁻⁵ T.
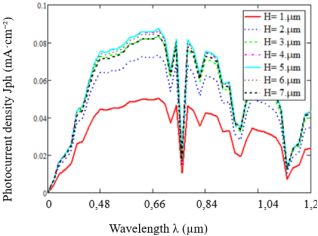
Figure 4 reveals that the minority-carrier diffusion coefficient remains almost constant in the low-frequency region, with values ranging from 15 to 21 cm.s-1 as the indium mole fraction increases from x = 0.1 to x = 0.5. This trend can be attributed to the decrease in the effective mass and the resulting improvement in carrier mobility. For 7 ≤ log (Wm) ≤ 9, a pronounced drop in Dn is observed for all indium compositions, marking the transition to a dynamic transport regime where ωτ ≈ 1. At higher frequencies, carrier transport is significantly hindered, emphasizing the critical role of frequency-dependent transport phenomena in InGaN solar cells.
4.4. Photogenerated Current Density
Figure 5 shows a comparative study of the photocurrent density Jph (defined in equation (27)) as a function of wavelength for seven different values of the active layer thickness H, ranging from H = 1 μm to H = 7 μm, allowing a systematic assessment of how this parameter affects the device's optoelectronic properties.
Jphω,x,t,sb,sf,H,B=q.∂δ(ω,x,t,sb,sf,H,z,B)∂z|z=0 (27)
Figure 5. Photocurrent density profile as a function of wavelength for different values of thickness H for x=0,1, λ = 0,68 µm, B = 5 × 10-5 T, Sb = 2 × 10² cm·s-1 et Wm = 8.108Hz.
For H = 1 μm, Figure 5 shows that all the curves have three regimes: a steady increase of Jph for 0 ≤ λ ≤ 0.48 μm, a maximum plateau between 0.044 and 0.046 A·cm−2 for 0.48 μm ≤ λ ≤ 0.66 μm, and then a decline to residual values for λ > 0.84 μm. Jph increases with H until it saturates at H ≥ 3 μm, while H = 2 μm is a critical threshold below which absorption drops by 15–20%. A dip around λ ≈ 0.66–0.80 μm and oscillations in the 0.84–1.0 μm range reflect, respectively, an optical resonance and interference effects in the layer.
4.5. Current-Voltage Characteristic
Many studies on single-junction InGaN solar cells have shown that increasing the indium fraction improves optical absorption and photocurrent, but it usually comes with a decrease in open-circuit voltage and fill factor, revealing an intrinsic trade-off between current and voltage. . Here’s the expression for the photovoltage:
Vphω,x,t,sb,sf,H,B=1,38.10-23.T1,6.10-19.ln⁡1+Nbni(x)2A.ω,x,t,sb,sf,H,z,B+Kω,x,t,sb,sf,H,z,B(28)
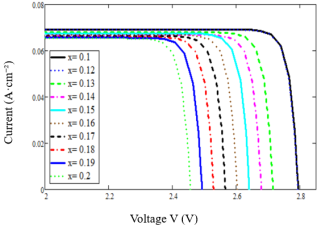
Figure 6. Current-voltage (I-V) characteristics as a function of the indium fraction x for: λ = 0,68 µm, B = 5 × 10-5 T, Sb = 2 × 10² cm·s-1 et Wm = 8.108Hz.
The figure shows that the short-circuit current stays almost constant (JCS ≈ 0.066–0.067 A·cm−2) for x ∈ [0.1; 0.2], as the improvement in optical absorption is balanced by increased recombination . On the other hand, Vco gradually drops from 2.793 V to 2.456 V as x increases, revealing a fundamental trade-off: the gain in current doesn’t make up for the loss in voltage, which limits the performance of the single-junction InGaN cell.
Table 2. Electrical settings extracted from I-V characteristics.

Indium fraction x

λ (μm)

Jsc (A·cm−2)

Voc (V)

0,10

0,68

≈ 0,0679

2,79

0,20

0,68

≈ 0,0668

2,45

4.6. InGaN Cell Power
4.6.1. Optimization of the Indium Fraction
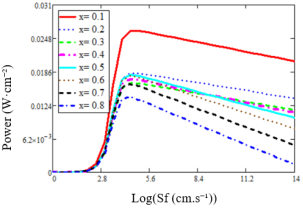
Figure 7 shows how the electric power of an InGaN-based solar cell changes depending on the recombination rate at the Sf junction (cm·s-1), for different indium mole fractions x ranging from 0.1 to 0.8.
Figure 7. Effect of the composition x on the electric power of an InGaN cell for x = 0,1, λ = 0,68 µm, N = 10¹⁹ cm-3, B = 5 × 10-5 T, Sb = 2 × 10² cm·s-1 et Wm = 8.108Hz.
Figure 7 shows the electrical power of the InGaN cell as a function of Sf for different molar fractions x. All the curves show a peak around Sf ≈ 4·10⁴ cm·s-1, followed by a decrease due to surface recombination. The maximum power drops significantly as the indium fraction increases, going from 0.023 W·cm-2 for x = 0.1 to 0.012 W·cm-2 for x = 0.8. This trend confirms that low indium contents provide a better spectral match with the wavelength λ = 0.68 µm, leading to better photovoltaic performance.
4.6.2. Wavelength Optimization
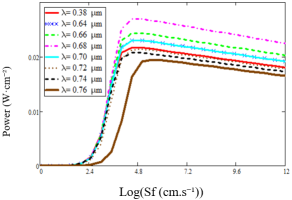
Figure 8 shows the change in the electric power of an InGaN solar cell as a function of the logarithm of the recombination rate at the junction log (Sf), for different wavelengths λ ranging from 0.38 µm to 0.76 µm.
Figure 8. Influence of wavelength on the power of InGaN cells for Wm = 8 × 10⁸ Hz, x = 0,1, Sb = 2 × 102cm·s-1, H = 1,5 µm et B = 5 × 10⁻⁵ T.
All the curves show a rapid increase in power up to a stable plateau around log (Sf) ≈ 4. Beyond this value, the power decreases slightly due to increasing surface recombinations. The maximum power is obtained for λ = 0.68 µm, with a value close to 0.026 W·cm-2, which indicates an optimal spectral match with the bandgap of the InGaN alloy for x = 0.1. Conversely, wavelengths further from this value, particularly λ = 0.76 µm, lead to the lowest powers due to less efficient absorption of incoming photons. These results highlight the importance of choosing the right illumination wavelength to optimize the photovoltaic performance of the InGaN cell.
4.6.3. Optimizing the Base Thickness
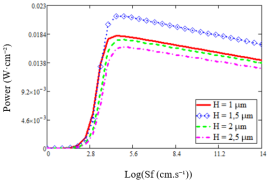
Figure 9. Influence of Thickness on the Power of InGaN Solar Cells at Wm =8×10⁸ Hz, x=0.1, λ=0.68μm, Sb​=2×10²cms−1, and B=5×10⁻⁵T.
Figure 9 presents the electrical power output of the InxGa(1-x)N solar cell as a function of the logarithm of the junction recombination velocity, log (Sf), for various base thicknesses, H, ranging from 1 μm to 2.5 μm. This analysis highlights the influence of the base thickness on the power-generating capability of the device under different recombination conditions.
All the curves show a peak around log (Sf) ≈ 4, followed by a slight decrease due to an increase in surface recombinations. The maximum power increases with the thickness of the base, going from about 0.016 W·cm-2 for H = 1 µm to 0.021 W·cm-2 for H = 1.5 µm. Beyond this value, the power slightly decreases for thicknesses of 2 µm and 2.5 µm. This behaviour can be explained by the fact that an optimal thickness promotes better absorption of incident photons while limiting losses related to carrier diffusion and recombination. Thus, a thickness of H = 1.5 µm appears to be the optimal value for achieving the best photovoltaic performance under the considered simulation conditions.
4.7. External Quantum Efficiency (EQE)
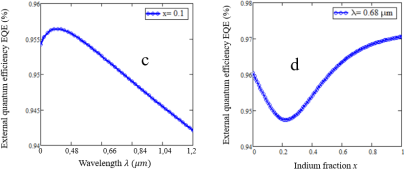
Figure 10 shows the variation in the external quantum efficiency (EQE) (defined by Equation (31)) of an InxGa(1-x)N, plotted both as a function of wavelength for a fixed indium fraction (x = 0.1), and as a function of the indium fraction x for a given wavelength (λ = 0.68 μm), in order to analyse the combined influence of spectral and compositional parameters on the efficiency of photogenerated carrier collection. The external quantum efficiency (EQE) is expressed as follows:
EQE(ω,x,N,B)= αλ, x×Lω,x,N,Bαλ, x×Lω,x,N,B+1(29)
Figure 10. External quantum efficiency (EQE): (c) as a function of wavelength for x = 0.1, (d) as a function of the indium fraction x at λ = 0.68 µm.
The external quantum efficiency of the InxGa(1-x)N cell shows little spectral dependence, with a moderate drop from 95.6% to 94.2% as the wavelength increases (Figure 10c). The EQE rises slightly at short wavelengths, peaks, and then gradually decreases due to the lower photon energy and absorption coefficient near the gap, leading to less efficient carrier generation and collection.
On the other hand, the EQE depends heavily on the indium fraction, hitting a minimum of around 94.7% at about x ≈ 0.2 before rising to 97.1% for indium-rich compositions. The increase in EQE for x > 0.5 (Figure 10d) reflects better carrier collection in the depletion region, while the overall generation rate drops due to non-radiative recombination dominating in the quasi-neutral regions, which explains why EQE can go up even with reduced overall generation.
4.8. Performance Yield
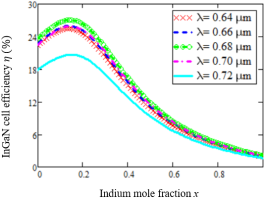
Figure 8 shows how the efficiency of the solar cell changes depending on the indium fraction x for different wavelengths of the solar spectrum. This analysis helps to assess the combined impact of indium composition and spectral response on the overall performance of the cell. Here’s the expression for the efficiency:
ηω,x,t,sb,sf,H,B=Jphω,x,t,sb,sf,H,B×Vphω,x,t,sb,sf,H,B×FFω,x,t,sb,sf,H,BPin(30)
With Pin = 1000 mW.cm-2 for AM1.5 the incident power.
Figure 11. Efficiency of the solar cell as a function of the indium fraction x for different wavelengths: Wm = 8 × 10⁸ Hz, x = 0,1, Sf = 2 × 10² cm·s-1, Sb = 2 × 10² cm·s-1, H= 1,5 µm and B = 5 × 10⁻⁵ T.

The figure shows the evolution of the efficiency as a function of the indium fraction for different wavelengths. For λ = 0.68 µm, the efficiency decreases monotonically with x, dropping from 24% (x = 0.1) to less than 3% (x = 0.9), confirming the dominance of non-radiative recombination losses for indium-rich compositions. In contrast, for λ = 0.72 µm, the efficiency remains systematically lower than the other curves over the entire x range (18.5% at x = 0 versus 24% for the other wavelengths), while following the same decreasing trend, suggesting that absorption in this spectral range remains less favourable for carrier collection. The maximum efficiency (28%) is reached for x ≈ 0.13 with λ = 0.68 µm, identifying this composition as optimal for single-layer applications. The efficiency of about 28% obtained in this study results from a numerical approach based on optimized conditions. Previous studies report similar, or even higher, performances in theoretical models of idealized InGaN cells .
In contrast, current experimental realizations remain limited, with efficiencies generally below 5% due to technological constraints such as crystalline defects and difficulties in p-type doping .
These results should therefore be interpreted as an estimate of the maximum theoretical potential achievable under ideal conditions .
Table 3. Summary of Key Parameters — InxGa(1-x)N Solar Cell.

λ (µm)

x

H (µm)

η (%)

Pmax (W·cm-2)

0,68

≈0,13

1,5

28

≈0,028

0,68

0,2–0,5

1,5

25–12

0,025–0,012

0,68

0,6–1

1,5

<8

≤0,008

This study shows that a composition x ≈ 0.13, a thickness H = 1.5 µm and a wavelength λ = 0.68 µm make it possible to achieve a maximum efficiency of about 28%. Increasing the indium fraction improves optical absorption but promotes non-radiative recombination for x > 0.5. Multi-junction structures constitute a promising path toward improving performance.
5. Conclusion
This study enabled a systematic analysis of the optoelectronic properties of a single-junction InxGa(1-x)N solar cell as a function of the main structural and spectral parameters. The results obtained reveal that increasing the indium fraction improves optical absorption and broadens the spectral response toward longer wavelengths, but is accompanied by a degradation of crystalline quality for x > 0.5, resulting in an intensification of SRH-type non-radiative recombination and a progressive decrease in open-circuit voltage. The power analysis revealed the existence of an optimal base thickness (H ≈ 1.5 µm) beyond which recombination effects dominate the gain provided by additional absorption. The external quantum efficiency, although showing a minimum at x ≈ 0.2, increases for indium-rich compositions, reflecting a concentration of absorption in the depletion region favourable to carrier collection. The maximum conversion efficiency (28%) is obtained for x = 0.13 with λ = 0.68 µm, identifying this composition as optimal for single-junction applications. These results highlight a fundamental trade-off between optical absorption and electrical quality, and suggest that adopting a multi-junction architecture constitutes a promising path to overcome the limitations inherent to the single-junction cell and make more effective use of the solar spectrum.
Abbreviations

AM1.5

Air Mass 1.5 Solar Spectrum

B

Magnetic Field (T)

Dn

Complex Diffusion Coefficient (cm2·s-1)

Eg

Bandgap Energy (eV)

EQE

External Quantum Efficiency

GaN

Gallium Nitride

H

Base Thickness (µm)

InGaN

Indium Gallium Nitride

InN

Indium Nitride

I–V

Current–Voltage Characteristic

Jph

Photogenerated Current Density (A·cm-2)

Jsc

Short-Circuit Current Density (A·cm-2)

LCPM

Laboratory of Chemistry and Materials Physics

LED

Light Emitting Diode

NC

Effective Density of States in the Conduction Band

NV

Effective Density of States in the Valence Band

PV

Photovoltaic

Pmax

Maximum Output Power

Pin

Incident Optical Power

SRH

Shockley–Read–Hall Recombination

Sf

Junction Recombination Velocity

Sb

Back Surface Recombination Velocity

T

Absolute Temperature (K)

Voc

Open-Circuit Voltage (V)

Wm

Modulation Frequency (Hz)

ω

Angular Modulation Frequency (rad·s-1)

λ

Incident Wavelength (µm)

η

Power Conversion Efficiency (%)

Author Contributions
Baboucar Fickou: Conceptualization, Data curation, Formal Analysis, Funding acquisition, Investigation, Methodology, Project administration, Resources, Software, Supervision, Validation, Visualization, Writing – original draft, Writing – review & editing
Sada Traore: Formal Analysis, Methodology, Supervision, Validation
Moussa Camara: Data curation, Investigation, Validation, Visualization
Moustapha Thiame: Conceptualization, Funding acquisition, Methodology, Project administration, Resources, Supervision, Writing – review & editing
Data Availability Statement
The data supporting the findings of this study are available within the article. No additional datasets were generated or analyzed beyond those presented in this manuscript.
Conflicts of Interest
The authors declare no conflicts of interest.
References
[1] F. Z. Bechlaghem and A. Hamdoune, « 3D Simulation and Optimization of Characteristics of Al0.1Ga0.9N/In0.2Ga0.8N High Electron Mobility Transistor with B0.03Ga0.97N Back-Barrier Layer », May 20, 2021, In Review.
[2] M. Nawaz and A. Ahmad, « A TCAD-based modeling of GaN/InGaN/Si solar cells », Semicond Sci Technol, vol. 27, 2012,
[3] T. H. Anderson, A. Lakhtakia, and P. B. Monk, « Optimization of nonhomogeneous indium-gallium-nitride Schottky-barrier thin-film solar cells », J. Photonics Energy, vol. 8, no 03, p. 1, Sept. 2018,
[4] S. Traore, B. Fickou, M. Thiame, and M. Tine, « Optical Optimization of InGaN Solar Cells Via Doping and Thickness Control », Int. J. Sustain. Green Energy, vol. 14, no 3, p. 225‑233, Sept. 2025,
[5] M. Hbibi, S. Chouef, R. Boussetta, A. El Moussaouy, O. Mommadi, and C. A. Duque, « Optical absorption and photovoltaic performance in InN/InGaN multilayer quantum dots: Effects of confinement, in-fraction, and built-in electric field », Sol. Energy, vol. 298, p. 113620, Sept. 2025,
[6] Z. Wei, N. Al-Nuaimi, and S. Gemming, « Optimization of InGaN-based solar cells by numerical simulation: Enhanced efficiency and performance analysis », Mater., vol. 6, p. 100325, Jan. 2025,
[7] A. Mesrane, F. Rahmoune, A. Mahrane, and A. Oulebsir, « Design and Simulation of InGaN p-n Junction Solar Cell », Int. J. Photoenergy, vol. 2015, Jan. 2015,
[8] Li, L., Zhao, D.-G., Jiang, D.-S., Liu, Z.-S., Chen, P., Wu, L.-L., Le, L.-C., Wang, H., & Yang, H.. The effects of InGaN layer thickness on the performance of InGaN/GaN p–i–n solar cells. Chinese Physics B, 22(6), 068802, 2013,
[9] E. Matioli and al., High internal and external quantum efficiency InGaN/GaN solar cells, Appl. Phys. Lett., vol. 98, no 2, p. 021102, jan. 2011,
[10] J. Bai, Y. P. Gong, Z. Li, Y. Zhang, and T. Wang, « Semi-polar InGaN/GaN multiple quantum well solar cells with spectral response at up to 560nm », Sol. Energy Mater. Sol. Cells, vol. 175, p. 47‑51, Feb. 2018,
[11] S. Caron, J. Garrido, J. Ballestrín, F. Sutter, M. Röger, and F. Manzano-Agugliaro, « A comparative analysis of opto-thermal figures of merit for high temperature solar thermal absorber coatings », Renew. Sustain. Energy Rev., vol. 154, p. 111818, Feb. 2022,
[12] Z. Lin et al., « Hierarchical Split Federated Learning: Convergence Analysis and System Optimization », IEEE Trans. Mob. Comput., vol. 24, no 10, p. 9352‑9367, oct. 2025,
[13] B. Fickou, M. Camara, M. Thiame, I. Faye, L. Diatta, and M. Faye, « Modelling and Optimization of the Electrical Parameters of an InxGa1-xN Solar Cell Under Dynamic Frequency Illumination », in Innovations and Interdisciplinary Solutions for Underserved Areas, K. Cheikh M. F. Kebe, A. Gueye, A. Ndiaye, N. A. Sene, and A.-S. Maiga, Ed., Cham: Springer Nature Switzerland, 2025, p. 38‑46.
[14] Y. Zhao, Y. Liu, J. Liu, J. Chen, Y. Hao, T. Lv, S. Huang, L. Cui, Q. Ye, F. Wan et al., «Geometric-mean policy optimization, » in Proc. Int. Conf. Learning Representations (ICLR), vol. 2026, pp. 41354–41374, 2026.
[15] G. F. Brown, J. W. Ager, W. Walukiewicz, and J. Wu, « Finite element simulations of compositionally graded InGaN solar cells », Sol. Energy Mater. Sol. Cells, vol. 94, no 3, p. 478‑483, March 2010,
[16] A. Adaine, S. O. S. Hamady, and N. Fressengeas, « Simulation study of a new InGaN p-layer free Schottky based solar cell », Superlattices Microstruct., vol. 96, p. 121‑133, August 2016,
[17] B. Fickou, M. Thiame, M. Camara, and S. Traore, « Modeling and Optimization of the Electrical Parameters of an InₓGa₁₋ₓN-Based Solar Cell Under Dynamic Frequency Operation and Magnetic Field Influence », in Proceedings of the 3rd West African Conference on Renewable Energies—WACRE 2025; 20–22 November, Saint-Louis, Senegal, A. A. Diouf, D. Diouf, and A. Seidou H. Maiga, Ed., Cham: Springer Nature Switzerland, p. 73‑87, 2026.
[18] E. H. Ndiaye and al., « Study of the Intrinsic Recombination Velocity at the Junction of Silicon Solar under Frequency Modulation and Irradiation », J. Appl. Math. Phys., vol. 3, no 11, p. 1522‑1535, nov. 2015,
[19] Benmoussa, D., Hassane, B., Abderrachid, H.: Simulation of In0.52Ga0.48N Using AMPS 1D, International Renewable and Sustainable Energy Conference (IRSEC), pp.1–5 (2013).
[20] Z. Deng, Y. Jiang, W. Wang, L. Cheng, W. Li, W. Lu, H. Jia, W. Liu, J. Zhou, and H. Chen, “Indium segregation measured in InGaN quantum well layer,” Scientific Reports, vol. 4, no. 1, p. 6734, 2014. Accessed: February 10, 2026. Available at:
[21] Q.-B. Ma, R. Lieten, S. Degroote, M. Germain, and G. Borghs, « Indium-Rich InGaN Films Grown on Ge Substrateby Plasma-Assisted Molecular Beam Epitaxy for Solar Water Splitting », J. Electron. Mater., vol. 44, no 1, p. 202‑209, Jan. 2015,
[22] A. Benslim, A. Meftah, M. Labed, A. Meftah, and N. Sengouga, « Study and optimization of InGaN Schottky solar cell performance », Optik, vol. 247, p. 167984, Dec. 2021,
[23] Shan, H.-S., Li, M.-H., Li, X.-Y., Li, C.-K., Liu, S.-W., Song, Y.-F., Mei, Y.-J., Hao, X.-D., Ma, S.-F., & Xu, B.-S. Evaluation of photoconversion efficiency in InGaN/GaN MQW solar cells at high temperatures. ACS Applied Energy Materials, 6(16), 8503–8510, 2023.
Cite This Article
  • APA Style

    Fickou, B., Traore, S., Camara, M., Thiame, M. (2026). Numerical Modelling and Analysis of the Spectral Response and Performance of Single-Junction InGaN Solar Cells Under Monochromatic Illumination. American Journal of Physical Chemistry, 15(3), 61-71. https://doi.org/10.11648/j.ajpc.20261503.11

    Copy | Download

    ACS Style

    Fickou, B.; Traore, S.; Camara, M.; Thiame, M. Numerical Modelling and Analysis of the Spectral Response and Performance of Single-Junction InGaN Solar Cells Under Monochromatic Illumination. Am. J. Phys. Chem. 2026, 15(3), 61-71. doi: 10.11648/j.ajpc.20261503.11

    Copy | Download

    AMA Style

    Fickou B, Traore S, Camara M, Thiame M. Numerical Modelling and Analysis of the Spectral Response and Performance of Single-Junction InGaN Solar Cells Under Monochromatic Illumination. Am J Phys Chem. 2026;15(3):61-71. doi: 10.11648/j.ajpc.20261503.11

    Copy | Download

  • @article{10.11648/j.ajpc.20261503.11,
      author = {Baboucar Fickou and Sada Traore and Moussa Camara and Moustapha Thiame},
      title = {Numerical Modelling and Analysis of the Spectral Response and Performance of Single-Junction InGaN Solar Cells Under Monochromatic Illumination},
      journal = {American Journal of Physical Chemistry},
      volume = {15},
      number = {3},
      pages = {61-71},
      doi = {10.11648/j.ajpc.20261503.11},
      url = {https://doi.org/10.11648/j.ajpc.20261503.11},
      eprint = {https://article.sciencepublishinggroup.com/pdf/10.11648.j.ajpc.20261503.11},
      abstract = {In this work, a comprehensive numerical study of the optoelectronic properties of a single-junction  photovoltaic (PV) solar cell is presented. The influence of the indium composition, active-layer thickness, and illumination wavelength on the device performance parameters is investigated. The results show that increasing the illumination wavelength broadens the spectral response and enhances optical absorption, with the absorption coefficient reaching  for x ≈ 1. However, for indium compositions above 0.5, degradation of the crystalline quality leads to an increase in Shockley–Read–Hall non-radiative recombination, reducing the effective carrier generation rate g (cm-3·s-1) despite the improved optical absorption. Analysis of the photocurrent and output power reveals an optimal base thickness of 1.5 µm, beyond which recombination losses become dominant. The external quantum efficiency exhibits a minimum value of 94.7% around x ≈ 0.2 before increasing to 97.1% for indium-rich compositions, indicating that absorption becomes increasingly concentrated within the depletion region, thereby enhancing carrier collection. Current–voltage characteristics show a gradual decrease in the open-circuit voltage from 2.793 V to 2.245 V and a slight reduction in current from 0.0679 A to 0.06658 A as x increases from 0.1 to 0.2, highlighting a fundamental trade-off between optical absorption and output voltage. A maximum power conversion efficiency of approximately 28% is achieved for x ≈ 0.13 at an illumination wavelength of λ = 0.68 µm. These findings identify the optimal operating conditions of the device and provide valuable insights for the design of high-efficiency InGaN multi-junction solar cells.},
     year = {2026}
    }
    

    Copy | Download

  • TY  - JOUR
    T1  - Numerical Modelling and Analysis of the Spectral Response and Performance of Single-Junction InGaN Solar Cells Under Monochromatic Illumination
    AU  - Baboucar Fickou
    AU  - Sada Traore
    AU  - Moussa Camara
    AU  - Moustapha Thiame
    Y1  - 2026/09/24
    PY  - 2026
    N1  - https://doi.org/10.11648/j.ajpc.20261503.11
    DO  - 10.11648/j.ajpc.20261503.11
    T2  - American Journal of Physical Chemistry
    JF  - American Journal of Physical Chemistry
    JO  - American Journal of Physical Chemistry
    SP  - 61
    EP  - 71
    PB  - Science Publishing Group
    SN  - 2327-2449
    UR  - https://doi.org/10.11648/j.ajpc.20261503.11
    AB  - In this work, a comprehensive numerical study of the optoelectronic properties of a single-junction  photovoltaic (PV) solar cell is presented. The influence of the indium composition, active-layer thickness, and illumination wavelength on the device performance parameters is investigated. The results show that increasing the illumination wavelength broadens the spectral response and enhances optical absorption, with the absorption coefficient reaching  for x ≈ 1. However, for indium compositions above 0.5, degradation of the crystalline quality leads to an increase in Shockley–Read–Hall non-radiative recombination, reducing the effective carrier generation rate g (cm-3·s-1) despite the improved optical absorption. Analysis of the photocurrent and output power reveals an optimal base thickness of 1.5 µm, beyond which recombination losses become dominant. The external quantum efficiency exhibits a minimum value of 94.7% around x ≈ 0.2 before increasing to 97.1% for indium-rich compositions, indicating that absorption becomes increasingly concentrated within the depletion region, thereby enhancing carrier collection. Current–voltage characteristics show a gradual decrease in the open-circuit voltage from 2.793 V to 2.245 V and a slight reduction in current from 0.0679 A to 0.06658 A as x increases from 0.1 to 0.2, highlighting a fundamental trade-off between optical absorption and output voltage. A maximum power conversion efficiency of approximately 28% is achieved for x ≈ 0.13 at an illumination wavelength of λ = 0.68 µm. These findings identify the optimal operating conditions of the device and provide valuable insights for the design of high-efficiency InGaN multi-junction solar cells.
    VL  - 15
    IS  - 3
    ER  - 

    Copy | Download

Author Information