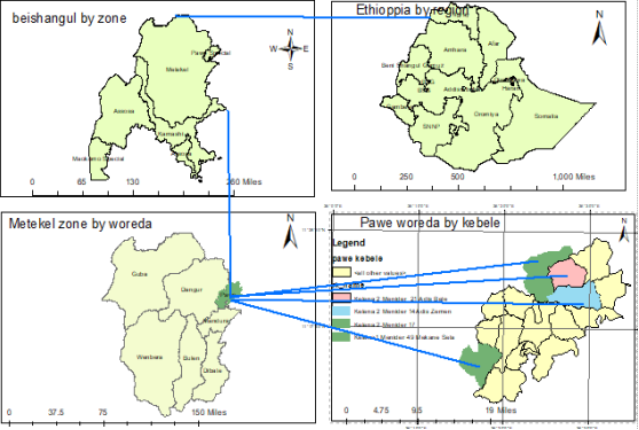
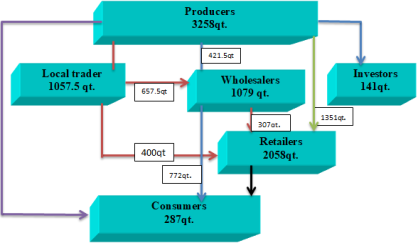
Rice is a new crop in Ethiopia, and demand is increasing. Currently, rice growing areas are quite far from their potential, and the government is forced to import huge quantities of rice to meet domestic consumption due to insufficient production and market supply. The study focused on the factors influencing rice market supply and profitability for smallholder farmers in Pawe, North Western Ethiopia. Purposive and simple sampling techniques were used to choose target kebeles and respondents. The quantitative data were gathered from 185 farmers and 16 traders following triangulation of the qualitative data via focus group discussions and key informant interviews. Descriptive and inferential statistics were used to analyze the quantitative data that comprise gross margin analysis. A multiple linear regression model was used to analyze the factors of rice market supply. The findings revealed that farmers, local traders, wholesalers, and retailers were the main actors in rice marketing in the area. The results showed that retailors obtained the highest gross profit of 289.25 birr from paddy and 580 birr/100kg from milled rice. The regression analysis revealed that education level, farming experience, rice-allocated land, productivity, training, lagged price, and frequency of extension contact are all positively and significantly associated with rice market supply, whereas household size and market distance have been negatively and significantly associated with market supply. Therefore, it needs placing greater focus on each positive and significant variable in order to improve rice market supply and better connect it to rice value chains, ensuring sustainability of market supply.
| Published in | American Journal of Theoretical and Applied Business (Volume 11, Issue 2) |
| DOI | 10.11648/j.ajtab.20251102.11 |
| Page(s) | 21-35 |
| Creative Commons |
This is an Open Access article, distributed under the terms of the Creative Commons Attribution 4.0 International License (http://creativecommons.org/licenses/by/4.0/), which permits unrestricted use, distribution and reproduction in any medium or format, provided the original work is properly cited. |
| Copyright |
Copyright © The Author(s), 2025. Published by Science Publishing Group |
Market Supply, Rice, Multiple Linear Regression Models Margins, Pawe District
Village | Total household | Sample Size | Proportion |
|---|---|---|---|
Village 14 | 565 | 51 | 27.57 |
Village 16 | 365 | 33 | 17.84 |
Village 21 | 425 | 38 | 20.54 |
Village 24 | 701 | 63 | 34.05 |
Total | 2056 | 185 | 100 |
Variables | Type | Measurement | Expected sign |
|---|---|---|---|
Quantity of rice supply | Continuous | The quantity of rice supplied to the market/quintal | |
Age | Continuous | number of years of respondents | -/+ |
Sex | Dummy | 1= male and 2 = female | -/+ |
Education level | Categorical | 1 illiterate, 2 read and write 3 primary school, 4 secondary school 5 preparatory 6 above | + |
Household size | Continuous | Total households members | -/+ |
Farm experience | Continuous | Total number of years in farming | + |
Rice cultivated land | Continuous | Total land allocated for rice/hectare | + |
Productivity | Continuous | Productivity of rice /quintal | + |
Off/non-farm income | Dummy | 1= yes and 2= no | -/+ |
Frequency of extension contact | Categorical | 1 rarely, 2 once a month, 3 twice a month, 4 weekly, 5 daily | + |
Credit | Dummy | 1= yes and 2= no | -/+ |
Training | Dummy | 1= yes and 2= no | + |
Lagd price | Dummy | 1= yes and 2= no | + |
Market information | Dummy | 1= yes and 2= no | + |
Market distance | Continuous | Distance to nearest market in walking minutes | - |
Variables N=185 | Mean | SD. | |
|---|---|---|---|
Age | 46.72 | 9.43 | |
Family size | 4.82 | 1.71 | |
Farm experience | 17.74 | 8.87 | |
Distance_FTC | 29.58 | 19.94 | |
Distance to buy seed | 47.79 | 44.7 | |
Distance to buy fertilizer | 47.21 | 49.68 | |
Nearest market distance | 54.41 | 45.35 | |
Category | Frequency | Percent | |
Sex | Male | 141 | 76.2 |
Female | 44 | 23.8 | |
Variable N=185 | Category | Response | Percent | quantity of rice supply to the market | ||
|---|---|---|---|---|---|---|
Mean | SD | t-value | ||||
On/off farm participation | Yes | 100 | 54.05 | 12.48 | 9.32 | - 4.77*** |
No | 85 | 45.95 | 23.64 | 21.06 | ||
Training | Yes | 46 | 24.86 | 37.55 | 21.75 | 12.78*** |
No | 139 | 75.14 | 11.09 | 6.57 | ||
Access to market information | Yes | 68 | 36.76 | 32.03 | 20.08 | 11.83*** |
No | 117 | 63.24 | 9.22 | 4.35 | ||
Cooperative member | Yes | 103 | 55.68 | 22.56 | 19.25 | 4.77*** |
No | 82 | 44.32 | 11.38 | 9.98 | ||
Access to credit | Yes | 71 | 38.38 | 28.73 | 16.05 | 8.35*** |
No | 114 | 61.62 | 10.68 | 13.07 | ||
Source of variation | Sum of square | Df | Mean square | F | Sig. |
|---|---|---|---|---|---|
Extension contact | |||||
Between group | 11646.67 | 4 | 2911.668 | 13.114 | 0.000 |
Within group | 39965.31 | 180 | 222.029 | ||
Total | 51611.98 | 184 | |||
Education level | |||||
Between group | 22104.97 | 5 | 4420.995 | 26.819 | 0.000 |
Within group | 29507.01 | 179 | 164.844 | ||
Total | 51611.98 | 184 | |||
Expense type | Cost/ha | Share (%) |
|---|---|---|
Purchasing of seed | 1794.23 | 7.75 |
buying of NPS and UREA | 3190.74 | 13.78 |
Purchasing of herbicides | 1083.54 | 4.68 |
Land rent | 1200 | 5.18 |
Land preparation | 400 | 1.73 |
Sowing | 1200 | 5.18 |
Fertilizer application | 400 | 1.73 |
Herbicide application | 400 | 1.73 |
Rented ox | 1777.7 | 7.66 |
Weeding | 3993.03 | 17.24 |
Harvesting | 2571.64 | 11.10 |
Skein collection | 750 | 3.24 |
Threshing | 600 | 2.58 |
Packaging material | 293.88 | 1.27 |
Milling service | 1497.85 | 6.47 |
Transportation to the house | 577.98 | 2.50 |
Market transportation | 1432.27 | 6.18 |
Total production cost | 23162.86 | 100 |
Cost type | Cost of family labor birr/ha | Cost of daily labor birr/ha |
|---|---|---|
Fertilizer application | 400 | - |
Sowing | 600 | 600 |
Herbicide application | 400 | - |
Land preparation | 400 | - |
Weeding | 2267.06 | 1725.97 |
Harvesting | 1289.99 | 1281.65 |
Collecting skein | 600 | |
Total | 5957.05 | 3607.62 |
Rice sold | Production cost/ha | Yield qt/ha | Selling price/qt | TR/ha | GP/100 kg | GP/ha | ||
|---|---|---|---|---|---|---|---|---|
With family labor | Without family labor | With family labor | Without family labor | |||||
Paddy | 21665.01 | 22.23 | 1200 | 26,676 | 225.41 | 493.34 | 5010.99 | 10962.04 |
Milled | 23162.86 | 16.67 | 1834.52 | 30,586.03 | 445.29 | 802.65 | 7423.17 | 13380.22 |
| Actors | Selling price/100 kg | Total cost | GMM | % share GMM | GP | % share |
|---|---|---|---|---|---|---|---|
Paddy | producers | 1200 | 974.58 | 821.04 | 30.70 | 225.42 | 23.85 |
local traders | 1816.67 | 1557.33 | 683.34 | 25.55 | 259.34 | 27.43 | |
Wholesalers | 1825 | 1653.67 | 558.33 | 20.87 | 171.33 | 18.12 | |
retailers | 1837 | 1547.75 | 612 | 22.88 | 289.25 | 30.60 | |
Milled | producers | 1834.52 | 1389.49 | 1185.41 | 33.38 | 445.03 | 22.20 |
local traders | 2630 | 2100 | 850 | 23.94 | 530 | 26.43 | |
Wholesalers | 2650 | 2200 | 757.14 | 21.32 | 450 | 22.44 | |
retailers | 2700 | 2120 | 758.33 | 21.36 | 580 | 28.93 |
Quantity supply of rice | Coef. | St. Err. | t-value | p-value |
|---|---|---|---|---|
Age of household head | -0.066 | .048 | -1.39 | 0.167 |
Sex | -1.673 | 1.619 | -1.03 | 0.303 |
Education level | ||||
Read and wright | 0.605 | 1.379 | 0.44 | 0.661 |
Primary (1-8) | 1.647 | 1.728 | 0.95 | 0.342 |
Secondary (9-10) | 1.884 | 2.159 | 0.87 | 0.384 |
Preparatory | 4.712 | 3.197 | 1.47 | 0.142 |
Above | 3.329* | 1.892 | 1.76 | 0.08 |
House hold size | -0.89*** | .283 | -3.14 | 0.002 |
Farm experience | 0.188*** | .065 | 2.92 | .004 |
Rice cultivated land | 15.384*** | 2.808 | 5.48 | 0.000 |
Productivity | 0.46*** | .142 | 3.23 | 0.001 |
Off_non farm income | -0.635 | .646 | -0.98 | 0.327 |
Frequency of extension contact | . | . | ||
Once a month | 0.626 | 1.116 | 0.56 | 0.575 |
Twice a month | 0.71 | .902 | 0.79 | 0.432 |
Weekly | 4.504* | 2.597 | 1.73 | 0.085 |
Daily | 0.124 | 1.881 | 0.07 | 0.948 |
Credit service | -3.954 | 3.441 | -1.15 | 0.252 |
Training | 2.703** | 1.187 | 2.28 | 0.024 |
Lagd price | 0.003** | .001 | 2.09 | 0.038 |
Market information | 1.375 | 1.076 | 1.28 | 0.203 |
Market distance | -0.021** | .01 | -2.18 | 0.03 |
Constant | -15.079 | 5.893 | -2.56 | 0.011 |
Mean dependent var | 17.611 | SD dependent var | 16.748 | |
R-squared | 0.867 | Number of obs | 185 | |
F-test | 72.802 | Prob > F | 0.000 |
ETB | Ethiopian Birr |
FTC | Farmers Training Center |
GMM | Gross Market Margin |
GP | Gross Profit |
ha. | Hectare |
KG. | Kilo Gram |
OLS | Ordinary Least Square |
Qt. | Quintal |
SD | Standard Deviation |
TR | Total Revenue |
VIF | Variance Inflation Factor |
| [1] | A. K. Mishra et al., “Helping feed the world with rice innovations : CGIAR research adoption and socioeconomic impact on farmers,” Glob. Food Sec., vol. 33, no. March, p. 100628, 2022, |
| [2] | L. Tang et al., “Food security in China: a brief view of rice production in recent 20 years,” Foods, vol. 11, no. 21, p. 3324, 2022. |
| [3] | J. Rodenburg and K. Saito, “Field Crops Research Towards sustainable productivity enhancement of rice-based farming systems in sub-Saharan Africa,” F. Crop. Res., vol. 287, no. September, p. 108670, 2022, |
| [4] | F. Unsal, J. Spray, and C. Okou, “Staple Food Prices in Sub-Saharan Africa: An Empirical Assessment,” 2022. |
| [5] | A. Ibrahim et al., “Seizing opportunity towards sustainable rice cultivation in sub-Saharan Africa,” Environ. Sustain. Indic., vol. 15, p. 100189, 2022. |
| [6] | T. Belayneh and J. Tekle, “Review on Adoption, Trend, Potential, and Constraints of Rice Production To Livelihood in Ethiopia,” Int. J. Res. -GRANTHAALAYAH, vol. 5, no. 6, pp. 644–658, 2017, |
| [7] | A. Assaye, E. Habte, S. Sakurai, and D. Alemu, “Impact assessment of adopting improved rice variety on farm household welfare in Ethiopia,” J. Agric. Food Res., vol. 10, no. October, p. 100428, 2022, |
| [8] | D. Alemu, A. Tesfaye, A. Assaye, and D. Addis, “A HISTORICAL ANALYSIS OF RICE COMMERCIALISATION IN ETHIOPIA : THE CASE OF THE FOGERA PLAIN,” 2018. |
| [9] | D. Wondim, T. Tefera, and Y. Tesfaye, “Determinants of maize market supply, production and marketing constraints: The case of Dembecha district, West Gojjam zone, Ethiopia,” Int. J. Econ. Energy, Environ., vol. 5, no. 5, p. 83, 2020. |
| [10] | S. Usman, J. Haji, and E. Brachi, “Determinants of Wheat Market Supply in Sinana District,” 2021. |
| [11] | H. Deksiso and G. Gebru, “Factors Affecting Teff (Eragrostis tef) Market Supply in Woliso and Becho Districts of South West Shoa Zone Oromia Regional State, Ethiopia,” Agric. Sci., vol. 13, no. 4, pp. 555–565, 2022. |
| [12] | T. Yamane, “Statistics: An introductory analysis,” 1973. |
| [13] | K. Tarekegn, J. Haji, and B. Tegegne, “Factors affecting market supply of honey in Chena district, Kaffa zone, Southern Ethiopia,” J. develpment Agric. Econ., vol. 10, no. 3, pp. 99–109, 2018, |
| [14] | P. Krause, D. P. Boyle, and F. Bäse, “Comparison of different efficiency criteria for hydrological model assessment,” Adv. Geosci., vol. 5, pp. 89–97, 2005. |
| [15] | T. Abrha, B. Emanna, and G. G. Gebre, “Cogent Food & Agriculture Factors affecting onion market supply in Medebay Zana district, Tigray regional state, Northern Ethiopia Factors affecting onion market supply in Medebay Zana district, Tigray regional state,” Cogent Food Agric., vol. 6, no. 1, 2020, |
| [16] | T. A. Delele, A. G. Adugna, and B. M. Gelaw, “Determinants of soybean (Glycine max.) market supply in Northwestern Ethiopia,” Cogent Econ. Financ., vol. 10, no. 1, pp. 0–21, 2022, |
| [17] | K. Haile, E. Gebre, and A. Workye, “Determinants of market participation among smallholder farmers in Southwest Ethiopia: double-hurdle model approach,” Agric. Food Secur., vol. 11, no. 1, p. 18, 2022. |
| [18] | A. Dinku, B. Abebe, A. Lemma, and M. Shako, “Beef cattle value chain analysis: Evidence from West Hararghe Zone of Ethiopia,” Int. J. Agric. Sci. Food Technol., vol. 5, no. 2, pp. 77–87, 2019. |
| [19] | M. Dessie, M. Jailan, H. Mosi, and G. Mekonnen, “Value Chain Analysis of Red Pepper: The Case of Mareko District, Guragie Zone, Southern Ethiopia,” Agric. Res. Technol. Open Access J., vol. 17, no. 2, pp. 31–39, 2018. |
| [20] | A. Ayele, T. Erchafo, A. Bashe, and S. Tesfayohannes, “Value chain analysis of wheat in Duna district, Hadiya zone, Southern Ethiopia,” Heliyon, vol. 7, no. 7, 2021. |
| [21] | R. Dibaba and D. Goshu, “Factors affecting market supply of wheat by smallholder farmers in Ethiopia,” J. Nat. Sci. Res, vol. 19, no. 8, pp. 56–64, 2018. |
| [22] | D. Galtsa, K. Tarekegn, K. Kamaylo, and E. Oyka, “Maize market chain analysis and the determinants of market participation in the Gamo and Gofa Zones of Southern Ethiopia,” Adv. Agric., vol. 2022, 2022. |
| [23] | E. Tadesa, “Determinants of commercialization of teff crop in Abay Chomen District, Horo Guduruwallaga zone, Ethiopia,” J. Agric. Ext. Rural Dev., vol. 12, no. 10, pp. 251–259, 2018. |
| [24] | N. Tamirat and T. Zeleke, “Analysis of onion market value chain among smallholder farmers in rural Ethiopia: a case study of south bench woreda in bench maji zone, Ethiopia,” J. Smart Econ. Growth, vol. 6, no. 1, pp. 49–74, 2021. |
| [25] | A. W. Belayneh, E. G. Yesho, and K. H. Gemeyida, “Determinants of sesame market supply in West Omo and Bench Sheko zones, Southwest Ethiopia,” Int. J. Agron., vol. 2022, 2022. |
| [26] | G. Wosene, M. Ketema, and A. Ademe, “Factors affecting market outlet choices of pepper producers in Wonberma district, Northwest Ethiopia: multivariate probit approach,” Cogent Food Agric., vol. 4, no. 1, p. 1558497, 2018. |
| [27] | O. Sori, “Factors affecting groundnut market supply in Western Oromia, Ethiopia,” Heliyon, vol. 7, no. 1, 2021. |
| [28] | E. N. Hambisa and M. B. Geda, “Factors Affecting Soybean Producers Supply to the Market in Buno Bedele Zone, South Western Ethiopia,” Int. J., vol. 7, no. 1, pp. 245–249, 2020. |
| [29] | T. Atnafu Delele, “Value chain analysis of soybean the case of pawe district, north western Ethiopia.” Bahir Dar University, 2020. |
| [30] | S. Mengesha, D. Abate, C. Adamu, A. Zewde, and Y. Addis, “Value chain analysis of fruits: The case of mango and avocado producing smallholder farmers in Gurage Zone, Ethiopia,” J. Dev. Agric. Econ., vol. 11, no. 5, pp. 102–109, 2019. |
| [31] | T. Kasahun, “Value chain analysis and development: the case of bamboo and honey products from maraka woreda, dawuro, southern Ethiopia,” 2020. |
| [32] | N. Ababulgu, N. Abajobir, and H. Tizazu, “Analysis of the Economy of Beekeeping and Honey Supply in Horo Guduru Wollega Zone, Oromia, Ethiopia,” 2021. |
| [33] | T. Meleaku, D. Goshu, and B. Tegegne, “Determinants sorghum market among smallholder farmers in Kafta Humera district Tigeray Ethiopia,” South Asian J. Soc. Stud. Econ., vol. 8, no. 1, pp. 1–13, 2020. |
| [34] | B. T. Borena, F. Mitiku, and C. Hailu, “Marketable supply of honey: evidence from farmers households in Ethiopia,” J. Agribus. Rural Dev., vol. 64, no. 2, pp. 161–168, 2022. |
| [35] | G. Abebe and S. Debebe, “Factors Affecting Chickpea Market Chain: The Case of Dembia District, North Gondar Zone, Ethiopia,” Transp. P, vol. 66, 2020. |
| [36] | H. Tesfaye, L. Zemedu, and A. Ademe, “Factors Affecting Market Outlet Choice of Kocho Producers in Cheha District, Gurage Zone, Southern Ethiopia,” Dev. Ctry. Stud., vol. 9, pp. 1–9, 2019. |
| [37] | N. Girmalem, S. Negussie, and G. Degye, “Determinants of Mangoes and Red Peppers Market Supply in Ahferom and Kola-Tembien Districts of Tigray Region, Northern Ethiopia,” 2019. |
APA Style
Ayele, T., Abebe, A., Atinafu, T. (2025). Determinants of Rice Market Supply and Profitability on Smallholder Farmers in North Western Ethiopia. American Journal of Theoretical and Applied Business, 11(2), 21-35. https://doi.org/10.11648/j.ajtab.20251102.11
ACS Style
Ayele, T.; Abebe, A.; Atinafu, T. Determinants of Rice Market Supply and Profitability on Smallholder Farmers in North Western Ethiopia. Am. J. Theor. Appl. Bus. 2025, 11(2), 21-35. doi: 10.11648/j.ajtab.20251102.11
@article{10.11648/j.ajtab.20251102.11,
  author = {Talefe Ayele and Azanaw Abebe and Takele Atinafu},
  title = {Determinants of Rice Market Supply and Profitability on Smallholder Farmers in North Western Ethiopia},
  journal = {American Journal of Theoretical and Applied Business},
  volume = {11},
  number = {2},
  pages = {21-35},
  doi = {10.11648/j.ajtab.20251102.11},
  url = {https://doi.org/10.11648/j.ajtab.20251102.11},
  eprint = {https://article.sciencepublishinggroup.com/pdf/10.11648.j.ajtab.20251102.11},
  abstract = {Rice is a new crop in Ethiopia, and demand is increasing. Currently, rice growing areas are quite far from their potential, and the government is forced to import huge quantities of rice to meet domestic consumption due to insufficient production and market supply. The study focused on the factors influencing rice market supply and profitability for smallholder farmers in Pawe, North Western Ethiopia. Purposive and simple sampling techniques were used to choose target kebeles and respondents. The quantitative data were gathered from 185 farmers and 16 traders following triangulation of the qualitative data via focus group discussions and key informant interviews. Descriptive and inferential statistics were used to analyze the quantitative data that comprise gross margin analysis. A multiple linear regression model was used to analyze the factors of rice market supply. The findings revealed that farmers, local traders, wholesalers, and retailers were the main actors in rice marketing in the area. The results showed that retailors obtained the highest gross profit of 289.25 birr from paddy and 580 birr/100kg from milled rice. The regression analysis revealed that education level, farming experience, rice-allocated land, productivity, training, lagged price, and frequency of extension contact are all positively and significantly associated with rice market supply, whereas household size and market distance have been negatively and significantly associated with market supply. Therefore, it needs placing greater focus on each positive and significant variable in order to improve rice market supply and better connect it to rice value chains, ensuring sustainability of market supply.},
 year = {2025}
}
TY  - JOUR
T1  - Determinants of Rice Market Supply and Profitability on Smallholder Farmers in North Western Ethiopia
AU  - Talefe Ayele
AU  - Azanaw Abebe
AU  - Takele Atinafu
Y1  - 2025/06/23
PY  - 2025
N1  - https://doi.org/10.11648/j.ajtab.20251102.11
DO  - 10.11648/j.ajtab.20251102.11
T2  - American Journal of Theoretical and Applied Business
JF  - American Journal of Theoretical and Applied Business
JO  - American Journal of Theoretical and Applied Business
SP  - 21
EP  - 35
PB  - Science Publishing Group
SN  - 2469-7842
UR  - https://doi.org/10.11648/j.ajtab.20251102.11
AB  - Rice is a new crop in Ethiopia, and demand is increasing. Currently, rice growing areas are quite far from their potential, and the government is forced to import huge quantities of rice to meet domestic consumption due to insufficient production and market supply. The study focused on the factors influencing rice market supply and profitability for smallholder farmers in Pawe, North Western Ethiopia. Purposive and simple sampling techniques were used to choose target kebeles and respondents. The quantitative data were gathered from 185 farmers and 16 traders following triangulation of the qualitative data via focus group discussions and key informant interviews. Descriptive and inferential statistics were used to analyze the quantitative data that comprise gross margin analysis. A multiple linear regression model was used to analyze the factors of rice market supply. The findings revealed that farmers, local traders, wholesalers, and retailers were the main actors in rice marketing in the area. The results showed that retailors obtained the highest gross profit of 289.25 birr from paddy and 580 birr/100kg from milled rice. The regression analysis revealed that education level, farming experience, rice-allocated land, productivity, training, lagged price, and frequency of extension contact are all positively and significantly associated with rice market supply, whereas household size and market distance have been negatively and significantly associated with market supply. Therefore, it needs placing greater focus on each positive and significant variable in order to improve rice market supply and better connect it to rice value chains, ensuring sustainability of market supply.
VL  - 11
IS  - 2
ER  -
Department of Agricultural Extension Research, Ethiopian Institute of Agricultural Research, Pawe Agricultural Research Center, Pawe, Ethiopia
Department of Rural Development and Agricultural Extension, College of Agriculture and Environmental Science, Bahir Dar University, Bahir Dar, Ethiopia
Information