Abstract
Road transport remains one of the most economical, accessible, and widely used modes of transportation, requiring relatively low investment while significantly enhancing the aesthetic appeal and functionality of urban and rural areas. A well-designed road network is fundamental to the efficient movement of people, goods, and industrial products, thereby serving as a critical catalyst for socio-economic development. The foundational step in achieving high-quality road infrastructure is the selection of an optimal route, followed by meticulous geometric design—the process of arranging the road layout to satisfy user requirements, safety standards, and operational efficiency. Key design controls include topography, traffic volume, design speed, roadway capacity, design vehicle characteristics, and access management. The Ethiopian Road Authority (ERA) provides ten geometric design standards; based on the Annual Average Daily Traffic (AADT), ground slope, and road classification, Design Class 5 (DC5) was selected for this project. The critical problem addressed in this study is the complete absence of a properly designed road connecting Gidami to Begi, which severely restricts access to education, healthcare, markets, and other essential services for the local community. This research utilized Eagle Point software to process total station survey data and produce comprehensive design outputs, including plans, profiles, curve data, coordinate tables, elevation models, contour maps, and mass haul diagrams. The project encompasses a total length of 52 kilometers from Gidami to Begi. Earthwork calculations revealed a total fill volume of 9,374.948 m3, a cut volume of 515.769 m3, a cut area of 2,675.811 m2, and a fill area of 45,145.11 m2. The complete geometric design includes horizontal and vertical alignments, cross-section elements, superelevation details, and sight distance analyses, all developed in strict accordance with the ERA Geometric Design Manual (2013).
Keywords
Design Standard, Geometric Design, Horizontal Alignment, Vertical Alignment, Eagle Point Software, Highway Engineering, ERA Manual
1. Introduction
Road transport stands as the backbone of economic growth and daily life—affordable, accessible, and visually impactful on a city's character and regional connectivity. Recognizing this fundamental importance, the Ethiopian government has prioritized highway construction and rehabilitation since 1997
| [1] | Rychatrova, J. Manual on user benefit analysis of highway. Tanzania: International; 1987, pp. 25–67. |
[1]
. Despite the substantial demands of funding, skilled labor, heavy machinery, and advanced technology, the benefits of well-constructed roads are far-reaching and transformative.
Roads facilitate the efficient movement of people and goods, stimulate trade and economic activities, support national defense and security operations, enable access to education and healthcare services, strengthen law enforcement capabilities, and act as essential feeders to railways, airways, and waterways
| [2] | Gibreel, G. M., Easa, S. M., & El-Dimeery, I. A. Geometric design. America: International Journals; 2003, p. 65. |
[2]
. Furthermore, roads unlock access to natural resources such as minerals, agricultural products, and tourism destinations, requiring relatively low investment compared to other transport modes while offering the unique advantage of door-to-door service.
The route connecting Gidami to Begi is rapidly gaining economic, social, and political importance. It serves the surrounding community by linking key infrastructure, markets, educational institutions, and healthcare facilities. Yet, this route—if it can even be called a road—remains poorly constructed, narrow, and unsafe. For students, residents, and travelers who rely on it daily, the route has become notorious for wasting time, draining energy, and posing significant safety risks. A properly designed road would transform this area, offering quick, safe, and reliable access to education and vital services while unlocking the full economic and social potential of the region.
1.1. Statement of the Problems
As one of the most common and accessible modes of transportation worldwide, roads play an essential role in moving people and goods from place to place. Beyond mere connectivity, roads form the basic infrastructure that fuels socio-economic development, offering door-to-door service to citizens of all financial backgrounds and fostering national integration.
The road proposed for design directly connects Gidami with Begi town—two locations of growing strategic importance. This route must be built to established standards, capable of safely and efficiently serving vehicle traffic while accommodating future growth. Currently, the existing path suffers from numerous critical deficiencies:
-Insufficient width that fails to accommodate two-way traffic safely, Complete absence of safety curves, increasing accident risks, No retaining walls or slope stabilization measures, Poor drainage facilities, leading to road deterioration during rainy seasons, Overall poor service quality** that discourages use and economic activity.
The absence of a proper road linking these two important locations imposes a heavy burden on students, who cannot freely access educational opportunities, and on the community, which is cut off from essential services and economic opportunities. Furthermore, this road would be especially beneficial in connecting the broader community around that area, facilitating agricultural marketing, healthcare access, and social integration.
For these compelling reasons, the Ethiopian Roads Authority should approve and implement the proposed road design without delay.
1.2. Objective of the Thesis
1.2.1. General Objective
The general objective of this thesis is to prepare a comprehensive geometric design of the highway from Gidami to Begi, based on the Ethiopian Roads Authority (ERA) 2013 Geometric Design Manual, utilizing Eagle Point software for data processing and design visualization.
1.2.2. Specific Objectives
The specific objectives of this thesis are to:
Design the road by providing all elements of geometric design, including horizontal and vertical alignments, cross-section elements, and superelevation details.
Prepare plan and profile views that clearly represent the proposed road alignment in both horizontal and vertical dimensions.
Identify earthwork quantities including cut and fill volumes and areas.
Generate comprehensive design outputs including coordinate tables, curve data, and mass haul diagrams.
Ensure compliance with ERA 2013 design standards and safety requirements.
2. Literature Review
Geometric design is the process whereby the layout of the road through the terrain is designed to meet the needs of the users. It is an essential component in the design and development of highways
| [3] | Sayed, T., & Easa, S. M. Geometric design considerations. (2000). 25-32. |
[3]
. Highway geometric design primarily refers to the visible elements of the highways, including the road cross-section components, horizontal and vertical alignment. Taken as a whole, the quality and appearance of a road is determined by the quality of the geometric alignment design and its relationship to the surrounding environment
| [4] | AASHTO (American Association of State Highway and Transportation Officials). Guide for the development of bicycle facilities. North America: AASHTO; 1997. 10-12. |
[4]
.
The physical location of a highway for design and construction is developed and dimensioned with respect to a calculated centerline that is expressed in terms of bearings, distance, curvature, transition stations, and offsets
| [5] | Abebe, A., & Tammew, A. A. Highway engineering. Nekemt, Ethiopia: Mega; 2011. *(Note: "HIGY=HWY" corrected to "Highway"; pp 34. |
[5]
. This numerically derived centerline information is collectively referred to as the geometric design. Geometric aspect of the route is designed to provide a safe, accident-free, and comfortable road for drivers. Hence, the location of the road should compromise the facts that it should be short, economical, easy, and safe for construction, maintenance, and operation. It is also necessary to consider the volume and composition of traffic when selecting the design standard for the road
| [6] | Kadyali, L. R., & Lal, N. B. Principles and practices of highway engineering. 6th ed. New Delhi: Khanna Publishers; 2013. 65-69. |
[6]
.
2.1. Design Controls and Criteria
There are certain basic design controls and criteria which govern the geometric features of highways. Highway engineers who design the geometry must also consider environmental and social effects of the design on the surrounding infrastructure
| [7] | ERA (Ethiopian Roads Authority). Geometric design manual: Design controls and criteria. Addis Ababa: ERA; 2002, p. 6. |
[7]
. There are several considerations that must be properly addressed in the design process to successfully fit a highway to a site's topography and maintain its safety. Some of these design considerations include topography, traffic factors, design speed, capacity, design vehicle, and control of access
| [8] | ERA (Ethiopian Roads Authority). ERA geometric design manual. Addis Ababa: ERA; 2013. Pp 90. |
[8]
.
2.1.1. Topography
Topography and physical features play an important role in the location and design of a highway. The various design elements should be related to topographical features if an economical and sound design is to emerge
| [9] | Garber, N. J., & Hoel, L. A. Traffic and highway engineering. Geometric design chapter. (2001). Pp56. |
[9]
. The classification of the terrain is normally done by means of the cross slope of the country; the slope approximately perpendicular to the center line of the highway location.
It determines in fixing the gradient of the roads. In hilly terrain, steeper gradients and sharp curves should be allowed by keeping the required minimum standard. Four categories have been defined which apply to all roads
| [9] | Garber, N. J., & Hoel, L. A. Traffic and highway engineering. Geometric design chapter. (2001). Pp56. |
[9]
:
1) Terrain Classification: Flat Terrain: 0-10 five-meter contours per kilometer; traverse ground slope generally below 3%, Rolling Terrain: 11-25 five-meter contours per kilometer; traverse ground slope generally between 3% and 25%
2) Mountainous Terrain: 26-50 five-meter contours per kilometer; traverse ground slope generally above 25%
3) Escarpment Terrain: More than 50 five-meter contours per kilometer; traverse ground slope generally greater than 50%
Terrain class needs to be established before a road is designed; hence it needs to be defined independently of the alignment that is finally selected for the road. It is determined by counting the number of 5-meter contours crossed by a straight line connecting the two ends of the road section in question
| [10] | Kutz, M. Handbook of transportation engineering. New York, NY: McGraw-Hill; 2011. |
[10]
.
2.1.2. Traffic Factor
Vehicular characteristics related to cars, buses, trucks, and motorcycles all have different speed and acceleration characteristics. The same traffic behavior is also affected by physical, mental, and psychological characteristics of drivers and pedestrians
| [10] | Kutz, M. Handbook of transportation engineering. New York, NY: McGraw-Hill; 2011. |
[10]
.
Design hour volume: The general unit of measuring traffic on highway is the Annual Average Daily Traffic Volume (AADT). It is equal to the total annual volume of traffic divided by the number of days in the year.
2.1.3. Functional Classification of the Road
Roads are classified in terms of their actual or intended uses within the network as a whole. These categories define their design adoption and management standards. Separate design standards are appropriate for different classes of roads, since the classes serve different types of trips and operate under different conditions of both speed and traffic volume.
According to ERA, road functional classifications are:
1) Trunk Roads: Connecting centers of international importance and roads terminating at international boundaries; AADT of 10,000-15,000
2) Link Roads: Connecting centers of national/international importance such as principal towns and urban centers; AADT of 400-1,000
3) Main Access Roads: Connecting centers of provincial importance; AADT of 30-1,000
4) Collector Roads: Linking locally important centers to each other, to a more important center, or to higher class roads; AADT of 25-400
5) Feeder Roads: Linking to a minor center such as market and local locations; AADT less than 100
2.2. Elements of Geometric Design
Geometric design is the most important part of highway design to give safe and comfortable roadway to the driver and the passenger. Some elements of geometric design are horizontal alignment, sight distance, vertical alignment, and cross-section elements
| [11] | Yu, B., & Cheng, J. Road survey and design. Singapore: Springer; 2019. |
[11]
.
2.2.1. Horizontal Alignment
Horizontal alignment in road design consists of straight sections of road, known as tangents, connected by circular horizontal curves. Circular curves are defined by radius (tightness) and deflection angle (extent). The design of a horizontal curve entails the determination of a minimum radius (based on speed limit), curve length, and objects obstructing the view of the driver
| [12] | Chakroborty, P., & Das, A. Principles of transportation engineering. New Delhi: Prentice Hall India; 2017. |
[12]
.
2.2.2. Sight Distances
Road geometry affects the sight distance available to the driver. Sight distance, in the context of road design, is defined as "the length of roadway ahead visible to the driver." Sight distance is how far a road user (usually a vehicle driver) can see before the line of sight is blocked by a hill crest, or an obstacle on the inside of a horizontal curve or intersection. Insufficient sight distance can adversely affect the safety or operations of a roadway or intersection
| [12] | Chakroborty, P., & Das, A. Principles of transportation engineering. New Delhi: Prentice Hall India; 2017. |
[12]
.
The sight distance needed for a given situation is the distance traveled during the two phases of a driving maneuver: perception-reaction time (PRT) and maneuver time (MT). Perception-reaction time is the time it takes for a road user to realize that a reaction is needed to a road condition, decide what maneuver is appropriate, and start the maneuver. Maneuver time is the time it takes to complete the maneuver. The distance driven during perception-reaction time and maneuver time is the sight distance needed
| [13] | Khanna, S. K., Justo, C. E. G., & Veeraragavan, A. Highway engineering. Roorkee: Nem Chand & Bros; 2017. |
[13]
.
During highway design and traffic safety investigations, highway engineers compare the available sight distance to how much sight distance is needed for the situation. Depending on the situation, one of three types of sight distances will be used: stopping sight distance, passing sight distance, or brake reaction distance
| [13] | Khanna, S. K., Justo, C. E. G., & Veeraragavan, A. Highway engineering. Roorkee: Nem Chand & Bros; 2017. |
[13]
.
3. Material and Methods
3.1. Description of the Project Area
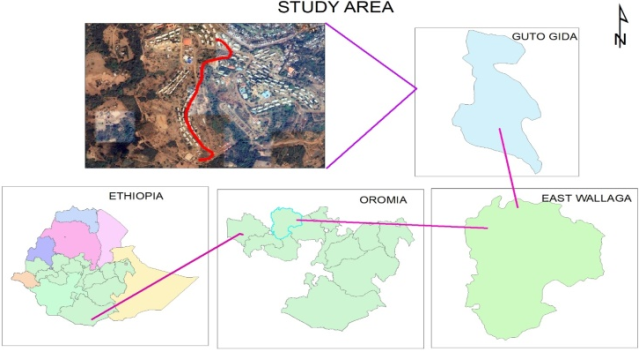
This project was conducted at Wallaga University, East Wallaga Zone, western Ethiopia, located 328 km west of Addis Ababa (the capital city). Nekemte has geographical coordinates of 9°05' N latitude and 36°33' E longitude, with an altitude of 2,088 meters above sea level. The average annual temperature of the city ranges from 14°C to 26°C, with yearly rainfall of 1,500 to 2,200 mm.
The road alignment begins at Gidami and extends to Begi, covering a total length of 52 kilometers, with the section under detailed design located at Wallaga University, from the Biology Laboratory to the WU Mini Stadium, covering approximately 1+311.336 km.
Figure 1. Location map of the project area Source (Google map2026).
3.2. Materials
The data collected for this project was categorized into two types: primary and secondary. Primary data collection involved the use of a Total Station instrument. The following table describes the materials and their purposes in detail:
Table 1. Materials and their Purposes.
No | Item | Purpose |
1 | Total station | Collection of raw survey data |
2 | Download cable | Transfer of data from instrument to computer |
3 | Reflector (prism) | Target for total station measurements |
4 | Computer | data analysis and design processing |
5 | Measuring tape | Manual measurements |
6 | Tripod | Support for total station |
7 | Mobile phone | Photo capture and documentation |
8 | Eagle point Software | Data processing, design and visualizations |
3.3. Methods
The project was managed to carry out route surveying and geometric design of a road in the selected area. To accomplish the objectives, different methods and procedures were employed.
3.4. Field Work
3.4.1. Reconnaissance Survey
There are two stages of reconnaissance survey: desk study and site reconnaissance.
Desk Study: The first stage involved studying available maps of the area to identify important features such as rivers, cultivation areas, valleys, hills, and other significant landmarks. Routes or alignments were selected keeping in view of the topographic features and obligatory points to be touched by the road. In the map, villages, water courses, churches, mosques, and other features were clearly identified.
The selected route aimed to:
1) Incorporate more places of importance
2) Cross minimum number of water courses
3) Not cross obligatory points like stadiums, churches, and mosques
4) Have recommended bridges at river crossings
Site Reconnaissance: The second stage involved site reconnaissance to examine the general character of the area for deciding the most feasible routes for detailed studies. This included collection of information about soil type, geological structures, drainage patterns, ecology, and land usage. This information helped in selecting the best possible scheme as it provided a general impression of the terrain.
Generally, during reconnaissance survey the following operations were performed:
1) Examination of terrain to be surveyed
2) Selection of suitable positions for control points
3) Determination of visibility of benchmark
4) Collection of miscellaneous information regarding access to various stations, transport facilities, availability of food, water, and labor
3.4.2. Preliminary Survey
The preliminary survey consisted of running an accurate traverse line along the routes already recommended as a result of reconnaissance survey to obtain sufficient data for final location.
Main Objectives of Preliminary Survey:
1) To survey the various alternate alignments proposed after the reconnaissance and to collect all the necessary physical information and details of topography, drainage, and soil
2) To compare the different proposals in view of the requirements of a good alignment
3) To estimate the quantity of earth work materials and other construction aspects and to work out the cost of alternate proposals
4) To finalize the best alignment from all considerations
3.4.3. Final Location Survey
The purpose of the final location survey was to fix the centerline of the selected alignment in the field and to collect additional data for the preparation of drawings.
The following were the general features of the final location survey: Pegging the center line, Center line leveling, Cross section surveys, Survey of ditches and streams.
3.4.4. Data Collection
The conducted practical field survey studied from the reference control points (BM6 & BM7) from Gidami to Begi along sufficient width and straight center to the selected route. The cross-section data was collected perpendicular to every centerline interval of 20 meters. The cross-sectional data interval was not constant; it depended on the terrain variation. For flat terrain, a 10-meter interval was used, and for non-flat terrain, measurements were taken at every change in topography, perpendicular to the centerline, with a width of 15 meters on each side.
All data was collected using the Total Station (Trimble), prism (reflector), and tapes.
3.5. Office Work
3.5.1. Downloading Process
The transferring of collected road data from Trimble Total Station to the computer was accomplished through a transfer cable. First, the data was stored in a specified folder in the instrument, then the instrument was connected to the computer, and finally the data was downloaded using data transfer software. After downloading, the data appeared as point features, which were selected and exported into CAD software to be stored in CSV format.
3.5.2. Selection of Design Standard
The ERA Geometric Design Manual contains the complete design standards for highway construction as approved by the Ethiopian Roads Authority. ERA has ten geometric design standard parameters for road design. Design Standard (DS) can be selected based on AADT, slope of ground, and road classification. Based on the road classification and other parameters, DS5 was selected for this project.
3.5.3. Data Processing and Analyzing
Data processing is one of the procedures of surveying operation. The process can be carried out through manual methods or computer-based software applications. This alternative depends on cost, time, and accuracy. Accurate and time-effective data processing was achieved through computer-based software application.
In this project, the process was carried out using Eagle Point Software, which has high capability for the production of road design with effective accuracy and time efficiency—from the beginning of data downloading to the final output of earth quantity calculations.
3.5.4. Design Processing
This was the practical application of office work involving the process of route selection and geometric design performed through Eagle Point Software, using permissible parameters of the selected ERA DC5 criteria.
The process started by initializing Eagle Point Software with project description and supported file name. After adjusting every unit and formula required in data processing, the CSV-formatted data was transferred to Eagle Point, appearing with alphanumerical description points supported by CAD application.
3.6. Requirements of an Ideal Alignment Between Two Terminals
3.6.1. Steps for Best Route Selection
Know the terrain points of the scheme, from the study of the map of the area, identify and locate protected areasConduct reconnaissance and preliminary surveys and collect information on predetermined area (details of topography, climate, soil, vegetation, geology, flood, landslide, etc.) Based on the information collected, select a corridor, Identify a number of possible center lines within the corridor.
Make a preliminary design for the possible alternatives and plot on the area map, Make final design and location of the selected alternative route.
3.6.2. Requirements of an Ideal Alignment Between two Terminals
A straight alignment would be the shortest, though there may be several practical considerations which would cause a deviation from the shortest path
| [12] | Chakroborty, P., & Das, A. Principles of transportation engineering. New Delhi: Prentice Hall India; 2017. |
[12]
.
Easy to construction and to maintain. Easy for operation with easy grades and curves. Design should consider initial capital cost, maintenance cost, and operation cost.
Safe enough for construction and maintenance from the view point of stability of natural slopes, embankments, cut slopes, and foundations and safe for traffic operations with ease geometric features such as sharpness of curves, grades, side slopes and etc
| [11] | Yu, B., & Cheng, J. Road survey and design. Singapore: Springer; 2019. |
[11]
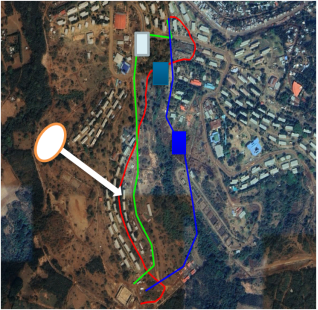
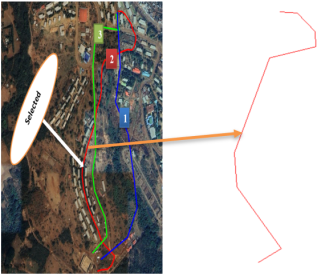
. According to the basic criteria of a given route selection such as easy, safe, short and economical, we have selected three routes from a site which connect Gidami to Begi then, taken the best route alignment from all consideration. From the selected three routes the first route needs one bridges which is not economical. The third route have high gradients at more than three places. This may result with high excavation which is not economical. In addition to this it may cause traffic accident for end user of the project. The second route is somewhat good when compared to the other. It haven’t need a bridge and no more gradients are available. Therefore, the second route is more suitable and it should be selected.
Figure 2. Route selection alternative.
4. Result and Discussions
4.1. Surface and Terrain Modeling
Once the raw coordinate point cloud is inside the computer, Eagle Point Software processes the layout of the terrain:
Triangulated Surface Model: The software processes the raw text file coordinates using triangulation algorithms to build a virtual mesh of the topography.
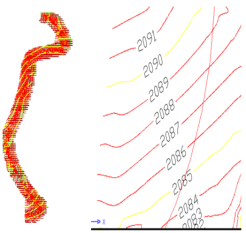
Contour Model Generation: The triangulated surface data is processed into a contour surface model. This visualizes the project terrain as a Digital Terrain Model (DTM), plotting out elevations to guide geometric adjustments.
The contour smoothing: - factor method generates smooth looking contours and guarantees that there will be no crossing contour lines. A value of zero indicates no smoothing
The Make Intermediate and Index Contours: - command allows you to create contour lines based on the surface model selected. This creates contours using the intermediate and index Intervals specified on the contour settings (intermediate value=1m &index value=5m this value depend on the terrain type).
The Annotate Contours: - command allows you to label the elevations of the contours that have been created.
The Place Grid Elevation Labels: - command allows you to annotate grid Elevations within a selected surface model. This can be useful to place grid stakes For the purpose of generating reports.
A contour (or contour line) is an imaginary line drawn on a map that connects points of equal elevation above or below a specified datum (usually mean sea level). Contours transform a flat, two-dimensional map into a three-dimensional representation. They allow engineers to visualize hills, valleys, ridges, and slopes. This is done with 2M IC (intermediate contour) and 5M index contour).
Figure 3. Contour surface model.
4.2. Design of Horizontal Alignment
The design of roadway curves should be based on an appropriate relationship between design speed and curvature and on their joint relationships with super elevation and side friction.
Curves are provided along the routes of highway where the change in direction is encountered. Curve design parameters such as angle of deflection, radius of curve, tangent distance, external distance, middle ordinate, cord length depends on the design speed and terrain condition
| [12] | Chakroborty, P., & Das, A. Principles of transportation engineering. New Delhi: Prentice Hall India; 2017. |
[12]
.
4.2.1. Horizontal Alignments
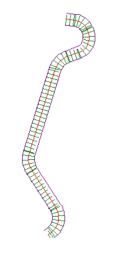
Represent the two-dimensional horizontal geometry of a given baseline. The Road Calc centerline alignment that is defined within a sub-project is the geometry that Road Calc bases its cross-sections on.
Figure 4. Horizontal alignment.
4.2.2. Horizontal Curve Data
In our project we use following formula
Where
VD = Design Speed (km/h) (from ERA manual, DCS for rolling VD=70Km/h)
e = Maximum super elevation (%/100) for our project e= 8%
f = Side friction coefficient (given in Table from ERA manual) =1.4
Table 2. Minimum Radii for Horizontal Curves (Sorce ERA manual 2013).
Minimum horizontal curve radius | SE=4% | m | 350 | 215 | 145 | 95(3) | 95 |
SE=6% | m | 310 | 195 | 135 | 85(3) | 85 |
SE=8% | m | 280 | 175 | 120 | 80(3) | - |
Design Speed | | Km/hr | 85 | 70 | 60 | 50(3) | 50 |
Horizontal Curve data
VD = 70Km/h
e =8%
f = 1.4
Calculated Rmin is less than Rmin on design standard. So, we take Rmin of calculated. Rmin of design standard DC5 in rolling is = 175m.
Table 3. Station and coordinates of curve 1.
curve 1 | station | Northing | easting |
PC(Point of curvature) | 0+024.127 | 1004170.901 | 234364.131 |
PI(Point of intersection) | 0+064.877 | 1004170.901 | 234404.881 |
PT | 0+098.783 | 1004136.712 | 234427.055 |
RP | N/A | 1004095.901 | 234364.131 |
Table 4. Output of curve 2 data from eagle point software.
CURVE 2 | STATION | NORTHING | EASTING |
PC(Point of curvature) | 0+140.204 | 1004101.960 | 234449.594 |
PI(Point of intersection) | 0+214.922 | 1004039.272 | 234490.252 |
PT(point of target) | 0+247.510 | 1004013.110 | 234420.264 |
RP | N/A | 1004069.311 | 234399.255 |
Table 5. Output Of Curve 3 Data From Eagle Point Software.
curve 3 | station | Northing | Easting |
PC(Point of curvature) | 0+314.286 | 1003989.728 | 234357.716 |
PI(Point of intersection) | 0+368.569 | 1003970.721 | 234306.869 |
PT(point of target) | 0+416.241 | 1003919.983 | 234287.572 |
RP | N/A | 1003877.325 | 234399.734 |
Table 6. Output Of Curve 4 Data From Eagle Point Software.
curve 4 | station | Northing | Easting |
PC(Point of curvature) | 0+743.318 | 1003614.271 | 234171.302 |
PI(Point of intersection) | 0+756.432 | 1003602.013 | 234166.640 |
PT(point of target) | 0+769.316 | 1003588.907 | 234166.135 |
RP | N/A | 1003585.832 | 234246.076 |
Table 7. Output Of Curve 5 Data From Eagle Point Software.
curve 5 | Station | Northing | Easting |
PC(Point of curvature) | 0+904.198 | 1003454.125 | 234160.950 |
PI(Point of intersection) | 0+934.111 | 1003424.234 | 234159.800 |
PT(point of target) | 0+961.956 | 1003399.602 | 234176.722 |
RP | N/A | 1003450.665 | 234250.884 |
Table 8. Output Of Curve 6 Data From Eagle Point Software.
curve 6 | Station | northing | Easting |
PC(Point of curvature) | 1+147.698 | 1003246.649 | 234282.155 |
PI(Point of intersection) | 1+251.751 | 1003160.966 | 234341.190 |
PT(point of target) | 1+308.749 | 1003105.379 | 234253.230 |
RP | N/A | 1003189.913 | 234199.808 |
Figure 5. Horizontal Curve.
4.2.3. Station Cross Section
Station Cross Section (often just called a cross section) represents a diagnostic, perpendicular "slice" of the ground and the proposed road at a specific point along its centerline.
Figure 6. Cross section station.
4.2.4. Vertical Alignment
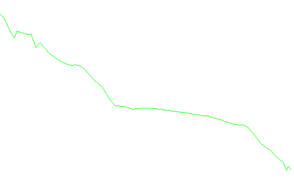
Vertical alignment is the longitudinal profile of the highway, viewed from the side (the profile view). It details the elevation changes of the road, showing how it climbs up hills, drops into valleys, or runs flat.
Figure 7. Vertical Alignment.
4.2.5. Vertical Curve
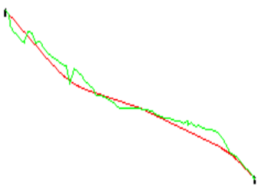
A vertical curve provides a gradual, safe transition between two different gradients. Unlike horizontal curves, which are circular, vertical curves are almost always designed as parabolas because a parabolic shape provides a constant, smooth rate of change of grade.
They are categorized into two types based on their shape:
Crest Vertical Curves: These occur at the summits of hills where the road curves over a high point (e.g., transitioning from an uphill climb to a downhill descent, or from a steep uphill to a flatter uphill).
Sag Vertical Curves: These occur at the bottom of valleys or dips where the road curves through a low point (e.g., transitioning from a downhill descent to an uphill climb).
Table 9. Output of vertical curve 1.
Curve | station | elevation on curve | elevation on tangent |
VPC(Point of curvature) | 0+252.712 | 2127.067 | |
VPI(Point of intersection) | 0+340.000 | 2120.629 | 2119.269 |
VPT(point of target) | 0+427.288 | 2116.913 | |
Table 10. Output of vertical curve 2.
| station | elevation on curve | elevation on tangent |
VPC(Point of curvature) | 0+710.256 | 2109.274 | |
VPI(Point of intersection) | 0+720.000 | 2108.983 | 2109.011 |
VPT(point of target) | 0+729.744 | 2108.637 | |
Table 11. Output of vertical curve 3.
| station | elevation on curve | elevation on tangent |
VPC(Point of curvature) | 1+140.169 | 2092.853 | |
VPI(Point of intersection) | 1+180.000 | 2090.924 | 2091.321 |
VPT(point of target) | 1+219.831 | 2088.203 | |
Figure 8. Vertical curve.
4.2.6. Super Elevation
Super elevation is the raising of outer edge or sloping upward towards the outside of the curve in order to counter balance the centrifugal force that acts on the vehicle. We use the Following formula to calculate super elevation data.
Where V = speed
R = radius of curve
4.2.7. Stopping Sight Distance
We use the Following formula
D= (0.278)(t)(v) + v2/254f(5)
Where:
D = distance (meter)
T = driver reaction time, generally taken to 2.5 seconds
V = initial speed (km/h)
F = coefficient of friction between tires and roadway
In this thesis stopping sight distance is 84.088m
4.3. Cross Section Elements
A cross sectional element in the high way design to those features which deals with its width. They will normally consist of the carriage way, shoulders, right of way, roadway width, side slopes, and earth work profiles.
The Carriage way is part of the road constructed for use by moving traffic as traffic lanes. For this project recommended carriage way length is 7m.
Feature of a high way having great influence on safety and comfort in the width of the carriage way, due to this the lane width of this design is 3.5m which is recommended.
Shoulder is the portion of the road between the outer edges and the edges of the carriage-way and Form design standard 2.75 recommend for this design.
Right-of-way is the width of the land secured and preserved to the public for road purposes. For this design standard recommends a right of way width to be 50 for all terrain type.
Normal cross fall should be sufficient to provide adequate surface drainage whilst not being so great as to make steering difficult, but it should facilitate drainage of the pavement. It is depending up on the smooth of the surface and the intensity of the rain fall. Therefore, we took 2.5% for normal cross fall.
Shoulder cross fall should be designed steeper than the pavement to facilitate quick drainage. Therefore 4% for shoulder cross slope as recommended by ERA 2013.
Side slopes and back slopes should be designed to ensure the stability of the road way and to provide a reasonable opportunity for recovery of an out-of-control vehicle.
4.3.1. Typical Section
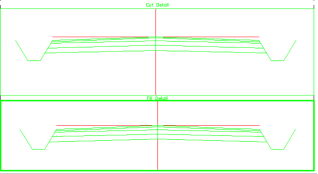
Typical Cross-Section is a fundamental drawing sheet in a highway design blueprint package. Atypical Section Sheet shows a generalized, ideal cross-section of the road. It represents the standard structural configuration, materials, and dimensional standards that apply across a major stretch—or the entirety—of the highway project. In essence, it tells the construction crew, "When the terrain is normal, this is exactly what the layers, widths, slopes, and drainage systems of the road must look like.
Figure 9. Typical section.
4.3.2. Cross Section Sheet
Cross-Section Sheet is a highly detailed technical drawing sheet that showcases individual vertical slices cut perpendicular to the centerline of the road at regular intervals (typically every 20 meters or at key stations.
Cross-section sheets are fundamental construction documents. Cross-section sheets reveal how the road integrates vertically and horizontally into the existing natural terrain at exact points along its path.
4.3.3. Coordinate and Station
In highway geometric design and surveying, Stations and Coordinates are the two fundamental reference systems used to pinpoint any exact location on earth.
While Coordinates tell you where a point is located globally on the earth's surface (using a grid system), a Station tells you where that same point is located relative to the highway project itself (measured linearly along the road's path).
Coordinates: Coordinates represent a fixed point on a two-dimensional horizontal plane or a three-dimensional space based on a specific geographic projection system.
A Station (or stationing) is a one-dimensional linear coordinate system used to measure distances along the centerline of a highway alignment. It measures the total accumulated length from a fixed starting point (usually designated as Station 0+000).
A point on our project is Station 1+311.336, it means that point is exactly 1 kilometer and 311.336 meters (or 1311.336 meters) away from the absolute beginning of the road project.
4.4. Plan and Profile of the Project
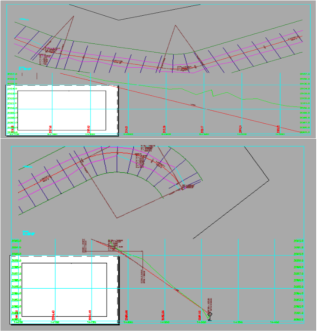
The Sheets command allows you to create cross-section sheets based on predefined settings and places the sheets in the CAD graphic window so that they can be further edited if needed. There are several options when formatting cross-section sheets.
Figure 10. Plan and profile.
4.5. Earth Work Quantities
4.5.1. Estimation of Earthwork Quantities
There are several ways of calculating earthwork but the most common is the "average end area" method. This method consists of averaging the cut and fill quantities of adjacent stations and multiplying by the distance between stations to produce cubic meters of excavation and embankment between the two stations. This procedure is followed when manual methods are used.
Where: a1 and a2= area of end section (m2)
Balancing earthworks using the mass haul diagram
4.5.2. Mass Haul Diagram
The mass haul diagram is a curve in which the abscissas represent the stations of the survey and the ordinates represent the algebraic sum of excavation and embankment quantities from some point of beginning on the profile.
It shows excavation (adjusted) and embankment quantities from some point of beginning on the profile, considering cut volumes positive and fills volumes negative. At the beginning of the curve the ordinate is zero, and ordinates are calculated continuously from the initial station to the end of the project.
5. Conclusion and Recommendations
5.1. Conclusion
To design a safe and economical highway through the desired design period, social and environmental factors and traffic volume should be studied. Therefore, safe design of the road geometric alignment should give comfort for the road users and minimize the accidental risks which occur on the road. The other important consideration in our design is economy. After giving a safe geometric alignment for the road, we must consider durable materials for the desired design period and select the most economical material which is easily available near the road to minimize transportation cost. When the road material is selected, we must also consider the amount of material available from the sources.
A safe and economical geometric alignment design has been provided based on the limits set by the ERA 2013 manual and engineering judgments which are related to the condition of the project. Survey data and hydrological data are the basics to perform the design. The Ethiopian Roads Authority (ERA) sets guidance for geometric design, pavement design, and material selection based on the topography, climate, and economy of the road.
5.2. Recommendation
Time Management: It is recommended that students conduct their bachelor thesis projects starting from the first semester. If the proposal development and survey data collection are conducted in the first semester and the remaining work in the second semester, they will have sufficient time to properly meet their objectives.
Future Expansion: It is recommended for the future to add another additional road to the surrounding area based on the terrain conditions and traffic demands.
Abbreviations
AASHTO | American Association State of Highway and Transport Official |
AADT | Annual Average Daily Traffic |
ADT | Average Daily Traffic |
CBR | California Bearing Ratio |
DV5 | Design Vehicle |
DC | Design Class |
DS | Design Standard |
DRL | Design Road Level |
ERA | Ethiopian Road Authority |
ESALF | Equivalent Standard Axle Load Factor |
ESAL | Equivalent Standard Axle Load |
ESA | Equivalent Standard Axle |
OGL | Original Ground Level |
PSD | passing Sight Distance |
SSD | Stopping Sight Distance |
TF | Traffic Factor |
Author Contributions
Dubiwak Nemera: Conceptualization, Methodology
Bulcha Assefa: Software
Conflicts of Interest
The authors declare no conflicts of interest.
References
| [1] |
Rychatrova, J. Manual on user benefit analysis of highway. Tanzania: International; 1987, pp. 25–67.
|
| [2] |
Gibreel, G. M., Easa, S. M., & El-Dimeery, I. A. Geometric design. America: International Journals; 2003, p. 65.
|
| [3] |
Sayed, T., & Easa, S. M. Geometric design considerations. (2000). 25-32.
|
| [4] |
AASHTO (American Association of State Highway and Transportation Officials). Guide for the development of bicycle facilities. North America: AASHTO; 1997. 10-12.
|
| [5] |
Abebe, A., & Tammew, A. A. Highway engineering. Nekemt, Ethiopia: Mega; 2011. *(Note: "HIGY=HWY" corrected to "Highway"; pp 34.
|
| [6] |
Kadyali, L. R., & Lal, N. B. Principles and practices of highway engineering. 6th ed. New Delhi: Khanna Publishers; 2013. 65-69.
|
| [7] |
ERA (Ethiopian Roads Authority). Geometric design manual: Design controls and criteria. Addis Ababa: ERA; 2002, p. 6.
|
| [8] |
ERA (Ethiopian Roads Authority). ERA geometric design manual. Addis Ababa: ERA; 2013. Pp 90.
|
| [9] |
Garber, N. J., & Hoel, L. A. Traffic and highway engineering. Geometric design chapter. (2001). Pp56.
|
| [10] |
Kutz, M. Handbook of transportation engineering. New York, NY: McGraw-Hill; 2011.
|
| [11] |
Yu, B., & Cheng, J. Road survey and design. Singapore: Springer; 2019.
|
| [12] |
Chakroborty, P., & Das, A. Principles of transportation engineering. New Delhi: Prentice Hall India; 2017.
|
| [13] |
Khanna, S. K., Justo, C. E. G., & Veeraragavan, A. Highway engineering. Roorkee: Nem Chand & Bros; 2017.
|
Cite This Article
-
APA Style
Nemera, D., Assefa, B. (2026). Assessment and Geometric Design of the Highway Route from Gidami to Begi Using Eagle Point Software. American Journal of Traffic and Transportation Engineering, 11(3), 39-51. https://doi.org/10.11648/j.ajtte.20261103.11
 Copy
|
Copy
|
 Download
ACS Style
Nemera, D.; Assefa, B. Assessment and Geometric Design of the Highway Route from Gidami to Begi Using Eagle Point Software. Am. J. Traffic Transp. Eng. 2026, 11(3), 39-51. doi: 10.11648/j.ajtte.20261103.11
Copy
|
Download
AMA Style
Nemera D, Assefa B. Assessment and Geometric Design of the Highway Route from Gidami to Begi Using Eagle Point Software. Am J Traffic Transp Eng. 2026;11(3):39-51. doi: 10.11648/j.ajtte.20261103.11
Copy
|
Download
-
@article{10.11648/j.ajtte.20261103.11,
  author = {Dubiwak Nemera and Bulcha Assefa},
  title = {Assessment and Geometric Design of the Highway Route from Gidami to Begi Using Eagle Point Software},
  journal = {American Journal of Traffic and Transportation Engineering},
  volume = {11},
  number = {3},
  pages = {39-51},
  doi = {10.11648/j.ajtte.20261103.11},
  url = {https://doi.org/10.11648/j.ajtte.20261103.11},
  eprint = {https://article.sciencepublishinggroup.com/pdf/10.11648.j.ajtte.20261103.11},
  abstract = {Road transport remains one of the most economical, accessible, and widely used modes of transportation, requiring relatively low investment while significantly enhancing the aesthetic appeal and functionality of urban and rural areas. A well-designed road network is fundamental to the efficient movement of people, goods, and industrial products, thereby serving as a critical catalyst for socio-economic development. The foundational step in achieving high-quality road infrastructure is the selection of an optimal route, followed by meticulous geometric design—the process of arranging the road layout to satisfy user requirements, safety standards, and operational efficiency. Key design controls include topography, traffic volume, design speed, roadway capacity, design vehicle characteristics, and access management. The Ethiopian Road Authority (ERA) provides ten geometric design standards; based on the Annual Average Daily Traffic (AADT), ground slope, and road classification, Design Class 5 (DC5) was selected for this project. The critical problem addressed in this study is the complete absence of a properly designed road connecting Gidami to Begi, which severely restricts access to education, healthcare, markets, and other essential services for the local community. This research utilized Eagle Point software to process total station survey data and produce comprehensive design outputs, including plans, profiles, curve data, coordinate tables, elevation models, contour maps, and mass haul diagrams. The project encompasses a total length of 52 kilometers from Gidami to Begi. Earthwork calculations revealed a total fill volume of 9,374.948 m3, a cut volume of 515.769 m3, a cut area of 2,675.811 m2, and a fill area of 45,145.11 m2. The complete geometric design includes horizontal and vertical alignments, cross-section elements, superelevation details, and sight distance analyses, all developed in strict accordance with the ERA Geometric Design Manual (2013).},
 year = {2026}
}
Copy
|
Download
-
TY  - JOUR
T1  - Assessment and Geometric Design of the Highway Route from Gidami to Begi Using Eagle Point Software
AU  - Dubiwak Nemera
AU  - Bulcha Assefa
Y1  - 2026/08/10
PY  - 2026
N1  - https://doi.org/10.11648/j.ajtte.20261103.11
DO  - 10.11648/j.ajtte.20261103.11
T2  - American Journal of Traffic and Transportation Engineering
JF  - American Journal of Traffic and Transportation Engineering
JO  - American Journal of Traffic and Transportation Engineering
SP  - 39
EP  - 51
PB  - Science Publishing Group
SN  - 2578-8604
UR  - https://doi.org/10.11648/j.ajtte.20261103.11
AB  - Road transport remains one of the most economical, accessible, and widely used modes of transportation, requiring relatively low investment while significantly enhancing the aesthetic appeal and functionality of urban and rural areas. A well-designed road network is fundamental to the efficient movement of people, goods, and industrial products, thereby serving as a critical catalyst for socio-economic development. The foundational step in achieving high-quality road infrastructure is the selection of an optimal route, followed by meticulous geometric design—the process of arranging the road layout to satisfy user requirements, safety standards, and operational efficiency. Key design controls include topography, traffic volume, design speed, roadway capacity, design vehicle characteristics, and access management. The Ethiopian Road Authority (ERA) provides ten geometric design standards; based on the Annual Average Daily Traffic (AADT), ground slope, and road classification, Design Class 5 (DC5) was selected for this project. The critical problem addressed in this study is the complete absence of a properly designed road connecting Gidami to Begi, which severely restricts access to education, healthcare, markets, and other essential services for the local community. This research utilized Eagle Point software to process total station survey data and produce comprehensive design outputs, including plans, profiles, curve data, coordinate tables, elevation models, contour maps, and mass haul diagrams. The project encompasses a total length of 52 kilometers from Gidami to Begi. Earthwork calculations revealed a total fill volume of 9,374.948 m3, a cut volume of 515.769 m3, a cut area of 2,675.811 m2, and a fill area of 45,145.11 m2. The complete geometric design includes horizontal and vertical alignments, cross-section elements, superelevation details, and sight distance analyses, all developed in strict accordance with the ERA Geometric Design Manual (2013).
VL  - 11
IS  - 3
ER  -
Copy
|
Download






 Share This Article
 Twitter
 Linked In
 Facebook