Barley (Hordeum vulgare L) is one of most important and commonly produced crops in Ethiopia. The experiment was conducted with the objective to determine the effect of genotype by environment interaction (GEI) on grain yield and to asses yield stability of Food Barley genotypes for the target environments. Fourteen genotypes, including Walashe were evaluated for two consecutive years in 2022 and 2023 at Arba rakate, Mechara and Daro Gudo. The experiment was laid in RCBD with three replications. The result revealed that there was significant difference among genotypes for grain yield across the testing environments. The mean grain yield of the genotypes across the six environments were 3341.2 kg/ha which ranged from 2768.4 kg/ha (G10) to 4045.6 t/ha (G13). The analysis of variance for AMMI also revealed significant variation for genotypes, environment and genotypes by environment interaction. The main effects of environment (E), genotypes (G) and GE interaction were highly significant at P < 0.01. Environment had the largest effect, explaining 58.7% of the total variability, while Genotypes and GE interaction explained 6.5% and 12.1% of total sum of squares, respectively. The larger contribution of the environment indicated that environments were very diverse. The first and second principal component accounted for 78.66% and 12.84% of the genotype by environment interaction (G×E), respectively). Based on AMMI stability value (ASV), test G12, G13, G7 and G14 were the most stable ones. Genotype Selection Index (GSI) showed that in the present study the most stable and high yielding genotypes were G13, G7 and G14. Based on this analysis, test G13, G7 and G14 were the most stable ones with AMMI stability values (ASV) of 9.08, 24.754 and 19.59, respectively. In the present study, Genotype Selection Index (GSI) showed that the most stable and high yielding genotypes were G13, G7 and G14 whereas, G10, G2, G3, G1 and G9 were the least stable and low yielding genotypes. Therefore, G13 and G7 were identified as candidate genotypes to be verified for possible release.
| Published in | American Journal of Bioscience and Bioengineering (Volume 13, Issue 4) |
| DOI | 10.11648/j.bio.20251304.12 |
| Page(s) | 77-91 |
| Creative Commons |
This is an Open Access article, distributed under the terms of the Creative Commons Attribution 4.0 International License (http://creativecommons.org/licenses/by/4.0/), which permits unrestricted use, distribution and reproduction in any medium or format, provided the original work is properly cited. |
| Copyright |
Copyright © The Author(s), 2025. Published by Science Publishing Group |
AMMI, Food Barley, Genotype by Environment Interaction, ASV, GSI, IPCA
Environments | Altitude (m.a.s.l) | Rainfall (mm) | Average temperature (°C) | Latitude (oNorth) | Longitude (oEast) | |
|---|---|---|---|---|---|---|
Max | Min | |||||
Mechara | 1796 | 963 | 15 | 28 | 40.19 | 08.35 |
Arba rakate | 2250 | 1120 | 13 | 28 | 40.87 | 9.07 |
Daro gudo | 2300 | 1280 | 10 | 24 | 40.89 | 9.003 |
Code | Genotypes | Source | Code | Genotypes | Source | Environment |
|---|---|---|---|---|---|---|
G1 | FBSNPlot100 | SARC | G8 | FBSNPlot79 | SARC | E1 = Mechara 2022 |
G2 | FBSNPlot44 | SARC | G9 | FBSNPlot76 | SARC | E2 = Mechara 2023 |
G3 | FBSNPlot39 | SARC | G10 | FBSNPlot81 | SARC | E3 = Arba rakate 2022 |
G4 | FBSNPlot54 | SARC | G11 | FBSPL104 | SARC | E4 = Arba rakate 2023 |
G5 | FBSPL106 | SARC | G12 | FBSNPlot13 | SARC | E5 = Daro Gudo 2023 |
G6 | FBSPL75 | SARC | G13 | FBSPL89 | SARC | E6 = Daro Gudo 2023 |
G7 | FBSPL63 | SARC | G14 | Walashe | SARC |
Source of Variation | DF | DH | DM | PH | SL | NSPS | TSW | GY |
|---|---|---|---|---|---|---|---|---|
Location | 2 | 1216.6** | 2411.6** | 15604** | 46.896** | 6664.9** | 639.74** | 120.1** |
Replication | 2 | 24.2 | 91.2* | 65.6 | 0.638 | 172** | 17.57 | 0.9 |
Genotype | 13 | 222.7** | 405.4** | 775.9** | 14.595** | 1679.8** | 267.68** | 2.35** |
Year | 1 | 4723.3** | 5525.4** | 408.3* | 17.413** | 1326.2** | 326.63** | 31.4** |
Location: Genotype | 26 | 25.5 | 29.2 | 204.3** | 0.845* | 189.1** | 94.28** | 0.46 |
Genotype: Year | 13 | 49.4** | 53.5* | 147.6** | 1.269** | 99.6** | 31.8 | 1.821** |
Location: Year | 2 | 1962.1** | 79 | 609.4** | 39.618** | 699.7** | 240.03** | 2.058* |
Loc: Genotype: Year | 26 | 18.6 | 62.4** | 52.9 | 1.071** | 121.4** | 9.04 | 0.812** |
Residuals | 166 | 20.1 | 29.1 | 60.4 | 0.514 | 35.2 | 30.14 | 0.631 |
Genotypes | E1 | E2 | E3 | E4 | E5 | E6 | Overall Mean |
|---|---|---|---|---|---|---|---|
G1 | 2100b-e | 1320.9c | 3440cd | 3801.7a-c | 4733.3ab | 4514.3bc | 3318.4cd |
G2 | 2066.7b-e | 1462.9c | 4153.3a-d | 2051.5d | 4833.3ab | 3217.3de | 2964.2de |
G3 | 2373.3a-d | 1467.6c | 4353.3a-d | 2524.7cd | 4806.7ab | 2753.4e | 3046.5c-e |
G4 | 2846.7ab | 1471.2c | 4426.7a-d | 2922.7b-d | 4793.3ab | 4096.2b-d | 3426cd |
G5 | 2553.3a-c | 1529.9c | 5466.7a | 2467cd | 4266.7ab | 4365.5b-d | 3441.5cd |
G6 | 2246.7a-e | 1676.9bc | 3353.3d | 2406.7cd | 4126.7ab | 3920c-e | 2955de |
G7 | 2816ab | 1731.4bc | 4860a-c | 3802.2a-c | 5380a | 5236.2ab | 3971ab |
G8 | 2513.3a-c | 1751.6bc | 4213.3a-d | 3474.3a-d | 4513.3ab | 3564.8c-e | 3338.5cd |
G9 | 1533.3de | 1752.8bc | 4160a-d | 2906.6b-d | 4993.3ab | 4386.8b-d | 3288.8c-e |
G10 | 1453.3e | 1836.3a-c | 3693.3b-d | 2400.5cd | 3620b | 3606.9c-e | 2768.4e |
G11 | 2620a-c | 1886a-c | 3606.7cd | 2725.3b-d | 4093.3ab | 4290.7b-d | 3203.7c-e |
G12 | 2146.7a-e | 1900.8a-c | 5106.7ab | 3090.7a-d | 5266.7a | 3353.2c-e | 3477.5b-d |
G13 | 2986.7a | 2343.6ab | 3700b-d | 4583.9a | 4726.7ab | 5932.6a | 4045.6a |
G14 | 1766.7c-e | 2568a | 3820b-d | 4253.6ab | 4620ab | 4159.4b-d | 3531.3a-c |
Mean | 2287.3 | 1764.28 | 4168.1 | 3100.8 | 4626.7 | 4099.8 | 3341.2 |
CV | 22.4 | 25.23377 | 20.4 | 30.35248 | 21.17 | 17.2 | 23.76 |
LSD | 859.76 | 747.1856 | 1425.6 | 1579.599 | 1643.7 | 1183.7 | 522.6 |
Genotypes | DH | DM | PH | SL | NSPS | TSW | SHF | LR | GY kg/ha |
|---|---|---|---|---|---|---|---|---|---|
G1 | 61.2c-e | 106.1bc | 72.9e | 6.9g | 40.9de | 47.8d-f | 3b | 3.33a | 3318.4cd |
G2 | 59e-g | 102.1de | 76.2c-e | 7.1fg | 28.4g | 50.9cd | 3.2ab | 2.83a-c | 2964.2de |
G3 | 61c-e | 99.1ef | 92.4a | 8.8c | 38.6e | 50.4c-e | 2.06c | 2.67b-d | 3046.5c-e |
G4 | 57fg | 98.2f | 91.9a | 8.7c | 38e | 50.5c-e | 2.06c | 2.83a-c | 3426cd |
G5 | 65.1ab | 107.8bc | 81.3bc | 8.4c | 51.3a | 47.6d-f | 3b | 3.17ab | 3441.5cd |
G6 | 61.3c-e | 108bc | 80.1b-d | 7.8d | 49.2ab | 45.7fg | 3b | 2.67b-d | 2955de |
G7 | 59.6d-f | 105.2cd | 83.3b | 10a | 29.7fg | 57.5a | 1.44d | 1.33fg | 3971ab |
G8 | 62cd | 107.3bc | 83.4b | 7.3e-g | 45.6bc | 47.2ef | 2.89b | 2.67b-d | 3338.5cd |
G9 | 65.3ab | 108.1bc | 82.5b | 7.6de | 26.2gh | 46.3fg | 3.11ab | 2.17de | 3288.8c-e |
G10 | 62.8bc | 107.4bc | 76.6c-e | 7.5d-f | 48.8ab | 42.8g | 3.56a | 3.33a | 2768.4e |
G11 | 66a | 109b | 74.7e | 7.6de | 48.9ab | 50.6c-e | 2.94b | 2.33c-e | 3203.7c-e |
G12 | 56.6g | 99.9ef | 88.7a | 8.4c | 22.4h | 52.5bc | 1.78cd | 3ab | 3477.5b-d |
G13 | 66.1a | 106.7bc | 73.7e | 9.5b | 32.4f | 55.3ab | 1.44d | 1.17g | 4045.6a |
G14 | 68a | 116.3a | 75de | 7.7d | 44.7cd | 49.2c-f | 1.83cd | 1.83ef | 3531.3a-c |
Mean | 62.2 | 105.8 | 80.92 | 8.1 | 38.93 | 49.57 | 2.52 | 2.52 | 3341.2 |
CV | 7.13 | 4.99 | 9.68 | 8.86 | 15.25 | 11.1 | 30.2 | 29.17 | 23.76 |
LSD | 2.92 | 3.48 | 5.15 | 0.47 | 3.9 | 3.61 | 0.5 | 0.596 | 522.6 |
Sources | DF | SS | MS | Total Variation Explained (%) | GXE Explained (%) | Cumulative (%) |
|---|---|---|---|---|---|---|
Genotypes | 13 | 30.5 | 2.347** | 6.5 | ||
Environments | 5 | 275.7 | 275.7** | 58.7 | ||
Block | 12 | 14.8 | 1.234 | 3.2 | ||
Interactions | 65 | 56.7 | 0.873** | 12.1 | ||
IPCA 1 | 17 | 30.8 | 1.814** | 54.32 | 54.32 | |
IPCA 2 | 15 | 10.7 | 0.71 | 18.87 | 73.19 | |
Residuals | 33 | 15.2 | 0.461 | |||
Total | 251 | 469.4 | 1.87 |
Genotype | Mean | IPCAg1 | IPCAg2 | ASV | rASV | RGY | GSI |
|---|---|---|---|---|---|---|---|
G1 | 3.318 | -0.39592 | 0.00594 | 5240.942 | 14 | 8 | 22 |
G2 | 2.963 | -0.4824 | -0.06266 | 605.4 | 11 | 12 | 23 |
G3 | 3.046 | 0.32207 | -0.14088 | 1276.22 | 12 | 11 | 23 |
G4 | 3.426 | 0.03917 | 0.05456 | 56.564 | 7 | 6 | 13 |
G5 | 3.443 | -0.2147 | 0.25921 | 65.23 | 8 | 5 | 13 |
G6 | 2.956 | 0.2094 | 0.45725 | 36.19 | 5 | 13 | 18 |
G7 | 3.971 | 0.06108 | 0.19608 | 24.754 | 4 | 2 | 6 |
G8 | 3.339 | 0.28415 | -0.28165 | 79.4 | 9 | 7 | 16 |
G9 | 3.288 | -0.48541 | 0.08568 | 445.48 | 10 | 9 | 19 |
G10 | 2.768 | 0.25485 | 0.00626 | 3201.1 | 13 | 14 | 27 |
G11 | 3.203 | 0.29097 | 0.40753 | 56.26 | 6 | 10 | 16 |
G12 | 3.477 | 0.01842 | -0.41801 | 4.983 | 1 | 4 | 5 |
G13 | 4.046 | 0.03148 | -0.29653 | 9.08 | 2 | 1 | 3 |
G14 | 3.531 | 0.06684 | -0.2728 | 19.59 | 3 | 3 | 6 |
Grand mean | 3.34 |
AEC | Average Environment Coordinate |
AMMI | Additive Main Effect and Multiplicative Interaction |
ANOVA | Analysis of Variance |
ASV | Ammi Stability Value |
E | Environment |
G | Genotype |
GEI | Genotype by Environment Interaction |
GSI | Genotype Selection INDEX |
GY | Grain Yield |
IPCA | Interaction Principal Component Analysis |
MET | Multi Environment Trials |
RASV | Rank of Ammi Stability Value |
RGY | Rank of Grain Yield |
SSIPCA | Sum of Square Interaction Principal Component Analysis |
| [1] | Abtew, W. G., Lakew, B., Haussmann, B. I. G., & Schmid, K. J. (2015). Ethiopian barley landraces show higher yield stability and comparable yield to improved varieties in multi-environment field trials. Journal of Plant Breeding and Crop Science, 7(8), 275-291. |
| [2] | Aliyi Kedir Shunbura, Seyoum Alemu Rorisa and Kuma Kebede Gedefa. Genotype by environment interaction and stability study in bread wheat (Triticum aestivum L.) genotypes in Guji Zone, Southern Ethiopia. GSC Advanced Research and Reviews, 2024, 19(02), 085-092. |
| [3] | Angela, P., Mateo, V., Gregorio, A., Francisco, R., Marco, L., Jose, C., & Juan, B. (2016). GEA-R (genotype x environment analysis with R for Windows) Version 4.2.2. CIMMYT Research Data and Software Repository Network. |
| [4] | Annicchiarico, P. (2002). G x E Interaction: Challenges and opportunities for plant breeding and cultivar recommendations. Food and Agricultural Organization (FAO). |
| [5] | Bacha, T., Alemerew, S., & Tadesse, Z. (2015). Genotype x environment interaction and yield stability of bread wheat (Triticum Eastivum L.) genotype in Ethiopia using the AMMI analysis. Journal of Biology, Agriculture and Healthcare, 5(11), 129-139. |
| [6] | Balcha, A. (2023). Stability of finger millet (Eleusine coracana L.) yield using additive main effects and multiplicative interaction analysis. International Journal of Agricultural Research, Innovation and Technology, 13(1), 60-66. |
| [7] | Bayissa, T., Mengistu, G., Gerema, G., Balcha, U., Feyisa, H., Kedir, A., Legese, Z., Asegid, D., Leta, T., & Jobe, T. (2023). Genotype × environment interaction of lowland bread wheat varieties for irrigation in different areas of Oromia. Plant-Environment Interactions, 4, 2-10. |
| [8] | Birhanu, C., Mekbib, F., Lule, D., Bekeko, Z., Girma, G., Tirfessa, A., Ayana, G., Nida, H., & Mengiste, T. (2024). Genotype by environment interactions and stability for grain yield and other agronomic traits in selected sorghum genotypes in Ethiopia. Agrosystems, Geosciences & Environment, 7, e20544. |
| [9] | Bose, L. K., Jambhulkar, N. N., & Pande, K. (2014). Genotype by environment interaction and stability analysis for rice genotypes under boro condition. Genetika, 46(2), 521-5284. |
| [10] | Bose, L. K., Jambhulkar, N. N., Pande, K., & Singh, O. N. (2014). Use of AMMI and other stability statistics in the simultaneous selection of rice genotypes for yield and stability under direct-seeded conditions. Chilean Journal of Agricultural Research, 74(1), 3-9. |
| [11] | Central Statistical Agency of Ethiopia Agricultural sample survey of the area and production of major crops. Available from: |
| [12] | Choi, H., Esser, A., & Murphy, K. M. (2020). Genotype × environment interaction and stability of β-glucan content in barley in the Palouse region of eastern Washington. Crop Science, 60(5), 2500-2510. |
| [13] | Dehghani, H., Ebadi, A., & Yousefi, A. (2006). Biplot analysis of genotype by environment interaction for barley yield in Iran. Agronomy Journal, 98(2), 388-393. |
| [14] | Derbew, S., Mekbib, F., Lakew, B., Bekele, A., & Bishaw, Z. (2024). AMMI and GGE biplot analysis for barley genotype yield performance and stability under multi environment condition in southern Ethiopia. Agrosystems, Geosciences & Environment. |
| [15] | Desu Assegid, Abubeker Terbush, Gebeyehu Chala, Gabisa Bekela.(2024). Evaluation of Recently Released Finger Millet Varieties for Their Adaptability in West Haraghe Zone, Eastern Ethiopia. American Journal of BioScience 2024, Vol. 12, No. 4, pp. 127-132 |
| [16] | Dogan, Y., Kendal, E., & Oral, E. (2016). Identifying of relationship between traits and grain yield in spring barley by GGE biplot analysis. Agriculture and Forestry, 62(4), 239-252. |
| [17] | Eberhart, S. A., & Russell, W. A. (1966). Stability parameters for comparing varieties. Crop Science, 6(1), 36-40. |
| [18] | Fana, G., Tadese, D., Sebsibe, H., & Verma, R. P. S. (2018). Multienvironment trial analysis of food barley in Ethiopia using AMMI and GGE biplot methods. Journal of Plant Breeding and Genetics, 06(03), 75-85. |
| [19] | FAO. (2023). Crop and livestock products. Food and Agriculture Organization of the United Nations (FAO). Available online: |
| [20] | Farshadfar, E., Mahmodi, N., & Yaghotipoor, A. (2011). AMMI stability value and simultaneous estimation of yield and yield stability in bread wheat (Triticum aestivum L.). Australian Journal of Crop Science, 5(13), 1837-1844. |
| [21] | Farshadfar, E., Mohammadi, R., Agahaee, M., & Vaisi, Z. (2012). GGE biplot analysis of genotype × environment interaction in wheat-barley disomic addition lines. Australian Journal of Crop Science, 6(6), 1074-1079. |
| [22] | Fekadu, W., Mekbib, F., & Lakew (2023). Genotype × environment interaction and yield stability in barley (Hordeum vulgare L.) genotypes in the central highland of Ethiopia. Journal of Crop Science and Biotechnology, 26, 119-133. |
| [23] | Finlay, K. W., & Wilkison, G. N. (1963). Testis weight, body weight and breeding system in primates. Nature, 293(5827), 55-57. |
| [24] | Gauch, H. G. (1995). Statistical analysis of regional yield trials: AMMI analysis of factorial designs. Computers and Electronics in Agriculture, 12(12), 81-82. |
| [25] | Gauch, H. G., & Zobel, R. W. (1996). AMMI analysis of yield trials. In M. S. Kang & H. G. Gauch, Jr. (Eds.), Genotype-by-environment interaction (pp. 85-122). CRC Press. |
| [26] | Gauch, H. G. 1992. Statistical analysis of regional yield trials: AMMI analysis of factorial designs. Elsevier, Amsterdam. |
| [27] | Gauch, H. G., and R. W. Zobel. 1988. Predictive and postdictive success of statistical analyses of yield trials. Theor. Appl. Genet. 76: 1-10. |
| [28] | Gebeyehu Chala, Bulti Tesso, Dagnachew Lule and Kebede Dessalegn (2019). Additive Main Effect and Multiplicative Interactions (AMMI) and Regression Analysis in Sorghum [Sorghum bicolor (L). Moench] Varieties. Journal of Applied Biosciences 136: 13877 - 13886. |
| [29] | Gebeyehu Chala, Gemechu Deso, Garoma Firdisa, Mohammed Tesiso. Performance Evaluation of Food Barley (Hordeum vulgare L.) Varieties for Grain Yield and Other Agronomic Traits in Buno Bedele, South West Oromia, Ethiopia. International Journal of Agricultural Economics. Vol. 8, No. 2, 2023, pp. 77-82. |
| [30] | Geleta Negash & Alemayew Birr (2022). Adaptability Study of Yield and Yield Related Trait Performance of Improved Bread Wheat (Triticum aestivum L.) Varieties in North Shewa Zone Oromia, Ethiopia. South Asian Res J Agri Fish, 4(6), 77-84. |
| [31] | Gomez, A. K., & Gomez, A. A. (1984). Statistical procedure for agricultural research. John Wiley and Sons. |
| [32] | Kaya, Y., and Turkoz, M. 2016. Evaluation of genotype by environment interaction for grain yield in durum wheat using non-parametric stability statistics. Turk J Field Crops 21(1): 51-59. |
| [33] | Kendal, E., Karaman, M., Tekdal, S., & Doğan, S. (2019). Analysis of promising barley (Hordeum vulgare L.) lines performance by AMMI and GGE biplot in multiple traits and environment. Applied Ecology and Environmental Research, 17(2), 5219-5233. |
| [34] | Kilic, H. (2014). Additive main effect and multiplicative interactions (AMMI) analysis of grain yield in barley genotypes across environments. Journal of Agricultural Science, 20, 337-344. |
| [35] | Luquez, J. E., Aguirrezabal, L. A. N., Aguero, M. E., & Pereyra, V. R. (2002). Stability and adaptability of cultivars in non-balanced yield trials: Comparison of methods for selecting high oleic sunflower hybrids for grain yield and quality. Journal of Agronomy and Crop Science, 188, 225-234. |
| [36] | Mekonnen, A., Mekbib, F., & Gashaw, A. (2019). AMMI and GGE biplot analysis of grain yield of bread wheat (Triticum aestivum L.) genotypes at moisture deficit environment of Wollo, Ethiopia. Journal of Agricultural Science and Practice, 4(1), 9-19. |
| [37] | Purchase, J. L., Hatting, H., & Van Deventer, C. S. (2000). Genotype × environment interaction of winter wheat (Triticum aestivum L.) in South Africa: II. Stability analysis of yield performance. South African Journal of Plant and Soil, 17(3), 101-107. |
| [38] | R Core Team, R: A Language and Environment for Statistical Computing, R Foundation for Statistical Computing, Vienna, Austria, 2018. |
| [39] | Ruswandi, D., Syafii, M., Maulana, H., Ariyanti, M., Indriani, N. P., & Yuwariah, Y. (2021). GGE Biplot Analysis for Stability and Adaptability of Maize Hybrids in Western Region of Indonesia. International Journal of Agronomy, 2021. |
| [40] | Salim Rahmati, Reza Azizi-Nezhad, Alireza Pour-Aboughadareh, Alireza Etminan, Lia Shooshtari. (2024) Analysis of genotype-by-environment interaction effect in barley genotypes using AMMI and GGE biplot methods. Heliyon 10(2024) e38131. |
| [41] | Tadele Tadesse, Gashaw Sefera, Belay Asmare, Amanuel Tekalign. Performance stability for grain yield and genotypes by environment interaction in field pea genotypes in the highlands of Bale Southeastern Ethiopia. Agricultural Advances (2020) 9(11) 567-575. ISSN 2251-7820. |
| [42] | Tesfay, M., Shimelis, H., Solomon, T., & Hailu, A. (2019). Genotypeby-environment interaction and selection of elite wheat genotypes under variable rainfall conditions in northern Ethiopia. Journal of Crop Improvement, 33, 797-813. |
| [43] | Vaezi, B., Pour-Aboughadareh, A., Mohammadi, R., Armion, M., Mehraban, A., Hossein-Pour, T., & Dorrii, M. (2017). GGE biplot and AMMI analysis of barley yield performance in Iran. Cereal Research Communications, 45(3), 500-511. |
| [44] | Von Bothmer R, Sato K, Komatsuda T, Yasuda S, Fischbeck G (2003) The domestication of cultivated barley. In: von Bothmer R, van Hintum T, Knu¨pffer H, Sato K (eds) Diversity in barley (Hordeum vulgare). Elsevier Science B. V., Amsterdam, pp 9-27. |
| [45] | Wardofa, G. A., Asnake, D., & Mohammed, H. (2019). GGE biplot analysis of genotype by environment interaction and grain yield stability of bread wheat genotypes in Central Ethiopia. Journal of Plant Breeding and Genetics, 07(02), 75-85. |
| [46] | Yan W, Kang MS, 2003. GGE biplot analysis: a graphical tool for breeders, geneticists, and agronomists CRC Press, Boca Raton, FL. |
| [47] | Yan, W. 2001. GGEbiplot—A windows application for graphical analysis of multi environment trial data and other types of two-way data. Agronomy Journal, 93(5), 1111-1118. |
| [48] | Yan, W. 2002. Singular-value partition for biplot analysis of multi-environment trial data. Agron. J. 94: 990-996. |
| [49] | Yan, W., and L. A. Hunt. 2001. Interpretation of genotype by environment interaction for winter wheat yield in Ontario. Crop Sci. 41: 19-25. |
| [50] | Yan, W., & Tinker, N. A. (2006). Biplot analysis of multi-environment trial data: Principles and applications. Canadian Journal of Plant Science, 86(3), 623-645. |
| [51] | Yan, W., Cornelius, P. L., Crossa, J., & Hunt, L. A. (2001). Two types of GGE biplots for analyzing multi-environment trial data. Crop Science, 41, 656-663. |
| [52] | Yan, W., Hunt, L. A., Sheng, Q., & Szlavnics, Z. (2000). Cultivar evaluation and mega-environment investigation based on the GGE biplot. Crop Science, 40(3), 597-605. |
| [53] | Yan, W., Kang, M. S., Ma, B., Woods, S., & Cornelius, P. L. (2007). GGE biplot vs. AMMI analysis of genotype-by-environment data. Crop Science, 47(2), 643-653. |
| [54] | Zobel, R. W., Wright, M. J., & Gauch, J. H. G. (1988). Statistical analysis of a yield trial. Agronomy Journal, 80, 388-393. |
APA Style
Bekela, G., Terbush, A., Assegid, D. (2025). Genotype by Environment Interaction and Grain Yield Stability of Food Barley (Hordeum vulgare L.) Genotypes in West Hararghe Zone, Eastern Ethiopia. American Journal of Bioscience and Bioengineering, 13(4), 77-91. https://doi.org/10.11648/j.bio.20251304.12
ACS Style
Bekela, G.; Terbush, A.; Assegid, D. Genotype by Environment Interaction and Grain Yield Stability of Food Barley (Hordeum vulgare L.) Genotypes in West Hararghe Zone, Eastern Ethiopia. Am. J. BioSci. Bioeng. 2025, 13(4), 77-91. doi: 10.11648/j.bio.20251304.12
@article{10.11648/j.bio.20251304.12,
  author = {Gabisa Bekela and Abubeker Terbush and Desu Assegid},
  title = {Genotype by Environment Interaction and Grain Yield Stability of Food Barley (Hordeum vulgare L.) Genotypes in West Hararghe Zone, Eastern Ethiopia
},
  journal = {American Journal of Bioscience and Bioengineering},
  volume = {13},
  number = {4},
  pages = {77-91},
  doi = {10.11648/j.bio.20251304.12},
  url = {https://doi.org/10.11648/j.bio.20251304.12},
  eprint = {https://article.sciencepublishinggroup.com/pdf/10.11648.j.bio.20251304.12},
  abstract = {Barley (Hordeum vulgare L) is one of most important and commonly produced crops in Ethiopia. The experiment was conducted with the objective to determine the effect of genotype by environment interaction (GEI) on grain yield and to asses yield stability of Food Barley genotypes for the target environments. Fourteen genotypes, including Walashe were evaluated for two consecutive years in 2022 and 2023 at Arba rakate, Mechara and Daro Gudo. The experiment was laid in RCBD with three replications. The result revealed that there was significant difference among genotypes for grain yield across the testing environments. The mean grain yield of the genotypes across the six environments were 3341.2 kg/ha which ranged from 2768.4 kg/ha (G10) to 4045.6 t/ha (G13). The analysis of variance for AMMI also revealed significant variation for genotypes, environment and genotypes by environment interaction. The main effects of environment (E), genotypes (G) and GE interaction were highly significant at P < 0.01. Environment had the largest effect, explaining 58.7% of the total variability, while Genotypes and GE interaction explained 6.5% and 12.1% of total sum of squares, respectively. The larger contribution of the environment indicated that environments were very diverse. The first and second principal component accounted for 78.66% and 12.84% of the genotype by environment interaction (G×E), respectively). Based on AMMI stability value (ASV), test G12, G13, G7 and G14 were the most stable ones. Genotype Selection Index (GSI) showed that in the present study the most stable and high yielding genotypes were G13, G7 and G14. Based on this analysis, test G13, G7 and G14 were the most stable ones with AMMI stability values (ASV) of 9.08, 24.754 and 19.59, respectively. In the present study, Genotype Selection Index (GSI) showed that the most stable and high yielding genotypes were G13, G7 and G14 whereas, G10, G2, G3, G1 and G9 were the least stable and low yielding genotypes. Therefore, G13 and G7 were identified as candidate genotypes to be verified for possible release.
},
 year = {2025}
}
TY  - JOUR
T1  - Genotype by Environment Interaction and Grain Yield Stability of Food Barley (Hordeum vulgare L.) Genotypes in West Hararghe Zone, Eastern Ethiopia

AU  - Gabisa Bekela
AU  - Abubeker Terbush
AU  - Desu Assegid
Y1  - 2025/09/25
PY  - 2025
N1  - https://doi.org/10.11648/j.bio.20251304.12
DO  - 10.11648/j.bio.20251304.12
T2  - American Journal of Bioscience and Bioengineering
JF  - American Journal of Bioscience and Bioengineering
JO  - American Journal of Bioscience and Bioengineering
SP  - 77
EP  - 91
PB  - Science Publishing Group
SN  - 2328-5893
UR  - https://doi.org/10.11648/j.bio.20251304.12
AB  - Barley (Hordeum vulgare L) is one of most important and commonly produced crops in Ethiopia. The experiment was conducted with the objective to determine the effect of genotype by environment interaction (GEI) on grain yield and to asses yield stability of Food Barley genotypes for the target environments. Fourteen genotypes, including Walashe were evaluated for two consecutive years in 2022 and 2023 at Arba rakate, Mechara and Daro Gudo. The experiment was laid in RCBD with three replications. The result revealed that there was significant difference among genotypes for grain yield across the testing environments. The mean grain yield of the genotypes across the six environments were 3341.2 kg/ha which ranged from 2768.4 kg/ha (G10) to 4045.6 t/ha (G13). The analysis of variance for AMMI also revealed significant variation for genotypes, environment and genotypes by environment interaction. The main effects of environment (E), genotypes (G) and GE interaction were highly significant at P < 0.01. Environment had the largest effect, explaining 58.7% of the total variability, while Genotypes and GE interaction explained 6.5% and 12.1% of total sum of squares, respectively. The larger contribution of the environment indicated that environments were very diverse. The first and second principal component accounted for 78.66% and 12.84% of the genotype by environment interaction (G×E), respectively). Based on AMMI stability value (ASV), test G12, G13, G7 and G14 were the most stable ones. Genotype Selection Index (GSI) showed that in the present study the most stable and high yielding genotypes were G13, G7 and G14. Based on this analysis, test G13, G7 and G14 were the most stable ones with AMMI stability values (ASV) of 9.08, 24.754 and 19.59, respectively. In the present study, Genotype Selection Index (GSI) showed that the most stable and high yielding genotypes were G13, G7 and G14 whereas, G10, G2, G3, G1 and G9 were the least stable and low yielding genotypes. Therefore, G13 and G7 were identified as candidate genotypes to be verified for possible release.

VL  - 13
IS  - 4
ER  -
Cereal Crop Research Team, Mechara Agricultural Research Center, Mechara, Ethiopia
Biography: Gabisa Bekela is a Researcher and Crop breeder at Mechara Agricultural Research Center, Oromia Agricultural Research Institute, Cereal Crop Research Team. He completed his Bachelor of Science in plant science from Bule Hora University in 2020, and Master of Science in plant breeding from the same institution in 2023. He has participated in multiple National and regional research collaboration projects in recent years. He currently serves as crop breeder, researcher, cereal crop team team leader and Focal person of GIZ-SSAP project at Mechara agricultural research center.
Research Fields: Crop breeding and genetics, Sorghum, Maize, Wheat, Barley, Tef, Rice, Finger millet

Cereal Crop Research Team, Mechara Agricultural Research Center, Mechara, Ethiopia
Biography: Abubeker Terbush is a Researcher and Crop Agronomist at Mechara Agricultural Research Center, Oromia Agricultural Research Institute, Cereal Crop Research Team. He completed his Bachelor of Science in plant science from Ambo University in 2016. He has participated in multiple National and regional research collaboration projects in recent years. He currently serves as crop agronomist and researcher at Mechara agricultural research center.
Research Fields: Crop agronomist, Sorghum, Maize, Wheat, Barley, Tef, Rice, Finger millet
Cereal Crop Research Team, Mechara Agricultural Research Center, Mechara, Ethiopia
Biography: Desu Assegid is a Researcher and Crop breeder at Mechara Agricultural Research Center, Oromia Agricultural Research Institute, Cereal Crop Research Team. He completed his Bachelor of science in plant science from Mada Walabu University in 2017, and Master of Science in plant breeding from the Haramaya University in 2022. He has participated in multiple National and regional research collaboration projects in recent years. He currently serves as crop breeder and researcher at Mechara agricultural research center.
Research Fields: Crop breeding and genetics, Sorghum, Maize, Wheat, Barley, Tef, Rice, Finger millet
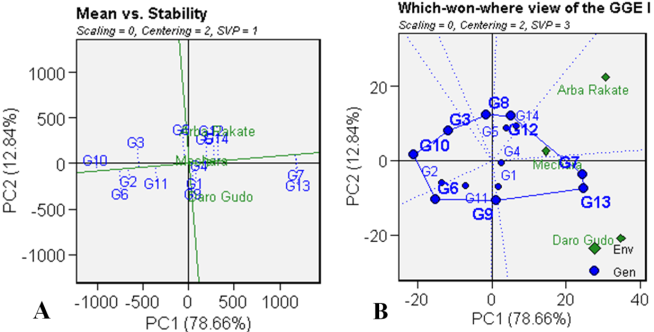
Figure 1. (A) GGE biplot showing “mean versus stability” of 14 barley genotypes, (B) Which-won-where pattern of genotype plus genotype × environment interaction effect (GGE) biplot.
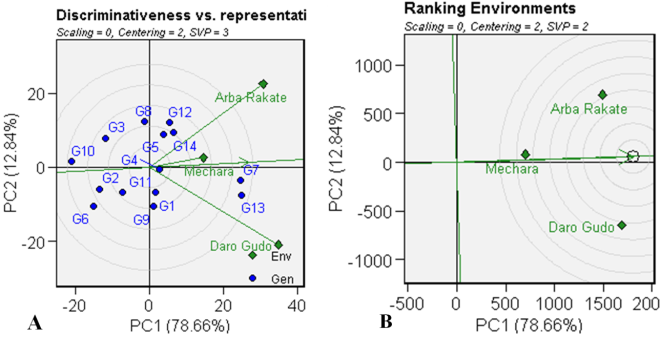
Figure 2. (A) GGE biplot showing rank of test locations based on discriminating ability and representativeness, (B) Ranking of the Test Environments.
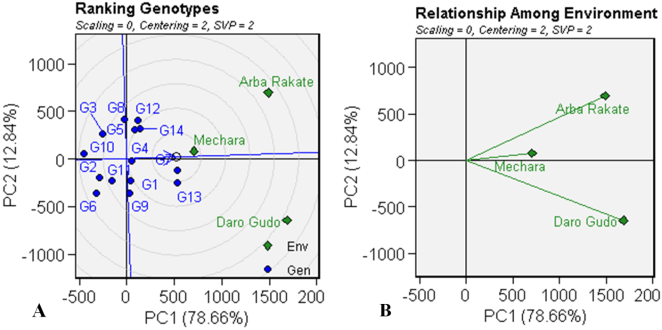
Figure 3. (A) Comparison of genotypes relative to the ideal genotype, (B) Biplots of the correlation between environments.
Information

