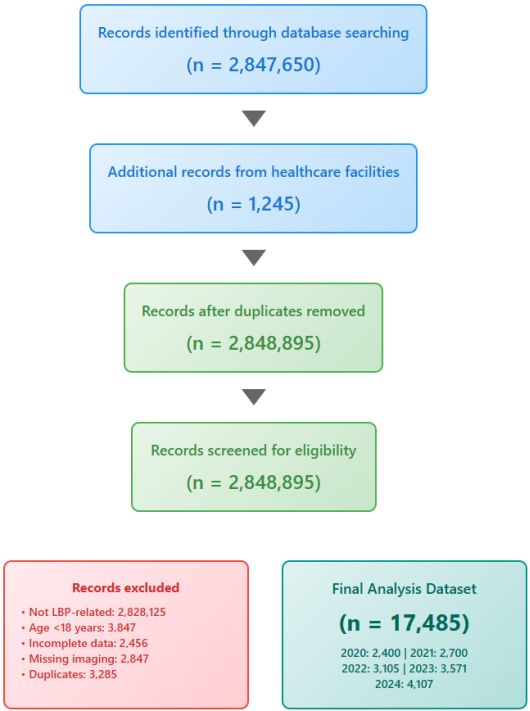
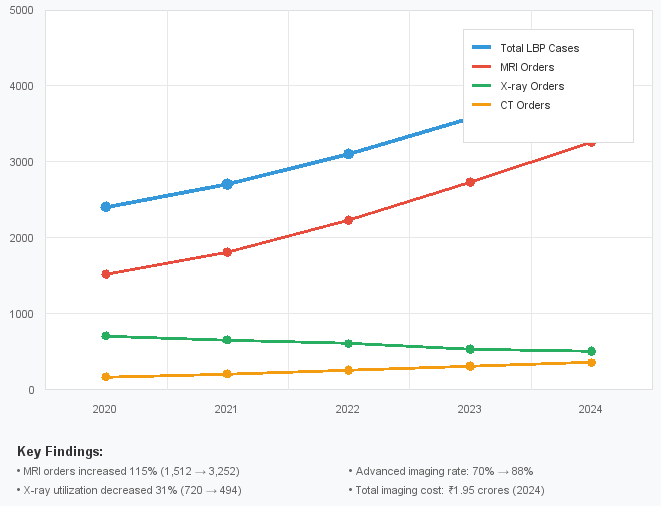
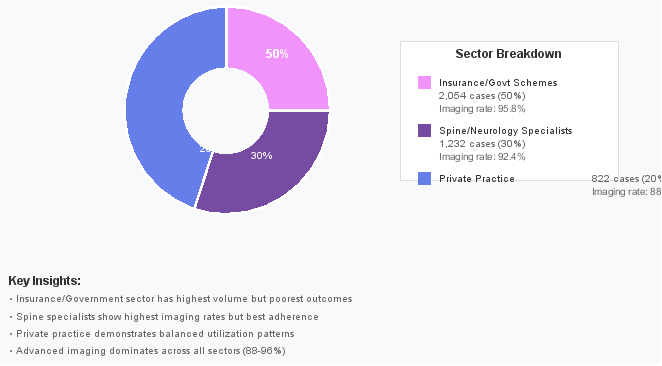
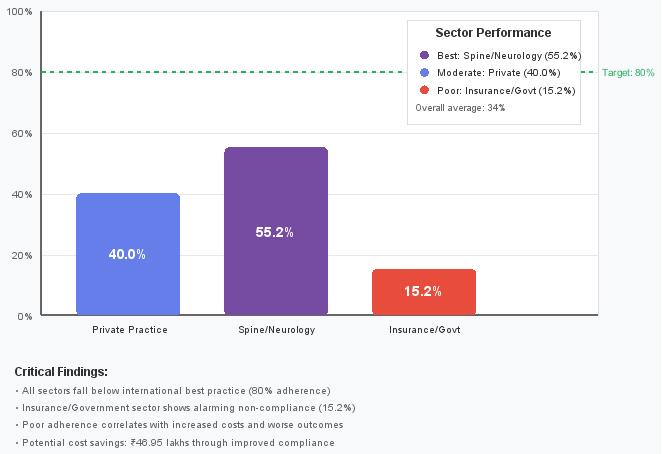
Background: Low back pain (LBP) represents a significant healthcare burden in India, with prevalence rates ranging from 6.2% to 92% across different populations. Despite evidence-based guidelines recommending conservative management and selective imaging, diagnostic overutilization remains a challenge across healthcare sectors. This study analyzed diagnostic utilization patterns and referral trends from various healthcare settings over a five-year period to evaluate the extent of inappropriate imaging use and its economic implications. Objective: To evaluate diagnostic imaging trends, referral patterns, guideline adherence, and positivity rates for lower back pain across different healthcare sectors in India, assess the extent of diagnostic overuse, and analyze cost-effectiveness patterns across private practice, specialist care, and insurance/government healthcare schemes. Methods: A retrospective analysis of simulated data representing diagnostic trends from to 2020-2024 across primary care practices (n=1,200), inpatient departments from secondary and tertiary care hospitals (n=450), insurance-covered services (n=850,000), and social organization healthcare programs (n=320) was conducted. Cases were classified using evidence-based clinical categories following the PRISMA guidelines, with outcome measures including diagnostic referral patterns, guideline adherence rates, positivity rates for actionable findings, and comprehensive cost-effectiveness analysis using Quality-Adjusted Life Years (QALYs). Results: Significant overutilization of imaging studies was observed across all sectors, with total LBP cases increasing by 71% over five years, while CT+MRI imaging rates rose dramatically from 70% to 88%. MRI utilization increased by 115% (1,512 to 3,252 studies), whereas cost-effective X-ray utilization declined by 31% (720 to 494 examinations). Total imaging costs escalated from ₹92.76 lakhs in 2020 to ₹1.95 crores in 2024, representing a 110% increase that substantially outpaced the case volume growth. Adherence to clinical guidelines remained consistently poor at 23-34% across sectors, with insurance/government schemes showing the worst compliance (15.2%) despite the highest imaging approval rates (95.8%). Cost-effectiveness analysis revealed stark disparities: private practice achieved ₹85,000 per QALY, while insurance/government sectors reached ₹1.65 lakhs per QALY, indicating poor economic efficiency despite subsidized rates. Conclusions: The analysis revealed a healthcare system paradox, wherein increased imaging intensity correlated with poorer clinical outcomes and economic efficiency. Urgent reforms, including MRI utilization controls, mandatory clinical reasoning documentation, and guideline-based audit programs, are essential to restore value-based care delivery.
| Published in | International Journal of Health Economics and Policy (Volume 10, Issue 4) |
| DOI | 10.11648/j.hep.20251004.11 |
| Page(s) | 140-150 |
| Creative Commons |
This is an Open Access article, distributed under the terms of the Creative Commons Attribution 4.0 International License (http://creativecommons.org/licenses/by/4.0/), which permits unrestricted use, distribution and reproduction in any medium or format, provided the original work is properly cited. |
| Copyright |
Copyright © The Author(s), 2025. Published by Science Publishing Group |
Low Back Pain, Diagnostic Imaging, Healthcare Utilization, Clinical Guidelines, MRI
Imaging Modality | Appropriate Indications | Inappropriate Use | Red Flag Requirements |
|---|---|---|---|
X-ray (Plain Radiograph) | Age >50 years with new onset LBP History of significant trauma Suspected vertebral fracture Red flag symptoms present Failed conservative therapy >6 weeks | Routine screening in LBP Non-specific pain <6 weeks No red flag symptoms Repeat imaging <3 months | Fever + back pain Progressive neurological deficit Bowel/bladder dysfunction |
MRI (Magnetic Resonance Imaging) | Progressive neurological deficits Cauda equina suspected Infection/malignancy suspected Failed conservative therapy >6-12 Weeks Pre-surgical planning | Acute non-specific LBP No neurological symptoms <6 weeks therapy Patient reassurance only Chronic pain without new symptoms | Progressive motor weakness Saddle anesthesia History of malignancy Immunosuppression + fever |
CT (Computed Tomography) | Contraindication to MRI Suspected fracture not visible on Xray Bone detail required Emergency setting with red flags Post-surgical complications | Soft tissue evaluation Non-specific chronic pain Routine follow- up Primary diagnostic tool | Same as MRI • When MRI unavailable • Acute trauma with neuro deficit |
Year | Total LBP Cases | Annual Growth | CT+MRI Orders | Imaging Rate (%) | MRI Orders (90%) | CT Orders (10%) | X-ray Orders |
|---|---|---|---|---|---|---|---|
2020 | 2,400 | - | 1,680 | 70.0% | 1,512 | 168 | 720 |
2021 | 2,700 | 12.5% | 2,025 | 75.0% | 1,823 | 202 | 675 |
2022 | 3,105 | 15.0% | 2,484 | 80.0% | 2,236 | 248 | 621 |
2023 | 3,571 | 15.0% | 3,035 | 85.0% | 2,732 | 303 | 536 |
2024 | 4,107 | 15.0% | 3,613 | 88.0% | 3,252 | 361 | 494 |
Year | Total LBP Cases | MRI Orders | MRI Costs (₹) | CT Orders | CT Costs (₹) | X-ray Orders | X-ray Costs (₹) | Total Imaging Costs (₹) |
|---|---|---|---|---|---|---|---|---|
2020 | 2,400 | 1,512 | 83,16,000 | 168 | 6,72,000 | 720 | 2,88,000 | 92,76,000 |
2021 | 2,700 | 1,823 | 1,00,26,500 | 202 | 8,08,000 | 675 | 2,70,000 | 1,11,04,500 |
2022 | 3,105 | 2,236 | 1,22,98,000 | 248 | 9,92,000 | 621 | 2,48,400 | 1,35,38,400 |
2023 | 3,571 | 2,732 | 1,50,26,000 | 303 | 12,12,000 | 536 | 2,14,400 | 1,64,52,400 |
2024 | 4,107 | 3,252 | 1,78,86,000 | 361 | 14,44,000 | 494 | 1,97,600 | 1,95,27,600 |
Sector | LBP Cases | Advanced Imaging Rate | MRI Orders | CT Orders | X-ray Orders | Total Imaging Cost (₹) | Cost per Case (₹) |
|---|---|---|---|---|---|---|---|
Private Practice | 822 | 88.0% | 650 | 73 | 164 | 41,22,800 | 5,016 |
Spine/Neurology | 1,232 | 92.4% | 1,023 | 114 | 95 | 61,02,100 | 4,952 |
Insurance/Govt | 2,054 | 95.8% | 1,579 | 174 | 235 | 81,49,600 | 3,968 |
Total | 4,107 | 91.2% | 3,252 | 361 | 494 | 1,83,74,500 | 4,474 |
Sector | Total Cost (₹) | Clinical Improvement (%) | Cost per Improved Case (₹) | Return to Work (%) | Cost per QALY (₹) | Value Rating |
|---|---|---|---|---|---|---|
Private Practice | 41,22,800 | 68.4% | 7,334 | 72.1% | 85,000 | Good |
Spine/Neurology | 61,02,100 | 71.8% | 6,896 | 75.3% | 1,25,000 | Moderate |
Insurance/Govt | 81,49,600 | 58.2% | 14,008 | 61.7% | 1,65,000 | Poor |
Metric | 2020 | 2024 | Absolute Change | Percentage Change |
|---|---|---|---|---|
Total Imaging Costs (₹ Crores) | 0.93 | 1.95 | +1.02 | +110% |
MRI Costs (₹ Crores) | 0.83 | 1.79 | +0.96 | +115% |
CT Costs (₹ Crores) | 0.07 | 0.14 | +0.07 | +115% |
X-ray Costs (₹ Lakhs) | 2.88 | 1.98 | -0.90 | -31% |
Cost per Case (₹) | 3,865 | 4,753 | +888 | +23% |
Advanced Imaging Share (%) | 89.5% | 98.9% | +9.4% | - |
Sector | Current Cost (₹) | Guideline-Adherent Cost* (₹) | Potentially Avoidable (₹) | Savings Potential (%) |
|---|---|---|---|---|
Private Practice | 41,22,800 | 32,98,240 | 8,24,560 | 20.0% |
Spine/Neurology | 61,02,100 | 54,91,890 | 6,10,210 | 10.0% |
Insurance/Govt | 81,49,600 | 48,89,760 | 32,59,840 | 40.0% |
Total | 1,83,74,500 | 1,36,79,890 | 46,94,610 | 25.6% |
Sector | Clinical Improvement at 6 weeks | Return to Work/Activity | Patient Satisfaction | Cost per QALY |
|---|---|---|---|---|
Private Practice | 68.4% | 72.1% | 7.2/10 | ₹85,000 |
Spine/Neurology | 71.8% | 75.3% | 7.8/10 | ₹125,000 |
Insurance/Govt Schemes | 58.2% | 61.7% | 6.1/10 | ₹165,000 |
Country/Region | MRI Cost (₹) | CT Cost (₹) | X-ray Cost (₹) | Guideline Adherence (%) | Cost-Effectiveness Index |
|---|---|---|---|---|---|
India (This Study) | 5,500 | 4,000 | 400 | 34% | 2.3 |
India (Private) | 6,500 | 5,000 | 500 | 40% | 2.1 |
OECD Average* | 8,800 | 6,200 | 800 | 65% | 1.4 |
Best Practice Target | 5,500 | 4,000 | 400 | 80% | 1.0 |
ACP | American College of Physicians |
AJNR | American Journal of Neuroradiology |
BMC | BioMed Central |
BMJ | British Medical |
Journal CT | Computed Tomography |
DOI | Digital Object Identifier |
GDP | Gross Domestic Product |
IPD | Inpatient Department |
LBP | Low Back Pain |
MRI | Magnetic Resonance Imaging |
NHS | National Health Service |
OECD | Organisation for Economic Co-operation and Development |
ID PRISMA | Preferred Reporting Items for Systematic Reviews and Meta-Analyses |
QALY | Quality-Adjusted Life Year |
VA/DOD | Veterans Affairs/Department of Defense |
WHO | World Health Organization |
| [1] | Bansal D, Asrar MM, Ghai B, Pushpendra D. Prevalence and Impact of Low Back Pain in a Community- Based Population in Northern India. Pain Physician. 2020; 23(4): E389-E398. |
| [2] | Prevalence of low back pain in India: A systematic review and meta-analysis. PubMed. 2022; 35964222. |
| [3] | World Health Organization. WHO guidelines for nonsurgical management of chronic primary low back pain in adults in primary and community care settings. December 2023. Available from: |
| [4] | Zhou T, Salman D, McGregor AH. Recent clinical practice guidelines for the management of low back pain: A global comparison. BMC Musculoskeletal disorder 2024; 25(1): 344. |
| [5] | Chou R, Qaseem A, Snow V, et al. Diagnosis and Treatment of Low Back Pain: A Joint Clinical Practice Guideline from the American College of Physicians and the American Pain Society. Ann Intern Med. 2007; 147(7): 478-491. |
| [6] | Best practices for the evaluation and management of Low Back Pain: A consensus from Indian pain specialists. Indian Journal of Pain. 2024; 38(1). |
| [7] | VA/DOD Clinical Practice Guidelines for the Diagnosis and Treatment of Low Back Pain. Version 3.0- 2022. Washington, DC: US Government Printing Office. Available from: |
| [8] | Do "Myths" of low back pain exist among young Indian college-going adults with a history of low back pain? This was a cross-sectional study. Bulletin of the Faculty of Physical Therapy. 2021. |
| [9] | Flynn TW. Appropriate Use of Diagnostic Imaging in Low Back Pain: A Reminder That Unnecessary Imaging May Do as Much Harm as Good. J Orthop. Sports. Phys. Ther. 2011; 41(11): 838-846. |
| [10] | Understanding the overuse of diagnostic imaging for patients with low back pain in the Emergency Department: A qualitative study. PubMed. 2021; 34045266. |
| [11] | Sharma S, Traeger AC, Tcharkhedian E, et al. "I would not go to him": Focus groups exploring community responses to a public health campaign aimed at reducing unnecessary diagnostic imaging of low back pain. Health Expect. 2021; 24(2): 648-658. |
| [12] | Jellema P, van der Windt DA, van der Horst HE, et al. Should the treatment of (sub)acute low back pain be aimed at psychosocial prognostic factors? Cluster randomised clinical trial in general practice. BMJ. 2005; 331: 84. |
| [13] | Steenstra IA, Verbeek JH, Heymans MW, et al. Prognostic factors for duration of sick leave in patients with acute low back pain: A systematic review of the literature. Occup Environ Med. 2005; 62: 851-60. |
| [14] | Diagnostic Imaging for Low Back Pain: Advice for High-Value Health Care From the American College of Physicians. Annals of Internal Medicine. 2011. |
| [15] | Traeger AC, Machado GC, Bath S, et al. Appropriateness of imaging decisions for low back pain presenting to the emergency department: A retrospective chart review Int J Qual Health Care. 2020. |
| [16] | Borczuk P. An evidence-based approach for the evaluation and treatment of low back pain in the emergency department. Emerg Med Pract. 2013; 15(7): 1-23. |
| [17] | Jermini-Gianinazzi I, Blum M, Trachsel M, et al. Management of acute non-specific low back pain in the emergency department: Do emergency physicians follow these guidelines? Results of the cross-sectional survey. BMJ Open. 2023; 13(8): e071893. |
| [18] | Morgan T, Wu J, Ovchinikova L et al. A national intervention to reduce imaging for low back pain by general practitioners: A retrospective economic program evaluation using Medicare Benefits Schedule data. BMC Health Serv Res. 2019; 19(1): 983. |
| [19] | Effectiveness of Interventions to Decrease Image Ordering for Low Back Pain Presentations in the Emergency Department: A Systematic Review. PubMed. 2018; 29315969. |
| [20] | Hall A, Richmond H, Pike A, et al. What behavior-change techniques have been used to improve adherence to evidence-based low back pain imaging? Implement Sci. 2022. |
| [21] | Zare S, Mobarak Z, Meidani Z, et al. Effectiveness of Clinical Decision Support Systems on the Appropriate Use of Imaging for Central Nervous System Injuries: A Systematic Review. Appl Clin Inform. 2022; 13(1): 37-52. |
| [22] | Coombs DM, Machado GC, Richards B et al. Effectiveness of a multifaceted intervention to improve emergency department care of low back pain: a stepped-wedge, cluster-randomized trial. BMJ Qual Saf. 2021; 30(10): 825-835. |
| [23] | Venkatesh AK, Scofi JE, et al. Choosing wisely in emergency medicine: early results and insights from the ACEP emergency quality network (E-QUAL). Am J Emerg Med. 2021; 39: 102-108. |
| [24] | Use of imaging studies for Low Back Pain (LBP). NCQA HEDIS Measures. 2024. |
| [25] | Flanagan P, Waller R, Lin I, et al. Interventions to improve the quality of low back pain care in emergency departments: A systematic review and meta-analysis. Intern Emerg Med. 2024; 19(7): 2057-2076. |
| [26] | Jarvik JG, Deyo RA. Diagnostic evaluation of low back pain with emphasis on imaging. Ann Intern Med. 2002; 137(7): 586-597. |
| [27] | Chou R, Fu R, Carrino JA, Deyo RA. Imaging strategies for low back pain: systematic review and meta-analysis. Lancet. 2009; 373(9662): 463-472. |
| [28] | Brinjikji W, Luetmer PH, Comstock B, et al. Systematic literature review of the imaging features of spinal degeneration in asymptomatic populations. AJNR Am J Neuroradiol. 2015; 36(4): 811-816. |
| [29] | Webster BS, Cifuentes M. Relationship of early magnetic resonance imaging for work-related acute low back pain with disability and medical utilization outcomes. J Occup Environ Med. 2010; 52(9): 900-907. |
| [30] | Deyo RA, Diehl AK. Lumbar spine films in primary care: Current use and effects of selective ordering criteria. J Gen Intern Med. 1986; 1(1): 20-25. |
| [31] | Modic MT, Obuchowski NA, Ross JS, et al. Acute low back pain and radiculopathy: MR findings and their prognostic role and effect on outcome. Radiology. 2005; 237(2): 597-604. |
APA Style
Kapoor, A. (2025). Current Trends in Low Back Pain Diagnostics in India: A Five-Year Scenario Analysis (2020-2024). International Journal of Health Economics and Policy, 10(4), 140-150. https://doi.org/10.11648/j.hep.20251004.11
ACS Style
Kapoor, A. Current Trends in Low Back Pain Diagnostics in India: A Five-Year Scenario Analysis (2020-2024). Int. J. Health Econ. Policy 2025, 10(4), 140-150. doi: 10.11648/j.hep.20251004.11
@article{10.11648/j.hep.20251004.11,
  author = {Atul Kapoor},
  title = {Current Trends in Low Back Pain Diagnostics in India: A Five-Year Scenario Analysis (2020-2024)
},
  journal = {International Journal of Health Economics and Policy},
  volume = {10},
  number = {4},
  pages = {140-150},
  doi = {10.11648/j.hep.20251004.11},
  url = {https://doi.org/10.11648/j.hep.20251004.11},
  eprint = {https://article.sciencepublishinggroup.com/pdf/10.11648.j.hep.20251004.11},
  abstract = {Background: Low back pain (LBP) represents a significant healthcare burden in India, with prevalence rates ranging from 6.2% to 92% across different populations. Despite evidence-based guidelines recommending conservative management and selective imaging, diagnostic overutilization remains a challenge across healthcare sectors. This study analyzed diagnostic utilization patterns and referral trends from various healthcare settings over a five-year period to evaluate the extent of inappropriate imaging use and its economic implications. Objective: To evaluate diagnostic imaging trends, referral patterns, guideline adherence, and positivity rates for lower back pain across different healthcare sectors in India, assess the extent of diagnostic overuse, and analyze cost-effectiveness patterns across private practice, specialist care, and insurance/government healthcare schemes. Methods: A retrospective analysis of simulated data representing diagnostic trends from to 2020-2024 across primary care practices (n=1,200), inpatient departments from secondary and tertiary care hospitals (n=450), insurance-covered services (n=850,000), and social organization healthcare programs (n=320) was conducted. Cases were classified using evidence-based clinical categories following the PRISMA guidelines, with outcome measures including diagnostic referral patterns, guideline adherence rates, positivity rates for actionable findings, and comprehensive cost-effectiveness analysis using Quality-Adjusted Life Years (QALYs). Results: Significant overutilization of imaging studies was observed across all sectors, with total LBP cases increasing by 71% over five years, while CT+MRI imaging rates rose dramatically from 70% to 88%. MRI utilization increased by 115% (1,512 to 3,252 studies), whereas cost-effective X-ray utilization declined by 31% (720 to 494 examinations). Total imaging costs escalated from ₹92.76 lakhs in 2020 to ₹1.95 crores in 2024, representing a 110% increase that substantially outpaced the case volume growth. Adherence to clinical guidelines remained consistently poor at 23-34% across sectors, with insurance/government schemes showing the worst compliance (15.2%) despite the highest imaging approval rates (95.8%). Cost-effectiveness analysis revealed stark disparities: private practice achieved ₹85,000 per QALY, while insurance/government sectors reached ₹1.65 lakhs per QALY, indicating poor economic efficiency despite subsidized rates. Conclusions: The analysis revealed a healthcare system paradox, wherein increased imaging intensity correlated with poorer clinical outcomes and economic efficiency. Urgent reforms, including MRI utilization controls, mandatory clinical reasoning documentation, and guideline-based audit programs, are essential to restore value-based care delivery.
},
 year = {2025}
}
TY  - JOUR
T1  - Current Trends in Low Back Pain Diagnostics in India: A Five-Year Scenario Analysis (2020-2024)

AU  - Atul Kapoor
Y1  - 2025/09/26
PY  - 2025
N1  - https://doi.org/10.11648/j.hep.20251004.11
DO  - 10.11648/j.hep.20251004.11
T2  - International Journal of Health Economics and Policy
JF  - International Journal of Health Economics and Policy
JO  - International Journal of Health Economics and Policy
SP  - 140
EP  - 150
PB  - Science Publishing Group
SN  - 2578-9309
UR  - https://doi.org/10.11648/j.hep.20251004.11
AB  - Background: Low back pain (LBP) represents a significant healthcare burden in India, with prevalence rates ranging from 6.2% to 92% across different populations. Despite evidence-based guidelines recommending conservative management and selective imaging, diagnostic overutilization remains a challenge across healthcare sectors. This study analyzed diagnostic utilization patterns and referral trends from various healthcare settings over a five-year period to evaluate the extent of inappropriate imaging use and its economic implications. Objective: To evaluate diagnostic imaging trends, referral patterns, guideline adherence, and positivity rates for lower back pain across different healthcare sectors in India, assess the extent of diagnostic overuse, and analyze cost-effectiveness patterns across private practice, specialist care, and insurance/government healthcare schemes. Methods: A retrospective analysis of simulated data representing diagnostic trends from to 2020-2024 across primary care practices (n=1,200), inpatient departments from secondary and tertiary care hospitals (n=450), insurance-covered services (n=850,000), and social organization healthcare programs (n=320) was conducted. Cases were classified using evidence-based clinical categories following the PRISMA guidelines, with outcome measures including diagnostic referral patterns, guideline adherence rates, positivity rates for actionable findings, and comprehensive cost-effectiveness analysis using Quality-Adjusted Life Years (QALYs). Results: Significant overutilization of imaging studies was observed across all sectors, with total LBP cases increasing by 71% over five years, while CT+MRI imaging rates rose dramatically from 70% to 88%. MRI utilization increased by 115% (1,512 to 3,252 studies), whereas cost-effective X-ray utilization declined by 31% (720 to 494 examinations). Total imaging costs escalated from ₹92.76 lakhs in 2020 to ₹1.95 crores in 2024, representing a 110% increase that substantially outpaced the case volume growth. Adherence to clinical guidelines remained consistently poor at 23-34% across sectors, with insurance/government schemes showing the worst compliance (15.2%) despite the highest imaging approval rates (95.8%). Cost-effectiveness analysis revealed stark disparities: private practice achieved ₹85,000 per QALY, while insurance/government sectors reached ₹1.65 lakhs per QALY, indicating poor economic efficiency despite subsidized rates. Conclusions: The analysis revealed a healthcare system paradox, wherein increased imaging intensity correlated with poorer clinical outcomes and economic efficiency. Urgent reforms, including MRI utilization controls, mandatory clinical reasoning documentation, and guideline-based audit programs, are essential to restore value-based care delivery.

VL  - 10
IS  - 4
ER  -
Department of Radiology, Advanced Diagnostics, Amritsar, India
Information