3. Materials and Methods
3.1. Study Setting
The study was conducted in the Kasena Nankana Traditional area, which comprised the Kasena Nankana Municipal area and the Kasena Nankana West District of the Upper East Region of Ghana.
3.2. Research Design
The paper adopted a Mixed Methods approach. This approach allowed for triangulation of methods which enabled both explanation and generalization; trust-worthiness and rigor
| [25] | Haq M. A Comparative Analysis of Qualitative and Quantitative Research Methods and a Justification for Adopting Mixed Methods in Social Research [Internet]. 2014. Available from:
http://bradscholars.brad.ac.uk http://hdl.handle.net/10454/7389 |
[25]
. It also facilitated comparison of qualitative data from smallholder farmers’ climate change and variability worldviews with meteorological data. It also made it possible to achieve the dual objective of assessing the impact of climate change and variability due to floods and droughts on smallholder farmers’ strategies and how traditional knowledge could mediate policy formulation, planning and implementation of projects and programmes towards sustainable adaptation and or resilience building. The household was the preferred unit of analysis since livelihood activities in the study areas revolve around the agricultural use of water. The smallholder farmer household and community level analyses were conducted because there is a continuum of interactions, activities and processes at macro levels that shape the underlying reality of households and individual farmers.
3.3. Sampling Strategy
The communities that participated in the study were sampled because they have perennially experienced droughts, destructive torrential rain and occasional flooding, which are linked with climate change and variability; especially in the case of communities like Naaga, Manyoro and Gumongo that are characterized by extensive river networks. The Naaga community for example, which is low lying, usually experiences extensive flooding whenever the Bagri dam in Burkina Faso overflows its water-holding elastic capacity resulting in spillage of the excess water by the Burkinabe authorities, in order to save the dam from collapse. In that scenario, the combined effect of natural and man-made elements cause flooding of the area. Bonia is another community at the heart of the Tono River basin and have had some of its areas, particularly farms, always flooded at the peak of the rainy seasons. All the communities sampled also had visible signs of creeping desertification. According to a report by
| [26] | Agyemang I, Abdul-Korah R. Strategies to combat desertification in Northern Region of Ghana: The role of Environmental Protection Agency [Internet]. Vol. 2. 2014; 2(2): 34–43.
http://www.netjournals.org/z_PSRI_14_013.htm |
[26]
, the nature of desertification in the northern regions is extensive, and this covers the Kasena Nankana area.
Agricultural households of Kasena Nankana West District and the Kasena Nankana East Municipal area are estimated to be 5,499 households
. In spite of the fact that the Kasena Nankana area is traditionally divided into the South, West, East and North zones, for the purpose of this study, communities in the area were clustered around the various paramountcies, notably: Paga, Chiana, Katiu, Nakong, Kayoro, Mirigu, and Sirigu (Kasena Nankana West District); Navrongo, Kologo and Naaga (Kasena Nankana East Municipal area). In all, eleven (11) rural communities were purposively drawn taking into consideration the nature of their livelihood pursuits. Each community was allotted a quota of households proportionate to its total number of compounds. Consequently, a sample size of 373 households was drawn. Simple random sampling was then used to select the specific compounds for engagement in the study. This was facilitated by the fact that through the Navrongo Health Research Centre’s health research activities in the area, houses have been already duly numbered. The Navrongo Health Research Centre’s housenumbering system was relied upon in order to draw the final sample for the study.
To ensure equitable distribution of the sample population, the ratio of households in each community and the total households was used to distribute the sample size determined using Yamane’s sample size determination formula. The number of households in each of the communities was proportionately extracted from the sample size of 373 households (
Table 1).
Table 1. Sampled Smallholder Farming Communities in the Study Area.
No. | Paramountcy/Community | Number of households | Percentage of total number of households | Sample size |
1 | Kologo | 282 | 5 | 19 |
2 | Naaga | 373 | 7 | 25 |
3 | Paga-Nyania | 1968 | 36 | 133 |
4 | Chiana Asunia | 219 | 4 | 15 |
5 | Katiu | 234 | 4 | 16 |
6 | Manyoro | 809 | 15 | 55 |
7 | Akurugu Dabo | 291 | 5 | 20 |
8 | Mirigu Gumongo | 290 | 5 | 20 |
9 | Nyangania Sabonia | 201 | 4 | 14 |
10 | Bonia | 272 | 5 | 18 |
11 | Kandiga Akuka | 560 | 10 | 38 |
Total | | 5499 | 100 | 373 |
However, only 365 households responded to the household survey questionnaire completely.
3.4. Data Collection Strategy
Apart from the semi structured household questionnaire that was administered, in-depth interviews were conducted at Katiu, Manyoro, Paga, Nyania, Gumongo, Naaga, Nyangania and Bonia. Nine individuals were interviewed. This comprised of 5 elders (one of whom doubled as an Assembly member, another one was a soothsayer while the third was a female pastor), 3 of the elders were old ladies, 3 chiefs and 1 landlord. The average age of the interviewees was 75 years. The in-depth interviews were organized based on the three case groups identified under selection of the study sites and clustering according to the ten traditional chieftaincy paramountcies in the study area.
Women were essential in this study because they cultivate much of the food crops and contribute close to 46% to national development
| [28] | Zaato PA, Naazie GK, Baidoo JK, De La Salle Tignegre JB, Sawi M. Gender dynamics in smallholder vegetable farmers’ production in Ghana. Discover Sustainability. 2025 Dec 1; 6(1). https://doi.org/10.1007/s43621-025-01726-4 |
[28]
, although they bear the unparalleled brunt of the challenges posed by climate variability. Their situation is precarious because male-dominated societal stratifications in the study communities worsen the situation of female vulnerability to climatic stressors and shocks. Studying such a category of people allows for a deeper understanding of the realities of climate variability, which is crucial for policy planning and intervention.
Focus group discussions were indispensable. In all, 7 Focus Group Discussions were held in Chiana Asunia, Nyangania, Naaga, Akurugu Dabo, Paga Nyania, Manyoro and Bonia. A total of 61 smallholder farmers other than household heads participated. This number of farmers comprised of 35 males and 26 females. Separate Focus Group Discussions were held for males, females and the youth. The average size of each focal group was deliberately maintained at 8 members to ensure absolute control over the discussions and also ensure effective participation of group members in the discussions. This was done because the existing patriarchal structures may not freely allow women to actively express themselves in the presence of men. The thematic areas covered by the Focus Group Discussion guide included livelihood patterns, views on climate variability, observed variations in time and space as well as how these changes impacted on livelihoods and resilience building. In addition, attention was also directed towards participants’ perceptions of vulnerability to climate variability, the nature of the impacts on smallholder farm households and their adaptation strategies. The results of the Focus Group Discussions helped in confirming results from the administration of the semi-structured questionnaire and the in-depth interviews conducted.
3.5. Data Processing Strategy
Quantitative data were analysed using descriptive statistics while qualitative data were analysed thematically following the steps of data immersion, transcribing the audio recordings, reading through the transcripts over and over again, developing codes for themes that emerged and coding before coherent narratives were constructed.
3.6. Ethical Considerations
Ethical approval was granted by the Research Ethics Review Board of the University of Business and Integrated Development Studies, Wa, Ghana (UBIDS/RERB/001/2022/09/003). The study was conducted in accord with the key research ethics guiding principles of the 1964 Helsinki declaration and the 1976 Belmont report. The aims of the study were explained to the participants. Informed consent was obtained from all participants involved in this study. The consent of all respondents and study participants was sought by enabling them to fill an informed consent form. The respondents and participants were also assured of their privacy and confidentiality regarding publication of their personal details and traceability of the data they provided. They were also informed that they reserved the right either to respond or not to respond to questions that were posed to them and could also withdraw their participation at any stage of the study.
4. Results
Table 2 reveals that 23.86 percent of the household respondents were between 18-40 years, 21/18 percent of the respondents were within the 41-50 years age cohort, 24.40 percent had ages ranging from 51-60 and 17.69 percent of them were within the 61-70 age cohort.
Table 2. Background of Respondents.
Age Cohort | Respondents | Percentage |
< 18 -40 Years | 89 | 23.86 |
41-50 years | 79 | 21.18 |
51-60 years | 91 | 24.40 |
61-70 years | 66 | 17.69 |
> 71 | 48 | 12.87 |
Gender | | |
Male | 230 | 61.6622 |
Female | 143 | 38.3378 |
Household Size | | |
≤ 4 people | 123 | 33.3 |
5 to 6 people | 103 | 27.9 |
≥ 7 people | 147 | 38.8 |
Small holder farm households’ understanding and perceptions of climate phenomena provide a compelling reason for farmers’ decisions regarding their approach to farming. This includes which knowledge systems or more specifically which strategies to adopt, how to adapt known strategies and or the search for entirely new ways of dealing with risks. Exploring climate risks and perceptions of climate is therefore imperative to understanding the efficacy of their adaptation.
4.1. Vulnerability of Smallholder Farm Households to Extreme Climatic Factors in the Study Area
Interactions with various knowledge communities in the study areas including chiefs, landlords, elders, farmers and opinion leaders indicated that the climate has changed. They also pointed out that the perceived change has not been a one-point occurrence but a phenomenon that is on-going and fueled by human factors as evidenced by the following words of an 84-year-old Key Informant 1:
“God, man and nature are different but God oversees us and nature. This relationship between God, man and nature has changed and man is responsible for the change. We have refused to live according to the dictates of God and that is why our lives are worsening. There has been a change in the climate because human beings have not lived up to expectation. Over the past 20 years we have cleared so many trees, used so much agro chemicals to destroy the environment and burned so much that the water bodies and the air now heavily polluted. The air we breathe these days is no longer pure. The rainfall is no longer distributed properly and the amount of rain has reduced. When we farm, we longer get good yield. That was not the case in the past. The soil was fertile and you do not need to apply fertilizer but now, you cannot harvest anything without fertilizer. There has been flooding in this community because where we are not supposed to farm, we clear it for farming and where we are not supposed to build that is exactly where we built. In the past there were droughts but that did not result in so much suffering as is the case today. In the past, the dry spells come at the right time and allowed farmers to weed their farms. Every year, we now experience dry spells. just at the time the crops need water, the dry spells set in, even the time the rains start has shifted from April to June and the end of the rains is no longer November but September every year” (Interview with Key Informant 2).
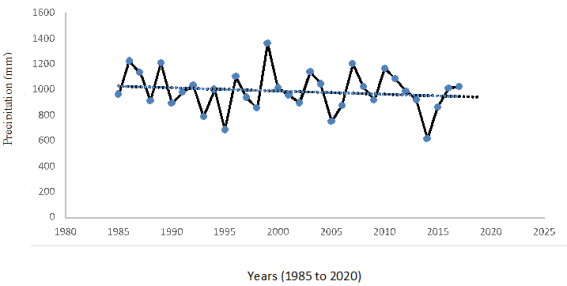
Meteorological data from 1985 to 2017, paints a vivid picture of the trend and changes of rainfall over the last thirty-two years
(Figure 2).
Figure 2. Annual Precipitation in the Kasena Nankana Area.
With an annual rainfall average of 926.22 mm, the Kasena-Nankana area typifies the Guinea Savannah and marks the transition to the Sudan Savannah.
Figure 2 displays average annual precipitation for the study area has slightly declined with coefficient of -2.53 and R
2 value of 0.024. However, the general decline is masked by extreme variability which occurred in 1999 and 2014. In 1999, rainfall reached its highest with 1365 mm while 2014 marked the lowest point in the three decades with just about 617.2 mm. Although the general averages are important in overall characteristics of changing climatic pattern, extreme variability are defining moments for livelihood security in agrarian households. Generally, nineteen of the thirty-two years reviewed had average or below average rainfall. Sixteen out of the nineteen years recorded rainfall clearly below the expected average. The findings show that the period 2000 to 2017 especially has been characterized by less than average rainfall. About a quarter of the smallholder farmers were of the opinion that the volume of rainfall had declined significantly.
The findings also show that annual total rainfall may not be as important as rainfall distribution within the farming period as reflected in the Focus Group Discussants’ narratives.
We have changed and that is why we are experiencing climate change. This change is not a positive change. Everything that we have changed worked effectively against our progress. The rainfall pattern has changed unfavourably because in the past planting always started a season earlier, especially towards the end of the harvest period (Katiu, Focus Group Discussants).
Timing of rainfall is vital for crop germination and people’s experiences, ways of knowing, perceptions, feelings, traditional norms, values and belief systems; aside mainstream science are necessary in securing in-depth appreciation and coming to terms about the reality of climate change. This helps farmers in determining appropriate coping, adaptation and mitigation measures towards building their resiliency. Close to 95% of the households who indicated that the climate has changed and cited local evidences of variability and change.
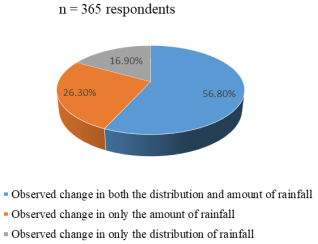
The reasons that household respondents gave included rainfall variability in terms of its distribution (
Figure 3). The respondents also noted that precipitation and diurnal temperature patterns are no longer exhibiting patterns that were common in a couple of previous decades. They added that recent temperatures were particularly very high.
Figure 3. Smallholder Farm Households' views on change and variability of Precipitation.
According to 60% of the household respondents, the change in the rainfall pattern is manifested in the form of late beginning of the rains and their early cessation. The rest of the 38.9% of the 373 respondents indicated that there has been a reduction in the rainy months in a year.
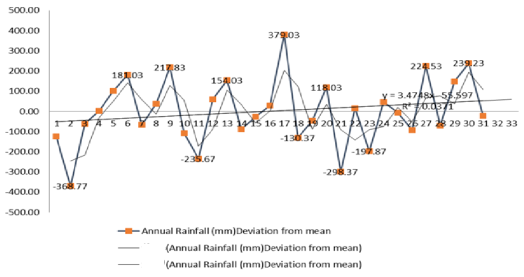
The results further show that within a period of three decades (1985-2017), rainfall deviation from the mean has been remarkably negative in some years (1995 and 2014) leading to various incidences of meteorological droughts and very high in others (1986 and 1999) resulting in occasional flooding (
Figure 4).
Figure 4. Annual Precipitation Deviation from the Mean.
From
Figure 4, years of recovery are followed by at least two successive years of below average rainfall. The Standard Precipitation Index (SPI) also show that 1986, 1989, 1999, 2007 and 2010 were very wet years as opposed to 1993, 1995, 2005 and 2014 were severely dry years. The rest of the years were either nearly normal or moderately dry years.
Farmers’ experiences with climate variability and change are therefore not only a manifestation of poor yields and dwindling income levels but also a precarious situation of household water availability and access, as well as poor control. This is further worsened by competing demand for water for alternative uses. Rainfall variability is expressed in agricultural productivity and translated into low income.
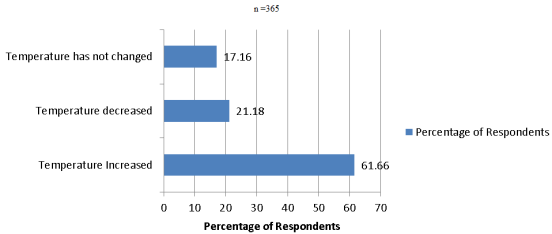
Technically, air temperature as measured using a Stevenson Screen in degree Celsius is the average of daily minimum and maximum for each month as an annual statistic overall year record. The concept Long-term in this study refers to the period from 1985 to 2017 (33 years). Temperature perception, on the other hand, is based on the feelings of the people experiencing the phenomenon. In that regard apparent temperature may be different from the actual temperature due to the presence of wind chill and humidity. Out of the 365 household respondents, 82.84 percent of them demonstrated the opinion that the mean long-term temperature has changed and nearly 61.66 percent believed that the change is reflected in increased temperature. Only 64 (17.16 percent) did not notice changes in temperature with 21.18 percent of respondents observing a decreased temperature (
Figure 5).
Figure 5. Smallholder Farm Households’ Views on Temperature change and Variability.
Key Informant Interviewee 3 summarized the varied nature of temperature in his area as follows:
“The climate has changed over time. This community used to have a lot of trees but the land is now bare. The lush vegetation has vanished. Temperatures are now higher than previously; it no longer rains like it used to do. There are now more frequent dry spells and occasional droughts. All these are caused by human activities such as farming close to rivers, clearing of the vegetation for farming, building construction, sand winning among many others. Bush burning has also taken a heavy toll on the environment. The effects are there for everyone to see. We produce very little and it is not adequate to last even three months after harvesting. We have to sell livestock to buy food, which is now very expensive. Because of this, very few young men are now willingly to take to farming. Incidence of diseases like Cerebral Spinal Meningitis is pronounced. Our people, especially the youth now die earlier and suddenly than it was the case in the past”.
It must be noted that in spite of the general conclusions that smallholder farmers made about the nature of temperature variation over the previous decades, there were peculiarities in a number of communities as outlined in
Table 3.
Table 3. Smallholder Farm Households' Views on Temperature Change and Variability disaggregated by community.
Community | Nature of Temperature change (% of Respondents in each community) |
Increased | Decreased | no changes |
Kologo | 84.2% | 10.5% | 5.3% |
Naaga | 60.9% | 13.0% | 26.1% |
Paga | 63.8% | 20.5% | 15.7% |
Chiana Asunia | 50.0% | 14.3% | 35.7% |
Katiu | 46.7% | 33.3% | 20.0% |
Manyoro | 67.3% | 17.3% | 15.4% |
Akurugu Dabo | 42.9% | 42.9% | 14.3% |
Mirigu-Gumongo | 44.4% | 38.9% | 16.7% |
Nyangania Sabonia | 50.0% | 8.3% | 41.7% |
Bonia | 43.8% | 50.0% | 6.3% |
Kandiga Akuka | 51.5% | 21.2% | 27.3% |
Total | 222 | 79 | 64 |
Generally, 222 respondents and at least not less than 43 percent of respondents in each community perceived temperature increase over the last three decades. The exception was Akurugu Dabo where perception of increasing temperature is about two in five. Also, whereas 84.2 percent of respondents at Kologo community indicated that average annual temperature has increased over time, only 40% of them in Akurugu Dabo shared that view.
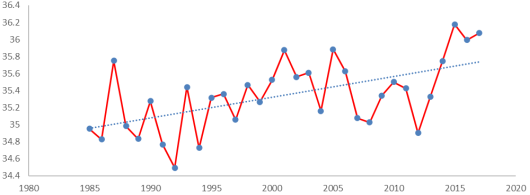
Meteorological observation of temperature from the Navrongo weather station from 1985 to 2017 shows an association between high temperature and drought years. In this paper, mean annual maximum temperatures are analysed. All years of below average rainfall are associated with years of above average temperatures. Navrongo recorded its lowest rainfall ever recorded in thirty years in 2014 albeit with slight recovery in 2015. This low record was associated with a high temperature record in 2015. However, years of high rainfall are not necessarily associated with average and below average temperatures as other non-climatic variables such as volcanic eruptions at the global level could have significant impact on local temperatures. For instance, the eruption of Mount Pinatubo in June 1991 and the consequent injection of Sulphur into the stratosphere has been linked to low temperatures in many communities including the Kasena Nankana area in 1992 (
Figure 6).
Figure 6. Annual Temperature trend from 1985 to 2020.
Across board, post 1983 temperature reduced from the 1980 level before sharply rising in 1985 and peaked around 1987 and subsequently declined to an all-time low in 1992. The temperature level subsequently rose sharply again between 1993 and 1994 and by 1995, it had declined again but not below the 1983 level before rising steadily until it reached an all-time peak of 36.2°C in 2015. This year 2015 was therefore the warmest in Navrongo.
An inter-decadal analysis of temperature deviation from the mean shows an increase in the frequency of deviation above the annual mean with the previous 3 decades recording the highest deviation above the mean temperature. In fact, the last three years (2015, 2016 and 2017) mark a consecutive three-year record of high temperatures in Navrongo. The observed changes the meteorological data have been linked with reduction in crop yields and output, which greatly food insecurity in the Kasena Nankana area. Such was the extent of variability and change in the climate that agricultural sector on which over 80% of the people in the area depended on as their main economic livelihood was severely challenged. This has had ripple negative effects on socio-economic development.
4.2. Impacts of Climate Variability and Change on Smallholder Farm Households
An analysis of the smallholder farm households’ views on consequences of climate variability and change revealed that the farmers possessed long-term extensive experiences of agricultural drought (95% of respondents). They noted that the frequency of occurrence of agricultural droughts has increased. A more nuanced community level analysis revealed differences in experiences of drought. The only community where 10% of farmers held that they had not experienced drought was Bonia. Bonia is just adjacent to the Tono Irrigation dam hence; the farmers may not experience much drought since a conducive micro climate is created by proximity to the irrigation dam thus ensuring that the fields are constantly kept moist for a congenial crop growth. In the dry season, water from the irrigation canal makes it possible for willing and able farmers to engage in irrigation farming. Irrigation farming in communities within the Tono Dam basin and others that have access to smaller dams and dugouts could always rely on them as a buffer to poor precipitation in the main rainy season farming. According focus group discussants at Katiu community, rainfall alone or sun shine alone is not good for farming. There must be moderation of all and good distribution of the rainfall, at least there is the need for one rain every week.
This was what a seventy-year-old woman, who was explaining the nature of rainfall in her village, said at a Focus Group Discussion. Her concern is shared also by participants in the course of the Focus Group Discussions in the other villages. Discussants indicated that the erratic nature of rainfall is a feature of the climate that poses risk to crop cultivation.
Smallholder farm households stated emphatically that although dry spells were considered normal when they occur at the time that a few dry days are required for weeding to take place, it brings progress in farming. This was the situation three decades ago but in recent times the dry spells occur at the time that the major crops rather required water. This situation adversely affects agricultural production and household water security (
Table 4).
Table 4. Impacts of Drought on Smallholder Farm Households.
| Frequency | Percent |
Crop failure | 269 | 73.69 |
Drying up of water source | 68 | 18.64 |
Trees dying | 28 | 7.67 |
Total | 365 | 100.0 |
Nearly three out of every four smallholder farm households (73.69%) reported crop failure as the major devastating result of the agricultural droughts that they experienced. Another 18.64% of the households reported the drying up of their water sources while 7.67% of the respondents indicated that dry spells have been occurring more often than in the past decades. Additionally, 41% of the respondents noted that floods occurred once in every five years while only 35.4% indicated that floods occurred every 2 years in the past. Irrespective of the interval of droughts and or dry spells, the reality is that drought-triggered water insecurity and excessive rainfall leading to flooding created various pressures that wiped out alternative livelihood options within the agriculture value chain.
Key informants interviewed and focus group discussants also pointed to what they generally called recent changes in the pattern of rainfall, as a risk factor in the climate:
“Right now, we are supposed to be harvesting early millet, but people are still sowing…. In the past, the rains used to start in April. People will sow massively in this month. Sowing was not done in June and July. The end of the rains was definite in the past. It was good for planning because every farmer knew that the rainy season ends in November. We were able to know the number of rains in a year. When it will rain and when it will not rain was common knowledge to farmers. However, these days you cannot be very certain but in most of the years, the rains ended at the end of August or early September. August rains have been very destructive. It makes it difficult to plan” (Key Informant 4).
Moreover, over 91% of the smallholder farm households were emphatic about the agricultural droughts, the late beginning of the rainy season and the destruction that perennial floods caused to their meagre assets.
Focus Group Discussions and in-depth interviews suggest that drought and flooding are the most devastating climate extremes and risks in the study areas. It was, particularly quite clear from many Focus Group Discussions that the long-term reliance on the single rainy season was a common reason for the migration of the youth from the villages to the towns and cities in southern Ghana. The movement is said to be a strategy that enable households to cope with the impact of climate risks and actual climate contingencies such as the effects of droughts in particular. According to the focus group discussants at Mirigu-Gumongo, in 2017, they experienced a drought and many crops got burnt. Those who cultivated crops on gravel and clay sand were most affected. The situation caused the youth to migrate to Tumu, Techiman, Sunyani and Kumasi to farm in order to bring back food to feed their families. This trend has not abated and currently, the major towns and cities are overwhelmed by congestion.
Participants at the Mirigu-Gumongo Focus Group Discussion noted that the variable climatic change they are experiencing is the cumulative result of their own insatiable desire for wealth. They added that in spite of all the traditional inhibitions, people still cut trees that are not tabooed or declared as traditional and spiritual relics. According to the participants, things that are immoral and should not be done under any circumstances are now being done by both youth and adults with reckless abandon. It was recognised that some of the youth even openly disrespect communal traditions. It was against this background that the participants concluded that their community acted willfully against the capacity of nature and God to continue to support them.
In the case of participants of the Katiu Focus Group Discussion, the vegetative cover was very lush in the past because their fore fathers consciously added to the tree species that were in existence at the time. By contrast, the current generation continuously depleted the environment without any serious efforts to at least replace the vegetation that they either cut or burn down.
Cultural despondency was noted by interviewees as a driver of climate variability and one of the reasons accounting for a reduction in the resiliency of adaptation strategies in recent times. A seventy-four-year-old woman interviewed at Katiu notes that God has always remained resolute in his pledge to care for human kind in ways that may not easily be understood by ordinary beings. According to her, there are good and bad spirits all of which are under the domain of God. As a result, God is able to deal drastically with the bad spirits that bring bad weather. However, humans are responsible for the calamities that befall them. It is their bad acts that compel God to respond or allowing the bad spirits to unleash various hazards on the human beings. According to her, their fore fathers were very obedient to their fathers and were brought up to venerate culture and tradition. However, current generations, especially the mentality of the youth is that tradition and culture are useless and have no place in their growth and development. In addition, she indicated that traditional knowledge and culture is expected to be passed on from previous generations to subsequent ones but Christianity and other so called modern religions in addition to current communication technology appears to have worked against the sustenance of tradition and local culture. For her, it is now much more difficult to propagate local culture and tradition than it was the case previously.
5. Discussion
Perception has been noted to have played a significant role in the determination of the efficacy of adaptation to variation and change in the climate. This is because the lived experiences and views of the people affected climatic extremes have the greatest possibility creating in-depth comprehension what is regarded as scientific analysis of meteorological data
. In the opinion of
, issues that weigh high in the mindset of people facilitates the scientific and social reliability of the representation of the issue at its most prominent level.
It has been indicated in the works of
| [32] | Christoplos I, Mitchell J, Liljelund A. Re-framing Risk: The Changing Context of Disaster Mitigation and Preparedness. Disasters. 2001. |
[32]
that the negative effects of climate variability and change are manifested through the extent of the sensitivity of human and natural eco-systems. The empirical report of
| [33] | Vogel C, Moser SC, Kasperson RE, Dabelko GD. Linking vulnerability, adaptation, and resilience science to practice: Pathways, players, and partnerships. Global Environmental Change. 2007; 17(3–4): 349–64.
https://doi.org/10.1016/j.gloenvcha.2007.05.002 |
[33]
even makes a definite claim that farmers whose livelihood is within a harsher environment may be richly endowed with quality knowledge and awareness regarding the changes that occurred overtime and the attendant adverse effects. The need for human and natural eco-systems to cope and adapt to climatic change within the short to long-term is not a novelty. Humans have some capacity and the will to act in different ways in response to adversity within their environment. Local knowledge of the climate is something that has been long-standing and is considered to be common to residents of local communities who have lived all their lives or a better part of their lives in the community and have therefore experienced various major climatic events or have listened to stories and other narratives of such events in the past.
This revelation is in sync with recent preliminary findings from the World Meteorological Organisation that Director-general that this current decade has been the warmest
. A comparison of the meteorological data with smallholder farmers’ perception of rainfall changes indicates internal consistency. Nearly all farmers (94 percent) reported declining rainfall with about 57 percent of the farmers reporting that the changes are reflected in terms of distribution and amount of rainfall within a year. The respondents also indicated that the number of rainy months in a year has reduced with a shortening of the rainy season. These findings, which are consistent with previous studies shows that a new rainfall regime is emerging with a distinct pattern. The new regime is manifested in late start of rainfall and a concomitant short rainfall season compared to three decades ago. The results of earlier studies noted the negative effects of environmental changes, especially unreliable rainfall on agricultural production in Ghana
| [15] | Teye, Joseph, Kofi, Bawakyillenuo, Simon, & Yaro, et al. (2015). Local farmers' experiences and perceptions of climate change in the northern savannah zone of ghana. International Journal of Climate Change Strategies and Management, 7(3), 327-347.
https://xueshu.baidu.com/ndscholar/browse/detail?paperid=1q2j0000620w0tu0cw750et0vy133683 |
| [35] | Yaro JA. Building resilience and reducing vulnerability to climate change : implications for food security in Ghana. 2013. |
| [36] | Apwah F. PATTERNS, PERCEPTIONS AND MANAGEMENT OF CEREBRO-SPINAL MENINGITIS IN THE KASSENA-NANKANA EAST AND WEST DISTRICTS [Internet]. 2013. Available from: http://ugspace.ug.edu.gh |
[15, 35, 36]
. The main forms of environmental change identified by farmers was delays in the onset of rains, declining rainfall, fluctuations in the amount of rainfall and increased temperatures which sometimes lead to crop failure and post-harvest loses. Crop failure associated with climate change has also negatively affected food security.
Smallholder farm households have been emphatic that their major livelihood significantly depends on the natural environment. However, extreme variation in precipitation and temperature rendered the agricultural value chain, which hitherto was synonymous to a gold mine that never dried, a subject matter that those of them who are lucky to survive will recount to their new generations with great pain. Periods of good precipitation across the entire Ghana often reflected in bumper crop harvests, relatively lower food inflation and a significant positive net contribution of the agriculture value chain to the Gross Domestic Product of the economy. Relative reduction in the level of absolute poverty accompanied by enhanced food security is also experienced in such times
| [37] | Quaye W. Food security situation in northern Ghana, coping strategies and related constraints. Afr J Agric Res. 2008; 3(5): 334–42. |
| [38] | Yaro JA. Theorizing food insecurity: building a livelihood vulnerability framework for researching food insecurity. Nor Geogr Tidsskr. 2004; 58(1): 23–37.
https://doi.org/10.1080/00291950410004375 |
| [39] | Hesselberg J. Becoming poor in Ghana. Ghana Journal of Geography Vol. 2015; 7(1): 97–108. |
[37-39]
.
The 2007 flood followed by two successive years of declining rainfall and subsequently recovered in 2010. In 2011 and 2018, severe thunderstorms followed by a torrential rainfall and flooding inundated residents of the Kasena Nankana Municipality resulting in widespread destruction of dwelling places and small holder farms.
The changing cycles of droughts and floods, especially when they occur within the same year, and the related losses have negative consequences on agrarian livelihood options for smallholder farm households
| [40] | Brida AB, Owiyo T, Sokona Y. Loss and damage from the double blow of flood and drought in Mozambique. International Journal of Global Warming. 2013; 5(4): 514–31.
https://doi.org/10.1504/Ijgw.2013.057291 |
| [41] | Benjaminsen TA, Cousins B, Thompson L. Contested resources. Challenges to the governance of natural resources in Southern Africa. 2002. 1–111 p. |
[40, 41]
. The damning impacts of floods and agricultural droughts combined with a general economic malaise fueled by long-term impacts of corruption and misgovernance continues to sink many West African countries
| [10] | Cooke E, Hague S, McKay A. The Ghana Poverty and Inequality Report: Using the 6th Ghana Living Standards Survey 2016. 2016. |
| [42] | Ghana Statistical Service. Ghana Poverty Map Report. 2015. |
[10, 42]
, particularly Ghana. This situation in Ghana and by extension to the Kasena Nankana area especially, exists the potent cocktail of agricultural droughts and perennial floods which have curtailed smallhouseholds’ ability to move out of the poverty trap. This also has had the tendency of pushing especially youthful male members of smallholder households to migrate out of their poverty ridden communities into urban centres of Ghana. This reinforces the spate of urbanization with its attendant myriad problems while stagnating the rural economy of the country.
The finding that climate variability and change manifested in poor crop yields, low income and serious challenges in connection with households’ access and control over water rights further strengthens the nexus of extreme variation in the climate over the long-term and socio-economic development. It is logical that the droughts and near-droughts of 1983, 1988, 1990, 1993, 1995, 1998, 2005 and 2014 triggered agricultural drought have caused an all-time significant havoc on the agricultural value chain in the Kasena Nankana area.
Temperature variability across time and space manifested in the communities in the form of a general increase with community-specific differences. The results suggest a marginal spatial variation in perception of temperature change consistent with several studies on temperature changes among localities including
who found that perception of temperature changes slightly varied from one study community to another. In the current study, communities which are close to major water bodies, respondents’ views of increased temperature varied and this underscored how local dams may have positively influenced the growth of vegetation and by extension the micro-climate at the community level. For instance, Bonia lies adjacent to the Tono Irrigation Dam which may mediate the impact of temperature at the local level.
The underlying explanation for the views of the respondents is that while vulnerability to climatic variability is not the same in the study communities, some smallholder farm households were found to be more vulnerable in view of the types of crops that they cultivated and the terrain within which the crops are cultivated. Those who cultivated early millet and the traditional guinea corn (yarah) were more vulnerable to rain storms and agricultural droughts as compared to farmers who cultivated groundnuts and soybean. Similarly, groundnut crops were found to be more sensitive to drought as compared to the traditional late millet which is noted to have adapted to semi-arid regions. As a result, smallholder farm households who have utilized this knowledge in planning which crop to cultivate and at which time were successful in reducing their level of vulnerability to climatic variability. This finding is in tandem with
. In addition, they noted that differences in water availability for agricultural activities underscores the different views about climate change
. This study contrasts this reportage by highlighting the convergence between observed meteorological data and local community and smallholder farm households’ views of a reducing trend of annual precipitation against an increasing trend of average mean temperature over three decades. This finding rather corroborated
| [43] | Asif M. Climatic Change, Irrigation Water Crisis and Food Security in Pakistan Climatic Change, Irrigation Water Crisis and Food Security in Pakistan Climatic Change, Irrigation Water Crisis and Food Security in Pakistan Muhammad Asif Supervisor : Roger Herber. 2013. |
| [44] | FAO. The State of the World’s Land and Water Resources for Food and Agriculture. Managing Systems at Risk [Internet]. 2011. Available from:
https://openknowledge.fao.org/server/api/core/bitstreams/0dda22d4-41fa-4c16-9090-55ade8cadf66/content |
| [45] | FAO. Climate Change and Food Security: Risks and Responses [Internet]. 2016. Available from: http://www.fao.org/ |
| [46] | Yiran G, Stringer L, Attua E, Evans A, Challinor A, Gyasi E. Spatial mapping of vulnerability to multi-hazards in the savanna ecosystem in Ghana [Internet]. 2015. Available from: http://www.see.leeds.ac.uk/sri |
[43-46]
and who discovered a similar convergence in Pakistan and in Ghana respectively.
A tale as it may seem but the narratives of focus group discussants underscored the long-standing presence and challenges associated with flooding and drought. These climate extremes have not only been a common feature of the climate of the study villages but presented many difficulties to farmers over time due to their devastative tendencies and the difficulty in dealing or adapting to them
. According to the respondents, among the two climate extremes, agricultural drought has been the most common and has very devastating impacts. This finding constitutes a confirmation of
that droughts have played a major role in most of the climate extremes ever experienced in the northern Savannah agro ecological zone.
Respondents also pointed to the increased drought and flooding risk posed by the single maxima rainfall regime that their communities experience. For example, hardly is any remarkable quantity of rainfall experienced in the Kasena Nankana area in October each year. However, in October 2019, the communities were shocked with a huge torrential rainfall that flooded major rivers and low-lying communities and caused extensive damage to homes, communal burial sites, drinking water sources and farms. Some lives were also lost in the process. Whereas communities in the Kasena Nankana area experience a very short rainfall season and a very prolonged rainy season, it contrasts with the southern part of the country which experiences a double maxima rainfall regime. A double maxima rainfall system allows for a spread of drought and flooding risk across the two seasons as compared to just one maxima rainfall experienced in the northern Savannah where the study was carried out. Farmers attributed the adoption of certain livelihood strategies such as migration to the single rainfall regime overtime.
The effects of Cerebral Spinal Meningitis outbreaks in the study area were multidimensional including physical, social, cultural and economic negative consequences. Small holder farm yields (of cereals) are typically low in the study area and high temperatures are among the causative factors for low yields. Physiologically, high temperatures induce higher rate of growth but the overall growing period becomes shorter. The shortened reproductive stages due to high temperatures limit carbohydrate accumulation resulting in overall yield reduction. High temperatures also lead to high evapo-transpiration rates which induce water stress and yield reduction in cereals. The dry weather situation had in some years worsened the plight of small holder farmers because it created conducive environment for pests such as army worm invasion. These worms have the tendency of consuming everything green on their way.
Naturally, human beings are curious of the causes of different phenomena they encounter. Therefore, attempts are made to search for meaning in order to satisfy their curiosity and to enable them determine how best they could relate to various phenomena. It is thus important to study people’s worldviews on an important phenomenon like climate variability. The causes of climate variability as noted by farmers in the study area are varied and range from human exploitative actions, disregard for culture and religious tendencies as well as natural causes. The expressions of participants during various focus group discussions reflect these causes.





 Share This Article
 Twitter
 Linked In
 Facebook
 Copy
Copy Download