1. Introduction
Agriculture is both affected by climate change and an important contributor to greenhouse gas (GHG) emissions
| [1] | IPCC (Intergovernmental Panel on Climate Change).2014b. Climate Change 2014: Mitigation of Climate Change. Contribution of Working Group III to the Fifth Assessment Report of the Intergovernmental Panel on Climate Change. In Cambridge University Press. |
[1]
. Greenhouse gas (GHG) emissions from agriculture consist of non-CO
2gases, namely methane (CH
4) and nitrous oxide (N
2O), produced by crop and livestock production and management activities
| [1] | IPCC (Intergovernmental Panel on Climate Change).2014b. Climate Change 2014: Mitigation of Climate Change. Contribution of Working Group III to the Fifth Assessment Report of the Intergovernmental Panel on Climate Change. In Cambridge University Press. |
[1]
. Crop and livestock activities within the farm gate accounted for 52% of the total emissions in 2017 and N
2O represents 24% of the total emissions
| [2] | FAO (Food and Agriculture Organization of the United Nations).2020. World Food and Agriculture-Statistical Yearbook 2020. Rome. |
[2]
. World agriculture emissions grew by 16% between 2000 and 2017
| [2] | FAO (Food and Agriculture Organization of the United Nations).2020. World Food and Agriculture-Statistical Yearbook 2020. Rome. |
[2]
. Worldwide, winters and summers alike are becoming increasingly hotter than the 1951-1980 average
| [3] | WMO. (2021). State of the Climate in Africa (Issue 1275). |
[3]
. With nearly 1.7°C more than the reference average for the world, 2016 was the warmest. Africa is one of the regions where the temperature change has been the highest in 2019, with 1.4°C
| [2] | FAO (Food and Agriculture Organization of the United Nations).2020. World Food and Agriculture-Statistical Yearbook 2020. Rome. |
[2]
.
Ethiopia is characterized by a wide variety of landscapes and given its geographic position close to the equator and the Indian Ocean, the country is subjected to large spatial variations in temperature and precipitation
| [4] | CRGE (Climate Resilient Green Economy). 2019. Ethiopia’s Climate Resilient Green Economy Strategy. National Adaptation Plan. Federal Democratic Republic of Ethiopia. National Adaptation Plan., 1-147. |
[4]
. As a result of its varied topography, Ethiopia has a highly variable tropical climate
| [5] | World Bank. 2011. Climate Risk and Adaptation Country Profile Ethiopia COUNTRY OVERVIEW. April, 1-16. |
[5]
. The average rainfall shows a decreasing trend on an annual time scale for the whole of the country. However, the trend varies from region to region and from season to season. There is an increasing trend in temperature and it is projected to be increased in the future
| [6] | EPCC (Ethiopian Panel on Climate Change).2015a. Ethiopian Panel on Climate Change, First Assessment Report, Working Group I Physical Science Basis, Published by the Ethiopian Academy of Sciences. |
[6]
.
Ethiopia’s economy is mainly dependent on the agriculture sector
| [7] | FDRE (Federal Democratic Republic of Ethiopia Ministry of Agriculture and Rural Development) 2010.. Ministry of Agriculture and Rural Development, Ethiopia’s Agricultural Sector Policy and Investment Framework, 2010(June), 2009-2012. |
[7]
. However, the sector is overwhelmingly rainfall-dependent and unable to feed the growing population due to the risks associated with high rainfall variability and the increasing temperatures
. Events like drought and flood as well as periodic occurrence of pests and diseases increase the vulnerability of the country’ economy and the smallholder farmers
| [5] | World Bank. 2011. Climate Risk and Adaptation Country Profile Ethiopia COUNTRY OVERVIEW. April, 1-16. |
| [9] | EPCC (Ethiopian Panel on Climate Change). 2015b. Ethiopian Panel on Climate Change First Assessment Report, Agriculture and Food Security (Working Group II). |
[5, 9]
. Future climate variability will also lead to more frequent extremes of weather in the form of erratic and increasing frequency and intensity of drought and flooding
| [10] | Bekele Shiferaw B., Kindie Tesfaye., Menale Kassie, Tsedeke Abate, T., Prasanna, B. M., and Abebe Menkir. 2014. Managing vulnerability to drought and enhancing livelihood resilience in sub-Saharan Africa: Technological, institutional and policy options. Weather and Climate Extremes, 3, 67-79. https://doi.org/10.1016/j.wace.2014.04.004 |
[10]
.
The Great Rift Valley (GRV) of Ethiopia is a typical example of a region with diverse agro-ecologies over short distances associated with large differences in altitude
| [11] | Jansen, H. C., Harmsen, J., Hengsdijk, H., Dagnachew, L., Tenalem, A., Hellegers, P., and Spliethoff, P. 2007. Land and water resources assessment in the Ethiopian Central Rift Valley. Alterra Wageningen UR, July 2007, 44. |
| [12] | Mezegebu Getnet, Hengsdijk, H., and Ittersum, M. Van. 2014. Disentangling the impacts of climate change, land use change and irrigation on the Central Rift Valley water system of Ethiopia. Agricultural Water Management, 137, 104-115. https://doi.org/10.1016/j.agwat.2014.02.014 |
[11, 12]
. The livelihood strategy for the majority of the population is based on small mixed rainfall farming systems, climate variability and change negatively affect the crop production system and the environment through direct changes in temperature and water availability
| [11] | Jansen, H. C., Harmsen, J., Hengsdijk, H., Dagnachew, L., Tenalem, A., Hellegers, P., and Spliethoff, P. 2007. Land and water resources assessment in the Ethiopian Central Rift Valley. Alterra Wageningen UR, July 2007, 44. |
| [12] | Mezegebu Getnet, Hengsdijk, H., and Ittersum, M. Van. 2014. Disentangling the impacts of climate change, land use change and irrigation on the Central Rift Valley water system of Ethiopia. Agricultural Water Management, 137, 104-115. https://doi.org/10.1016/j.agwat.2014.02.014 |
| [13] | Belay Tseganeh, Asseng, S., Rotter, R. P., and Hengsdijk, H. 2015. Exploring climate change impacts and adaptation options for maize production in the Central Rift Valley of Ethiopia using different climate change scenarios and crop models. https://doi.org/10.1007/s10584-014-1322-x |
[11-13]
. The largest losses are predicted for arid and semi-arid areas like the GRV, which have too few growing days for crop production
| [9] | EPCC (Ethiopian Panel on Climate Change). 2015b. Ethiopian Panel on Climate Change First Assessment Report, Agriculture and Food Security (Working Group II). |
[9]
.
Impacts of climate change vary from region to region and even from location to location
| [14] | Du, Y., Guo, X., Cao, G., and Li, Y. 2016. Increased Nitrous Oxide Emissions Resulting from Nitrogen Addition and Increased Precipitation in an Alpine Meadow Ecosystem. 25(1), 447-451. https://doi.org/10.15244/pjoes/60860 |
[14]
. The analysis and understanding of the variability and future changes in climatic variables, particularly characteristics of rainfall and temperature, at a local level represents an important task in detecting the magnitude of climate change, identifying current and future climate risks, and designing appropriate adaptation and mitigation strategies
| [15] | Kindie Tesfaye, Pramod K. Aggarwal, Fasil Mequanint, Paresh B. Shirsath P., Clare M., Arun K., and Dil B. 2017. Climate Variability and Change in Bihar, India : Challenges and Opportunities for Sustainable Crop Production. Sustainability, 1-22. https://doi.org/10.3390/su9111998 |
| [16] | Helen Teshome, Kindie Tesfaye, Nigussie Dechassa, Tamado Tena and Matthew H. 2022. Analysis of Past and Projected Trends of Rainfall and Temperature Parameters in Eastern and Western Hararghe Zone, Ethiopia. Atmosphere 2022, 13, 67. https://doi.org/10.3390/atmos13010067 |
[15, 16]
. In addition, Adaptation and mitigation strategies are likewise difficult to formulate unless detailed vulnerability and impact assessment studies are undertaken
. Past rainfall was analysed in the GRV
| [18] | Fitih Ademe, Kibebew Kibret, Sheleme Beyene, Mezgebu Getenet. and Gashaw Mitike. 2020. Rainfall analysis for rain-fed Rainfall analysis for rain-fed farming in the Great Rift Valley Basins of Ethiopia. Journal of Water and Climate Change, 812-828. https://doi.org/10.2166/wcc.2019.242 |
[18]
. Past and future climate was analysed in the CRV
| [19] | Belay Tseganeh, Rötter, R. P., Hengsdijk, H., Asseng, S., and Ittersum, M. K. V. A. N. 2014. Climate variability and change in the Central Rift Valley of Ethiopia: challenges for rainfed crop production. 58-74. https://doi.org/10.1017/S0021859612000986 |
[19]
. However, there is a lack of quantitative information and knowledge on the current climate variability and future climate change on the two important climate parameters, rainfall and temperature, in the GRV of Ethiopia. This study, therefore, aimed to understand and analyze current climate variability and future changes and associated risks for sustainable crop production and N
2O emissions reduction based on six GCMs under the new emission scenarios, SSPs, in the GRV of Ethiopia.
2. Methodology
2.1. Description of the Study Area
The study was conducted for the Great Rift Valley (GRV) of Ethiopia. GRV is located approximately between 36
o01’and 42
o6’ E and 3
o40’ and 12
o3’N. It covers about 18, 791, 931 ha (187,919 km
-2). Elevation of the GRV ranges from 760 m above sea level (a.s.l.) to about 2080 m a.s.l (
Figure 1). In the GRV, nine meteorological stations (Adami Tulu, Alemtena, Debre Zeit, Hawassa, Kulumsa, Melkassa, Miesso, Werer, and Ziway) were selected for the historical climate analysis (
Figure 2 and
Table 1). The spatial distribution of rainfall and temperature in the GRV is shown in
Figure 2. The annual weighted average rainfall across the GRV is 781 mm. The mean annual rainfall at the 9 stations ranged from 594 mm (Werer) to 956 mm (Hawassa). The average annual minimum temperature ranges from 10°C (Kulumsa) to 19°C (Werer) among stations with a GRV average of 14 °C. On the other hand, the average annual maximum temperature ranges from 22
°C to 34°C in the same stations and has a mean value of 29°C among stations (
Figure 2).
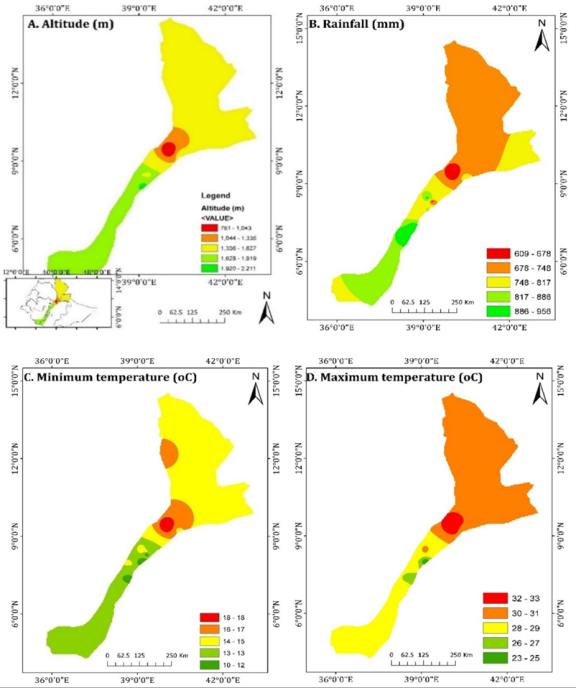
Figure 1. Maps of the GRV of Ethiopia showing altitude (m) (A), annual total rainfall (mm) (B) and annual minimum (C) and maximum (D) temperatures (°C) based on observation data (1987-2017).
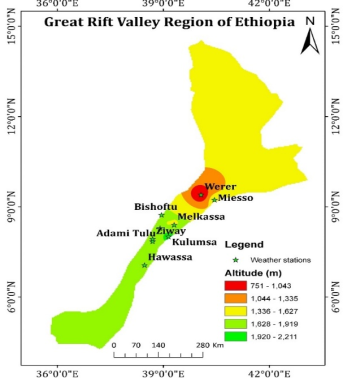
Figure 2. Map of the Great Rift Valley and the weather stations used in the study.
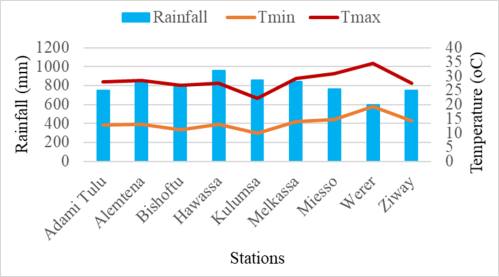
Figure 3. Annual rainfall, minimum temperature (Tmin) and maximum temperature (Tmax) over a period of 30 years (1988-2017) at 10 stations in the GRV of Ethiopia.
Table 1. Average annual rainfall and mean temperature (1988-2017) for representative meteorological stations in the Great Rift Valley of Ethiopia.
Station Name | Latitude | Longitude | Elevation (m.a.s.l) | Rainfall (mm) | Temperature (°C) |
Adami Tulu | 7.85 | 38.7 | 1630 | 751 | 20.5 |
Alemtena | 8.29 | 38.91 | 1656 | 834 | 20.7 |
Bishoftu | 8.73 | 38.95 | 1900 | 738 | 18.9 |
Hawassa | 7.06 | 38.47 | 1694 | 956 | 20.3 |
Kulumsa | 8.01 | 39.15 | 2211 | 858 | 16.0 |
Melkassa | 8.4 | 39.31 | 1540 | 846 | 21.6 |
Miesso | 9.2 | 41.11 | 1470 | 764 | 22.9 |
Werer | 9.4 | 40.07 | 750 | 594 | 26.8 |
Ziway | 7.93 | 38.7 | 1640 | 749 | 20.9 |
2.2. Data Sources
Historical 30 years (1988-2017) daily rainfall, maximum temperature and minimum temperature data for the 10 stations were obtained from the Ethiopian National Meteorological Institute (NMI). The daily historical data were checked for missing values and erroneous records before analysis. Future daily rainfall, maximum and minimum temperature data for two future 30 years, centered at 2040 (2020-2049) and 2060 (2050-2079), were obtained from NASA Earth Exchange Global Daily Downscaled Projections (NEX-GDDP-CMIP6) (https://nccs.nasa.gov). Six General GCMs were used for 5 sites in the GRV. The 6 GCMs were selected based on availability of data for two (245 and 585) socio economic pathways (SSPs) used in this study (
Table 2).
Table 2. Description of GCMs used having all the precipitation and temperature data.
Model name | Institution name | Resolution (lon. by lat.) |
ACCESS-CM2 | Common wealth Scientific and Industrial Research Organization (CSIRO) and Bureau of Meteorology (BOM), Australia | 1.9o X 1.3o |
ACCESS-ESMi-5 | Common wealth Scientific and Industrial Research Organization (CSIRO) and Bureau of Meteorology (BOM), Australia | 1.9o X 1.2o |
MIROC6 | Japan Agency for Marine-Earth Science and Technology, Kanagawa 236-0001, Japan | 1.4o X 1.4o |
MPI-ESMI-2-HR | Max Planck Institute for Meteorology, Hamburg 20146, Germany | 0.9o X 0.9o |
MPI-ESMI-2-LR | Max Planck Institute for Meteorology, Hamburg 20146, Germany | 1.9o X 1.9o |
MRI-ESM2-0 | Meteorological Research Institute | 1.1o X 1.1o |
2.3. Data Quality Control
2.3.1. Outlier Detection
The Tukey fence was used to screen the outliers greater than a threshold value that can affect the detection of inhomogeneity. The range is corresponding to
(1)
Where Q1 and Q3 are, the lower and upper quartile points, respectively and IQR is the interquartile range. 1.5 is the constant value and the outliers are set to the limit value corresponding to +1.5 X IQR.
2.3.2. Homogeneity Test
A cumulative deviation test was used to detect inhomogeneity in meteorological time series. Tests for homogeneity can be based on the adjusted partial sums or cumulative deviations from the mean and it is given as
(2)
The partial sum of the given series ( will fluctuate around zero if there is no systematic deviation of the Yi values with respect to their mean. The value of it could be positive or negative if a break is present near the year k. the rescaled adjusted partial sum is obtained by dividing the difference between the maximum and the minimum of the values by the sample standard deviation σ given as
(3)
The critical value , for n=30 a value of 1.5 and 1.4 for 5% and 10% probability level, respectively.
2.4. Data Analysis
To fill missing value following the Markov chain model and summarize daily temperature and rainfall data into month, seasonal and annual using INSTAT software version 3.37 were used.
2.4.1. Trend Analysis
The climate data from all stations were subjected to an auto-correlation test for the purpose of deciding appropriate trend analysis methods. The non-parametric Mann-Kendall (MK) test along with Sen’s slope estimator were used to examine rainfall and temperature trends and their magnitudes, respectively.
Mann-Kendall Trend Test: it is a non-parametric approach which uses sensitive to outliers and test for a trend of climatic elements without specifying whether the trend is linear or non-linear. The trend in temperature and rainfall data was done by this test. MK’s test is given as:
(4)
The sign function is given as
3.
Where S is the MK’s test statistics; Xi and Xj are the sequential data values of the time series in the years i and j (j>i) and N is the length of the time series. A positive S value indicates an increasing trend and a negative value indicates a decreasing trend in the data series. The variance of S, for the situation where there may be ties (equal values) in the X values, is given by
(5)
Where m is the number of tied groups in the data set and ti is the number of data points in the ithtied group. For n larger than 10, Zs approximates the standard normal distribution and computed as
(6)
The presence of a statistically significant trend will be evaluated using the Zs value. In a two-sided test for trend, the null hypothesis Ho should be accepted if [Z] < Z1-σ/2 at a given level of significance. Z1-σ/2 is the critical value of Zs from the standard normal table. For 5% significance level (for example), the value of Z1-σ/2 is 1.96.
Sen’s slope estimator test: this is also non parametric test by which true slope of a trend is estimated. The slope of ‘n’ pairs of data estimated by using the formula:
Where is Sen’s slope estimator, xj and Xi data value at time j and i, (j>i), respectively. The ‘n’ values of are ranked from the smallest to largest and the median of ‘n’ values of is Sen’s slope which is given as:
(8)
A negative value represents a decreasing trend; a positive value represents an increasing trend over time.
2.4.2. Variability Analysis
The Coefficient of Variation (CV%): it is used to evaluate the variability of rainfall data relative to its standard deviation and is presented as a percentage.
Where CV is the coefficient of variation; σ is the standard deviation and µ is long term mean rainfall. A CV values <20, 20-30, and >30 represents less variable, moderately variable and highly variable rainfall, respectively.
Precipitation Concentration Index (PCI): it is used to describe the monthly rainfall distribution. Precintcon package in R software used to calculate the PCI values. PCI values of less than 10 indicate the uniform monthly distribution of rainfall, between 11-20 indicate high concentration and above 21 indicate very high concentration.
2.4.3. Rainfall Onset, Cessation and Length of Growing Season
The start of the rainy season can be defined as the first occurrence of at least ‘x’ mm rainfall totaled over ‘t’ consecutive days. This potential start can be a false start if an event, F, occurs afterwards, where F is defined as a dry-spell of ‘n’ or more days in the next ‘m’ days. Accordingly, the earliest start of the growing season as the first occasion when the rainfall accumulated within a three days period is 20 mm or more. The risk of crop failure of early planting was assessed by adding a caveat, i.e., the potential starting date of the growing season was not followed by a dry spell of ten or more days in the first 30 days after planting. The end of the growing season is mainly dictated by stored soil water and its availability to the crop after the rainfall stops. The end of the season is on the first date on which soil water is depleted and reaches zero.
In this study, rainfall onset and cessation and length of growing period were determined for the kiremt season. The onset of the rains in the season was defined in this study as the first occasion after 1 June when the rainfall that accumulated in 3 consecutive days was at least 20 mm, with no dry spells of more than 10 days in the next 30 days. The cessation of the rains was taken as the date after 15 September following which no rain occurs over a period of 20 days and when the soil water balance reaches zero. The length of the growing season was calculated as the difference between rainfall onset and cessation dates.
2.4.4. Annual and Seasonal Analysis
Analysis of rainfall, maximum and minimum temperatures were carried out on annual, seasonal and monthly timescales for the baseline (1988-2017), 2040 and 2060 periods. The two seasons considered in the study were main rainy season, kiremt (June - September) and short rainy season, Belg (March - May). Descriptive statistics were used to derive annual, seasonal and monthly summaries from the daily data, and relative changes were calculated to compare changes between the baseline and projected climates.
3. Results and Discussion
3.1. Trend of Annual Total Rainfall
The trend of the total rainfall over a period of 30 years across the 9 stations is presented in
Figure 4. The result generally indicates a positive trend across all stations and seasons except at Kulumsa and Werer. The annual total rainfall shows an increasing trend across stations except at Debre Zeit, Kulumsa and Werer and significant positive trends are observed only at Melkassa. For JJAS season, a positive trend is observed in all stations except at Kulumsa. On the other hand, the MAM season show a negative trend at Adamitulu, Kobo, Kulumsa, Miesso and Werer whereas the trend is significant only at Werer.
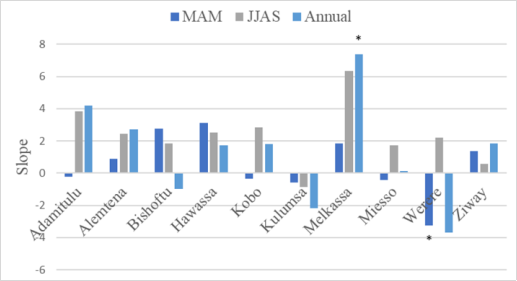
Figure 4. Trend of total annual rainfall amount over a period of 30 years (1988-2017) at 9 stations in the GRV, Ethiopia. *, **, *** shown on bar graphs represent significant trends at α = 0.5, 0.1 and 0.01 levels.
3.2. Trend of Annual Mean Maximum and Minimum Temperatures
The trend of the total maximum and minimum temperatures over a period of 30 years across 9 stations presented in
Figure 5. The result generally indicates a positive trend in Tmax across all stations except at Kobo for MAM season. Analysis of the trend of Tmax indicates that it is significantly increasing at all stations in at least in one season in all seasons except Debre Zeit (
Figure 5a). The rate of increasing in MAM season is greater than the JJAS season. Among stations, Adamitulu and Kulumsa experienced the highest rate of Tmax increase in the annual and MAM season, while Hawassa and Miesso had the highest rate of increase in the JJAS season. The result generally indicates a positive trend in Tmin across all stations except at Adamitulu and Kulumsa for the annual and MAM season. Analysis of the trend of Tmin indicates that it is significantly increasing at Alemtena, Hawassa, Melkassa, Miesso and Ziway in at least in one season (
Figure 5b).
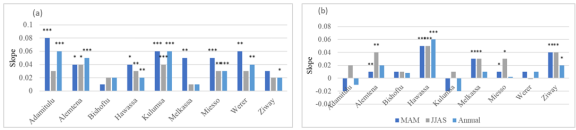
Figure 5. Trends of: (a) mean annual maximum; and (b) mean annual minimum temperatures, over a period of 31 years (1988-2017) at 9 stations in the GRV, Ethiopia.
3.3. Rainfall Variability
The spatial distribution of rainfall in the GRV for the baseline period is shown in
Figure 6. The average rainfall ranges from 339 mm and 167 mm (Werer) to 581 mm (Melkassa) and 310 mm (Hawassa) and has a mean value of 470 mm and 206 mm for the main cropping season, Kiremt (JJAS) and the short rainy season, Belg (MAM) seasons, respectively (
Figure 6a). The average variation in annual rainfall (CV%) ranges from 14% (Alemtena) to 33% (Kobo) and has a mean value of 19% among the stations in the GRV. The average CV ranges from 17% (Alemtena) and 26% (Kulumsa) to 29% and 91% (Kobo) and has a mean value of 24% and 48% for the JJAS and MAM seasons, respectively (
Figure 6b). The PCI value ranges from 12% (Hawassa) to 20% (Kobo) and has a mean value of 18 across the stations and which highlights the seasonality in rainfall distribution (
Figure 7).
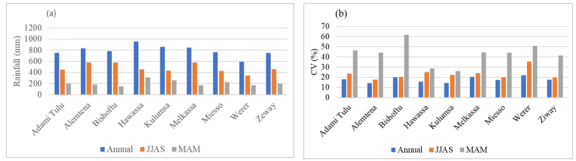
Figure 6. Shows: (a) total annual and seasonal rainfall (mm); and (b) coefficient of variation (CV), over a period of 30 years (1988-2017) at 10 stations in the GRV of Ethiopia.
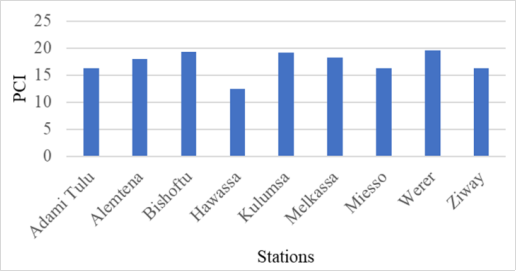
Figure 7. Precipitation concentration index (PCI) of the baseline at 10 stations in the GRV.
3.4. Future Climate Scenarios
3.4.1. Projected Changes in Annual and Seasonal Rainfall Amounts
A comparison of baseline and future climate periods under both SSPs indicate an increase in rainfall amount at five sites of the GRV. Projected total rainfall in the 2060 is higher than the rainfall in the 2040 and the baseline. The MAM, JJAS and annual rainfall in the baseline period is 183, 574 and 834 mm at Alemtena, 311, 455 and 956 mm at Hawassa, 187, 601 and 883 mm at Melkassa, 230, 425 and 764 mm at Miesso, and 197, 455 and 749 mm at Ziway, respectively. The projected total MAM, JJAS and annual rainfall would be 233, 636 and 972 mm at Alemtena, 400, 545 and 1244 mm at Hawassa, 237, 649 and 993 mm at Melkassa, 382, 410 and 890 mm at Miesso, and 280, 796 and 1287 mm at Ziway in 2040 and 198, 757 and 1070 mm at Alemtena, 443, 713 and 1587 mm at Hawassa, 197,746 and 1071 mm at Melkassa, 361,622 and 1143 mm at Miesso, and 280, 796 and 1287 mm at Ziway in 2060, respectively (
Figure 8).
A comparison of the two SSPs, projected total rainfall under SSP585 is higher than the SSP245 at all sites in the GRV (
Figure 9). The projected total MAM, JJAS and annual rainfall would be 209, 657 and 965 mm at Alemtena, 394, 616 and 1327 mm at Hawassa, 209, 662 and 980 mm at Melkassa, 341,511 and 922 mm at Miesso, and 233, 566 and 931 mm at Ziway under SSP245 and 222, 737 and 1077 mm at Alemtena, 449, 642 and 1504 mm at Hawassa, 225, 733 and 1084 mm at Melkassa, 401,522 and 1111 mm at Miesso, and 304, 772 and 1294 mm at Ziway under SSP585, respectively (
Figure 8a). A projection of rainfall in 2040 and 2060 under the two SSPs indicates an increase in annual and seasonal totals except in the MAM season of the 2060 under both SSPs. The average seasonal total rainfall is projected to increase by 14, 21 and 22% at Alemtena, by 14, 29 and 32% at Hawassa, by 16, 15 and 15% at Melkassa, by 65, 11 (decreased), 17% at Miesso, and by 16, 34, and 34% at Ziway in 2040 under the SSP585 emission scenario in the MAM, JJAS and annual, respectively. The average seasonal total rainfall is also projected to increase by 28, 36 and 36% at Alemtena, by 75, 53 and 82% at Hawassa, by 29, 28 and 25% at Melkassa, by 84, 56, 74% at Miesso, and by 92, 105, and 112% at Ziway in 2060 under the SSP585 emission scenario in the MAM, JJAS and annual, respectively (
Figure 9b). The baseline and projected monthly rainfall show spatial and temporal variability. The monthly rainfall distribution is presented for the 2040 and 2060 climate periods under the SSP585 emission scenario at 5 sites (
Figure 10).
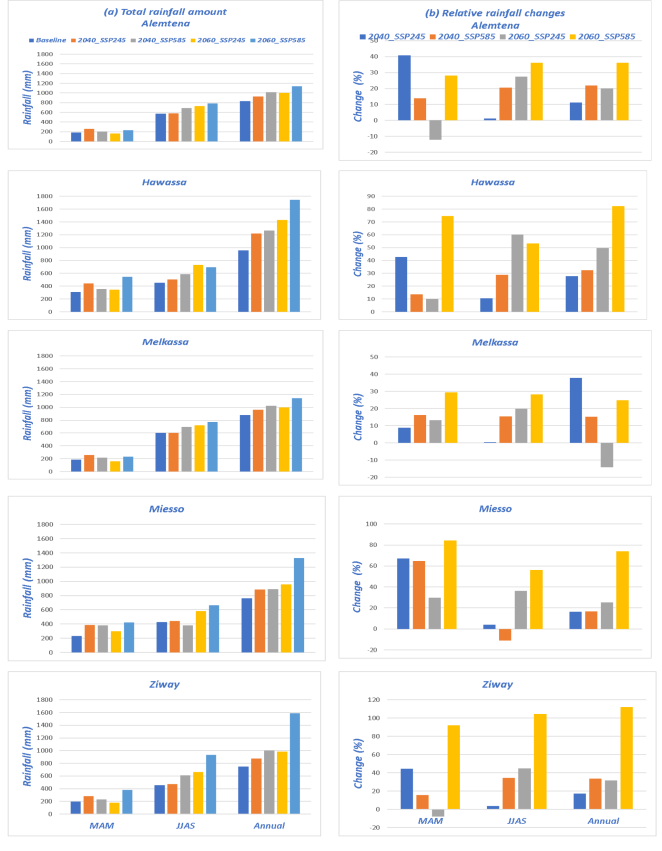
Figure 8. Annual and seasonal rainfall: (a) amount (mm) in the baseline and the climate periods; (b) change relative to the baseline in 2040 and 2060 under two SSPs at 5 stations in the GRV of Ethiopia.
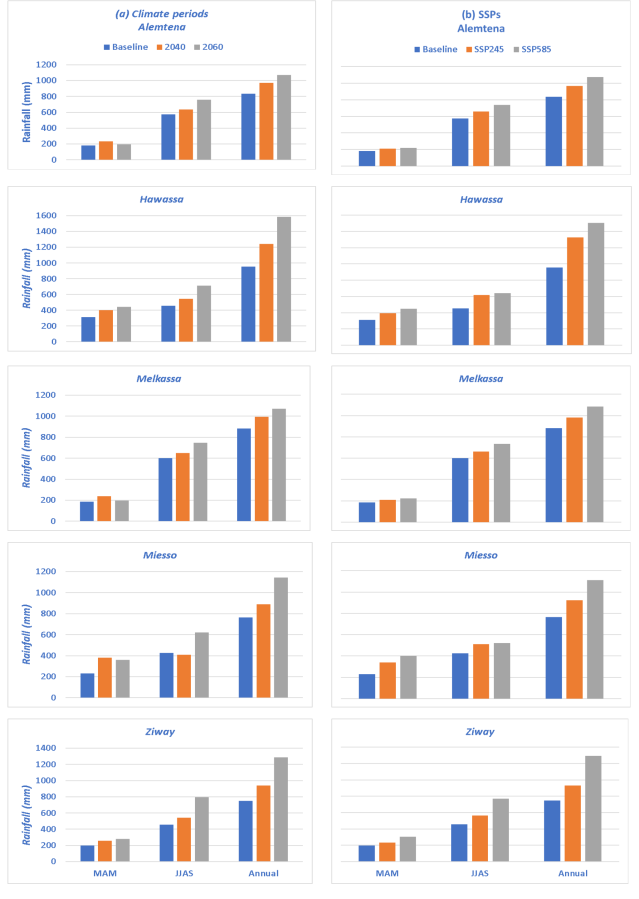
Figure 9. Total MAM, JJAS and annual rainfall amount:(a) in the 2040 and 2060 climate periods; (b) under the SSP245 and SSP585 at 5 stations in the GRV of Ethiopia.
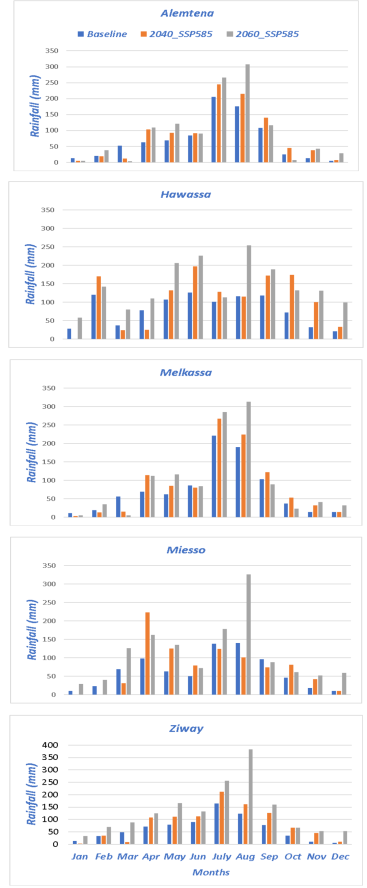
Figure 10. Rainfall amount per month in the baseline, 2040 and 2060 climate periods under SSP585 emission scenario at 5 stations in the GRV of Ethiopia.
3.4.2. Changes in Rainfall Onset and Cessation and Length of Growing Period
Analysis of rainfall onset in the kiremt (JJAS) season across sites indicates that planting can start as early as beginning of June (Hawassa and Ziway) and as late as fourth week of June (Miesso and Melkassa), that is, from day of year (DOY) 167-182 in the baseline period (
Figure 10). There is a tendency for early onset at all stations (a maximum of 10 days at Miesso) under the future climate. The end of the rainy season is projected to be extended under the future climate although. The median cessation dates could range from DOY 266 (mid-September) at Ziway to 279 (beginning of October) at Melkassa in the baseline climate, extending the end of the season by 9 days at Alemtena and Melkassa, by 27 days at Miesso, by 43 days at Ziway, and by 51 days at Hawassa. Thus, the late end of the JJAS season under the future climate prolongs the median growing period by 12 days at Alemtena and Melkassa, by 35 days at Miesso, by 49 days at Ziway, and by 54 days at Hawassa (
Figure 11).
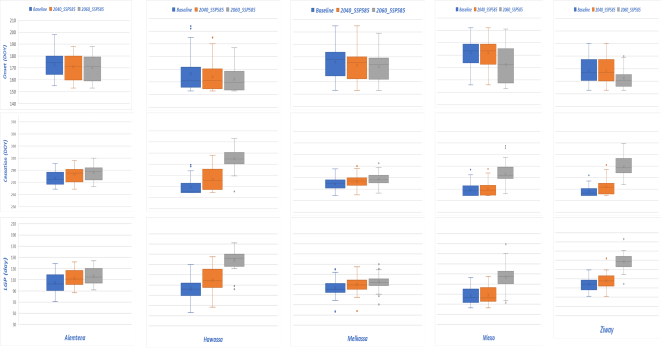
Figure 11. Rainfall onset, cessation and length of growing period (LGP) in the baseline, 2040 and 2060 under SSP585 at 5 sites in the GRV of Ethiopia.
3.4.3. Projected Annual and Seasonal Temperature Changes
A comparison of baseline and future climate periods indicate an increase in both projected maximum and minimum temperatures at all sites. The increase is generally higher in 2060 than 2040 and under SSP585 than under SSP245 emission scenario (
Figure 12). Depending on future climate periods, the MAM, JJAS and annual maximum temperature is projected to increase by 0.06, 0.12 and 0.09°C at Alemtena, 0.15, 0.17 and 0.14°C at Hawassa, by 0.09, 0.05 and 0.12°C at Melkassa, 0.01, 0.06 and 0.04°C at Miesso and by 0.07, 0.12 and 0.09°C at Ziway in 2040 under both SSPs, respectively. The MAM, JJAS and annual maximum temperature is also projected to increase by 0.17, 0.18 and 0.16°C at Alemtena, 0.19, 0.17 and 0.16°C at Hawassa, by 0.16, 0.17 and 0.18°C at Melkassa, 0.12, 0.17 and 0.15°C at Miesso and by 0.18, 0.17 and 0.16°C at Ziway in 2060 under both SSPs, respectively. Depending on the emission scenarios, the increase in maximum temperature under the SSP585 is higher than the SSP245. The MAM, JJAS and annual maximum temperature is projected to increase by 0.10, 0.11 and 0.10°C at Alemtena, 0.15, 0.15 and 0.13°C at Hawassa, by 0.10, 0.09 and 0.11°C at Melkassa, 0.03, 0.09 and 0.07°C at Miesso and by 0.10, 0.11 and 0.09°C at Ziway under the SSP245 emission scenario, respectively (
Figure 12a).
Depending on climate periods, the MAM, JJAS and annual minimum temperature is projected to increase by 0.10, 0.10 ande 0.12°C at Alemtena, 0.12, 0.12 and 0.12°C at Hawassa, by 0.13, 0.11 and 0.11°C at Melkassa, 0.07, 0.11 and 0.12°C at Miesso and by 0.11, 0.10 and 0.12°C at Ziway in2040 under both SSPs, respectively. The MAM, JJAS and annual minimum temperature is also projected to increase by 0.21, 0.18 and 0.20°C at Alemtena, 0.23, 0.19 and 0.21°C at Hawassa, by 0.20, 0.20 and 0.16°C at Melkassa, 0.16, 0.19 and 0.19°C at Miesso and by 0.20, 0.18 and 0.20°C at Ziway in 2060 under both SSPs, respectively. Depending on the emission scenarios, the MAM, JJAS and annual maximum temperature is projected to increase by 0.22, 0.17 and 0.0°C at Alemtena, 0.23, 0.19 and 0.21°C at Hawassa, by 0.22, 0.23 and 0.17°C at Melkassa, 0.18, 0.19 and 0.20°C at Miesso and by 0.21, 0.17 and 0.20°C at Ziway under the SSP585 emission scenario, respectively (
Figure 12b).
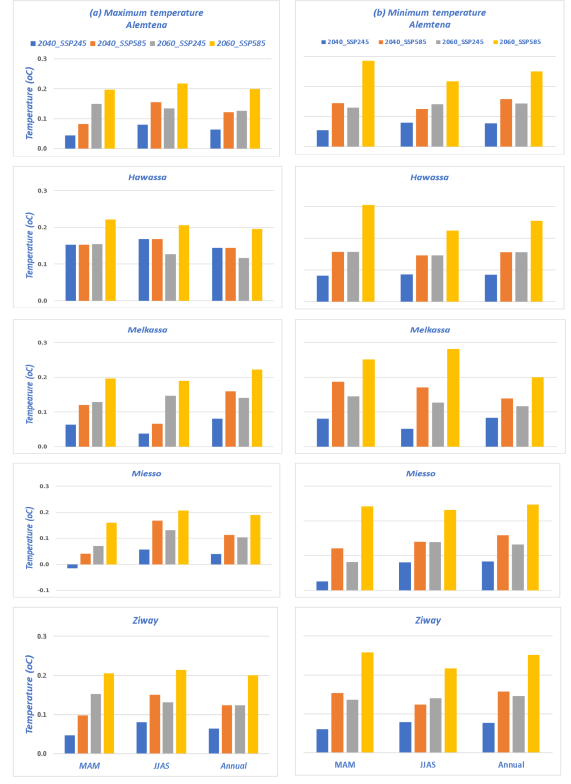
Figure 12. Annual and seasonal changes in: (a) maximum temperature; and (b) minimum temperature in 2040 and 2060 under the two SSPs at 5 stations in the GRV.
3.5. Model Uncertainty in Rainfall and Temperature Projections
Model uncertainty in rainfall and temperature projections is shown by the standard deviations of the 6 GCMs in
Figures 13 and 14. The uncertainty varies between emission scenarios, climate periods and stations. Comparison of the study periods indicate that rainfall projections in 2060 are more uncertain than those in 2040 (
Figure 13a). The uncertainty is generally higher for SSP585 than SSP242 (
Figure 13b). Among stations, uncertainty is higher at Hawassa and Miesso as compared to the rest of the stations (
Figure 14). Unlike rainfall, model uncertainty in the projection of maximum and minimum temperatures lower than that observed for rainfall and is similar in both periods and emission scenarios (
Figure 13). Model uncertainty in the temperatures is slightly higher at Melkassa and Miesso stations compared to the rest of the stations (
Figure 14).
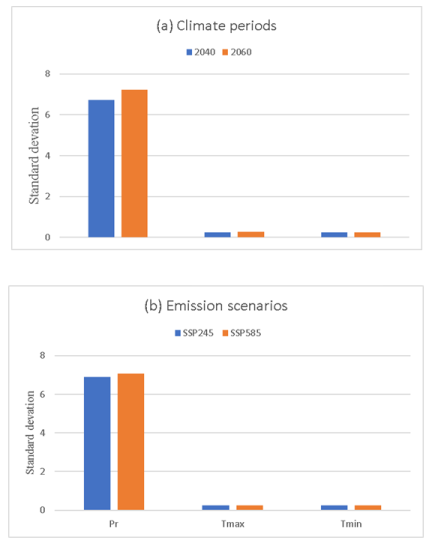
Figure 13. Model uncertainty in rainfall and temperature projections between (a) climate periods and (b) emission scenarios.
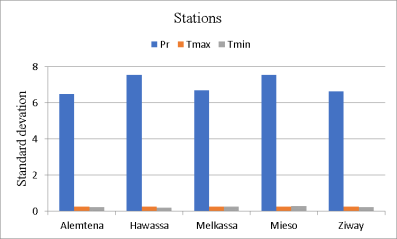
Figure 14. Model uncertainty in rainfall and temperature projections among the 5 stations.
Author Contributions
Theodrose Sisay: Conceptualization, Data curation, Formal Analysis, Methodology, Software, Visualization, Writing – original draft, Writing – review & editing
Kindie Tesfaye: Conceptualization, Formal Analysis, Investigation, Methodology, Supervision, Validation, Visualization, Writing – review & editing
Mezegebu Getnet: Conceptualization, Formal Analysis, Investigation, Methodology, Supervision, Validation, Visualization, Writing – review & editing
Nigussie Dechassa: Conceptualization, Data curation, Formal Analysis, Investigation, Methodology, Supervision, Validation, Visualization, Writing – review & editing
Mengistu Ketema: Conceptualization, Formal Analysis, Investigation, Methodology, Supervision, Validation, Visualization, Writing – review & editing