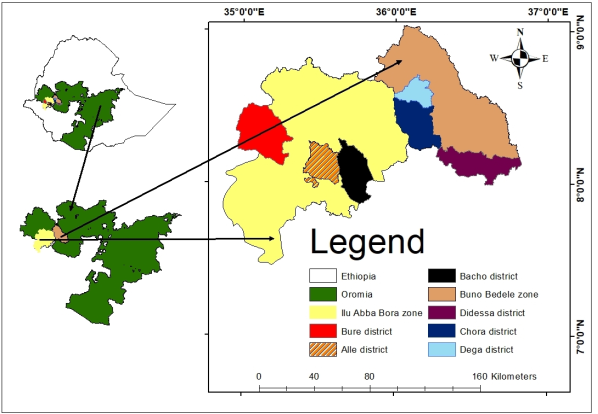
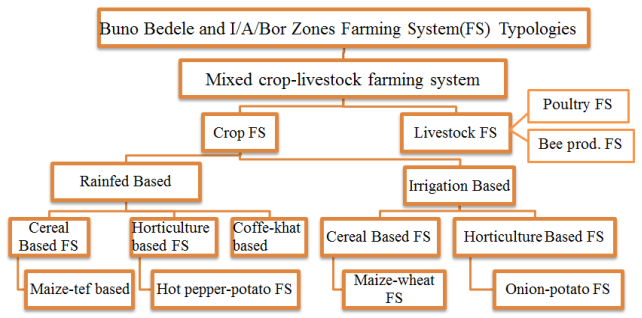
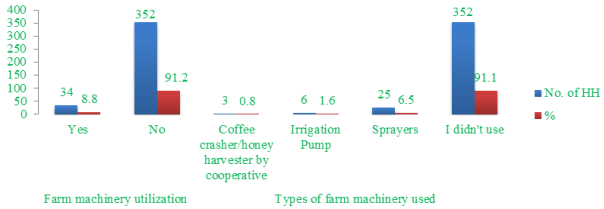
Farming system characterization and analysis is a roadmap for dynamic agricultural production constraints and opportunities identification and prioritization. Hence, this activity was initiated to identify and characterize the existing farming system, its constraints and opportunities in Buno Bedele and Ilu Ababor zones. A cross sectional research design with two-stage sampling was employed. Quantitative and qualitative data were collected from primary and secondary sources. A total of 386 household heads were selected for quantitative data whereas qualitative data were collected from focus group discussion and key informants via face to face interviews. Secondary data were collected from relevant published and unpublished documents. In SPSS version 20 software, simple descriptive statistics like mean, standard deviation, percentage and pair-wise ranking were used for data analysis. The result revealed that, there was a diverse crop-livestock mixed farming system where crop farming system was the dominant and characterized as rain fed and irrigation-based farming system. Cereal, horticulture, and coffee-khat-based farming systems were common in rain fed whereas few cereal and horticultural crops under irrigation farming systems were practiced in the study areas. The types of livestock reared in the areas were cattle, poultry, sheep, goats, and equines. Even though, there were numerous development supporting government and non-governmental organizations including research centers, universities, agricultural offices, climate action through landscape management (CALM) program for results project, sustainable land management (SLM) project, more young entrepreneurs in silk honey (MOYESH) project and private sectors that are contributing in crop and livestock improvement, natural resource management and job creation; high price of agricultural inputs, lack of improved seed and breeds, delay of fertilizers supply, low production and productivity, lack of capital, shortage of land, crop and livestock diseases, feed shortage, poor soil fertility, soil erosion and lack of common understanding on lime application were the major agricultural production constraints in the study areas. Therefore, all government and non-government development practitioners in the areas should consider the existing agricultural production systems, constraints and opportunities for fruitful interventions.
| Published in | International Journal of Agricultural Economics (Volume 10, Issue 3) |
| DOI | 10.11648/j.ijae.20251003.14 |
| Page(s) | 126-148 |
| Creative Commons |
This is an Open Access article, distributed under the terms of the Creative Commons Attribution 4.0 International License (http://creativecommons.org/licenses/by/4.0/), which permits unrestricted use, distribution and reproduction in any medium or format, provided the original work is properly cited. |
| Copyright |
Copyright © The Author(s), 2025. Published by Science Publishing Group |
Agro-ecologies, Crop, Farming System, Farming Typologies, Mixed Farming
No. | Variables | N | Mean | Std. Deviation |
|---|---|---|---|---|
1 | Age of household heads | 386 | 41 | 12.6 |
2 | Average family size | 386 | 6 | 2.5 |
3 | Education level | 386 | 5 | 3.5 |
4 | Total land holding (ha) | 386 | 2.1 | 1.8 |
5 | Total cultivated land (ha) | 386 | 1.1 | 1.0 |
No | Categorical variables | Category | Frequency | Percent |
|---|---|---|---|---|
1 | Sex | Male | 376 | 97.4 |
Female | 10 | 2.6 | ||
2 | Marital status | Single | 3 | 0.8 |
Married | 381 | 98.7 | ||
Divorced | 1 | 0.3 | ||
Widowed | 1 | 0.3 | ||
4 | Religion | Islam | 237 | 61.4 |
Orthodox | 58 | 15.0 | ||
Protestant | 91 | 23.6 | ||
5 | Participation in off/non-farm activities | Yes | 88 | 22.8 |
No | 298 | 77.2 |
Farming system typology | Major Crop produced | N | Area (ha) | Agro-ecology | |||||
|---|---|---|---|---|---|---|---|---|---|
Highland (N=141) | Midland (N=160) | Lowland (N=85) | |||||||
Area (ha) | Yield (Qt/ha) | Area (ha) | Yield (Qt/ha) | Area (ha) | Yield( Qt/ha) | ||||
Cereal based farming | Maize | 386 | 0.55 | 0.53 | 17.1 | 0.56 | 19.1 | 0.54 | 21.87 |
Tef | 386 | 0.35 | 0.55 | 6.79 | 0.30 | 6.52 | 0.10 | 3.88 | |
Sorghum | 386 | 0.03 | - | - | - | - | 0.10 | - | |
Horticure based farming | Hot pepper | 386 | 0.10 | - | - | 0.03 | 10.04 | 0.12 | 19.04 |
Potato | 386 | 0.01 | 0.02 | 18.25 | 0.004 | 8.00 | - | - | |
Coffe-khat based farming | Coffee | 386 | 0.69 | 0.5 | 7.23 | 0.80 | 8.79 | 0.94 | 12.20 |
Khat | 386 | 0.10 | 0.03 | - | 0.02 | - | 0.1 | - | |
Farming system typology | Major Crops grown | N | Area (ha) | Agro-ecology | |||||
|---|---|---|---|---|---|---|---|---|---|
Highland | Midland | Lowland | |||||||
N | Area (ha) | N | Area (ha) | N | Area (ha) | ||||
Cereal based farming | Maize | 386 | 0.03 | 141 | 0.05 | 160 | 0.04 | 85 | 0.001 |
Wheat | 386 | 0.02 | 141 | 0.03 | 160 | 0.02 | 85 | 0.004 | |
Horticultural based farming | Onion | 386 | 0.002 | 141 | 0.002 | 160 | 0.002 | 85 | 0.003 |
Potato | 386 | 0.004 | 141 | 0.01 | 160 | 0.002 | 85 | 0.001 | |
Types of cropping system | Total HHs | HHs (%) | Agroecology | |||||
|---|---|---|---|---|---|---|---|---|
Highland | Midland (N) | Lowland | ||||||
N | % | N | % | N | % | |||
Mono-cropping | 152 | 39.4 | 50 | 35.5 | 69 | 43.1 | 33 | 38.8 |
Crop rotations | 117 | 30.3 | 39 | 27.7 | 49 | 30.6 | 29 | 34.1 |
Double cropping | 90 | 23.3 | 48 | 34.0 | 32 | 20.0 | 10 | 11.8 |
Inter-cropping | 14 | 3.6 | 4 | 2.8 | 5 | 3.1 | 5 | 5.9 |
Coffee and Khat | 13 | 3.4 | 0 | 0.0 | 1 | 0.6 | 12 | 14.1 |
Crop rotation and double cropping | 48 | 12.4 | 29 | 20.6 | 16 | 10.0 | 3 | 3.5 |
Crop rotation and inter-cropping | 12 | 3.1 | 5 | 3.5 | 6 | 3.8 | 1 | 1.2 |
Mono-cropping and double cropping | 30 | 7.8 | 14 | 9.9 | 14 | 8.7 | 2 | 2.4 |
Fallow land | 53 | 13.7 | 29 | 20.6 | 14 | 8.8 | 10 | 11.8 |
Crops | Sowing methods | Seed rate kg ha-1 | Fertilizer rate in kg ha-1 | Plowing frequency | Weed control methods | Weeding frequency | ||
|---|---|---|---|---|---|---|---|---|
NPS/B | Urea | Min. | Max. | |||||
Maize | Row & BC | 24.41 | 85.56 | 81.60 | 2.89 | 4.10 | HW and CH | 2.24 |
Tef | BC & Row | 29.39 | 61.83 | 26.76 | 3.66 | 4.92 | Integrated | 1.80 |
Sorghum | BC | 31.75 | 0 | 0 | 2.75 | 3.76 | CH | 2.20 |
Wheat | BC & Row | 85.26 | 66.06 | 56.58 | 2.95 | 4.39 | Integrated | 2.07 |
Barley | BC | 135.80 | 0 | 3.85 | 2.09 | 3.10 | HW and CH | 1.42 |
Faba bean | BC & Row | 60.50 | 19.87 | 12.75 | 1.67 | 2.68 | HW | 1.48 |
Groundnut | Row & BC | 65.43 | 0 | 0 | 2.88 | 3.86 | HW | 3.57 |
Field pea | BC | 49.33 | 0 | 0 | 0.9 | 1.68 | HW | 0.35 |
Hot pepper | Row and BC | 98.54 | 96.77 | 93.55 | 3.45 | 4.55 | HW | 4.48 |
Crops | Major diseases | Major insects | Major weeds | Farming system | Season |
|---|---|---|---|---|---|
Maize | Common smut, ear rot, gray leaf spot, dry root and turcicum leaf blight | Fall Army worm, weevil and stalk borer | Guzotia scabra (Vis.), Bidens pachyouma, Commelina benghalensis L., and Polygonum nepalense | Cereal based farming | Rain fed |
Tef | Leaf rust and head smudge | Shoot fly | Trifolium pratense, Eleusine indica (L.), Spergula arvensis L., Cyperus esculentus L. and Guzotia scabra (Vis.) | Cereal based farming | |
Wheat | Stem rust, yellow rust and root rot | Shoot fly and weevil | Trifolium pratense, Guzotia scabra (Vis.) and Commelina benghalensis L. | Cereal based farming | Irrigation based |
Hot pepper | Cercospora leaf spot, damping off, fusarium wilt, leaf blight, pod rot, root wilt and late blight | Pepper budworm, and pepper weevil | Ageratum conyzoides L. and Guizotia scarab | Horticulture based farming | Rain fed |
Sorghum | Head smut, leaf blight and anthracnose | Bird attck | Bidens pachyouma, Polygonum nepalense and Guzotia scabra (Vis.) | Cereal based farming | |
Potato | Late blight and bacterial wilt | Potato aphid, grean peach aphid, cutworm, red ants and leaf hopper | Eleusine indica (L.) | Horticuture based farming | Rainfed and irrigation |
Crop production constraints | Agroecology | ||||||||
|---|---|---|---|---|---|---|---|---|---|
Highland | Midland | Lowland | |||||||
N | % | Rank | N | % | Rank | N | % | Rank | |
High improved seed and fertilizer cost | 131 | 93.0 | 3 | 157 | 98.1 | 1 | 80 | 94.1 | 2 |
Shortage of fertilizer and improved seed | 134 | 95.1 | 2 | 146 | 91.2 | 3 | 82 | 96.5 | 1 |
Termite | 39 | 27.7 | 10 | 30 | 18.7 | 11 | 17 | 20.0 | 11 |
Disease | 43 | 30.5 | 9 | 69 | 43.2 | 9 | 42 | 49.4 | 8 |
Insects | 82 | 58.1 | 8 | 104 | 65 | 6 | 38 | 44.7 | 9 |
Poor soil fertility | 127 | 90.1 | 4 | 131 | 81.9 | 5 | 74 | 87.1 | 4 |
Weed infestation | 27 | 19.1 | 11 | 39 | 24.4 | 10 | 18 | 21.2 | 10 |
Shortage of land | 104 | 73.8 | 7 | 99 | 61.9 | 7 | 53 | 62.3 | 7 |
Lack of capital | 115 | 81.5 | 6 | 84 | 52.8 | 8 | 58 | 68.2 | 6 |
Low productivity | 138 | 97.9 | 1 | 138 | 86.2 | 4 | 66 | 77.7 | 5 |
Low price of output | 125 | 89.3 | 5 | 149 | 93.1 | 2 | 75 | 89.3 | 3 |
Livestock types | Mean livestock production | Agroecology | ||||||||||||
|---|---|---|---|---|---|---|---|---|---|---|---|---|---|---|
Highland | Midland | Lowland | ||||||||||||
M | SD | Min | Max | M | SD | Min | Max | M | SD | Min | Max | M | SD | |
Cow | 2 | 2 | 0 | 15 | 2 | 2 | 0 | 30 | 2 | 3 | 0 | 7 | 2 | 2 |
Oxen | 1 | 1 | 0 | 4 | 2 | 1 | 0 | 6 | 1 | 1 | 0 | 6 | 1 | 1 |
Heifers | 1 | 1 | 0 | 5 | 1 | 1 | 0 | 5 | 1 | 1 | 0 | 5 | 1 | 1 |
Calves | 1 | 1 | 0 | 6 | 1 | 1 | 0 | 5 | 1 | 1 | 0 | 5 | 1 | 1 |
Sheep | 1 | 2 | 0 | 10 | 1 | 2 | 0 | 6 | 1 | 1 | 0 | 5 | 1 | 1 |
Goats | 0 | 1 | 0 | 6 | 1 | 1 | 0 | 5 | 0 | 1 | 0 | 5 | 0 | 1 |
Donkey | 0 | 0 | 0 | 2 | 0 | 0 | 0 | 2 | 0 | 0 | 0 | 4 | 0 | 1 |
Horse | 0 | 1 | 0 | 3 | 0 | 1 | 0 | 3 | 0 | 1 | 0 | 2 | 0 | 0 |
Chicken | 2 | 3 | 0 | 10 | 2 | 2 | 0 | 14 | 2 | 3 | 0 | 10 | 2 | 3 |
Milk production performance | N | Min. | Max. | Mean | SD |
|---|---|---|---|---|---|
Local cow average milk (L/day/cow) | 321 | 0.00 | 4.00 | 1.18 | 0.61 |
Cross cow average milk (L/day/cow) | 17 | 2.00 | 6.00 | 2.91 | 1.15 |
Local cow Lactation period (in month) | 317 | 2 | 18 | 7.83 | 2.96 |
crossbred cow Lactation period (in month) | 16 | 2 | 8 | 5.25 | 1.81 |
Major livestock feeding systems | Proportion of livestock feeding system | Agroecology | ||||||
|---|---|---|---|---|---|---|---|---|
Highland | Midland | Lowland | ||||||
N | % | N | % | N | % | N | % | |
Free grazing /communal | 175 | 45.3 | 52 | 36.9 | 84 | 52.5 | 39 | 45.9 |
Tethering on grassland | 42 | 10.9 | 18 | 12.8 | 19 | 11.9 | 5 | 5.9 |
Crop residues | 28 | 7.2 | 11 | 7.8 | 12 | 7.5 | 5 | 5.9 |
Tethering on grassland and crop residues | 45 | 11.7 | 31 | 22.0 | 9 | 5.6 | 5 | 5.9 |
Free grazing, Tethering on grassland and crop residue | 49 | 12.7 | 21 | 14.9 | 15 | 9.4 | 13 | 15.3 |
Free and Tethering on grassland | 6 | 1.6 | 3 | 2.1 | 2 | 1.2 | 1 | 1.2 |
Transhumances | 1 | 0.3 | 1 | 0.7 | 0 | 0.0 | 0 | 0.0 |
Parameters | Total | Agroecology | |||||||
|---|---|---|---|---|---|---|---|---|---|
Highland (141) | Midland (160) | Lowland (85) | |||||||
N | % | N | % | N | % | N | % | ||
Improved forage technologies | Yes | 45 | 11.7 | 23 | 16.3 | 15 | 9.4 | 7 | 8.2 |
No | 341 | 88.3 | 118 | 83.7 | 145 | 90.6 | 78 | 91.8 | |
Which improved forage varieties/grass you used? | Elephant grass | 41 | 10.6 | 24 | 17.0 | 12 | 7.5 | 5 | 5.9 |
Desho grass | 3 | 0.8 | 0 | 0.0 | 1 | 0.6 | 2 | 2.3 | |
Vetiver grass | 2 | 0.5 | 0 | 0.0 | 2 | 1.3 | 0 | 0.0 | |
Not practiced | 340 | 88.1 | 117 | 83.0 | 145 | 90.6 | 78 | 91.8 | |
Local name | Scientific name | Respondents ‘Yes’ response | Agroecology | ||||||
|---|---|---|---|---|---|---|---|---|---|
Highland | Midland | Lowland | |||||||
N | % | N | % | N | % | N | % | ||
Common livestock diseases | 343 | 88.9 | 135 | 95.7 | 140 | 87.5 | 68 | 80.0 | |
Gandii | Trypanosomiasis | 281 | 72.8 | 108 | 76.6 | 116 | 72.5 | 57 | 67.1 |
Abbaa Gorbaa | Black Leg | 97 | 25.1 | 35 | 24.8 | 43 | 26.9 | 19 | 22.4 |
Abbaa Sangaa | Anthrax | 138 | 35.8 | 51 | 36.2 | 56 | 35.0 | 31 | 36.5 |
Silmii | Ticks | 259 | 67.1 | 112 | 79.4 | 104 | 65.0 | 43 | 50.6 |
Bokoksaa | Bloat | 232 | 60.1 | 90 | 63.8 | 98 | 61.2 | 44 | 51.8 |
Shifshaafii | Lamp skin | 230 | 59.6 | 97 | 68.8 | 93 | 58.1 | 40 | 47.1 |
Dhulaandhula | Lichen | 153 | 39.6 | 53 | 37.6 | 70 | 43.8 | 30 | 35.3 |
Gororsaa | Pastereollosis | 263 | 68.1 | 104 | 73.8 | 108 | 67.5 | 51 | 60.0 |
Dhibee Harmaa | Mastitis | 257 | 66.6 | 106 | 75.2 | 102 | 63.8 | 49 | 57.6 |
Dhibee Lukkuu | Fugel | 242 | 62.7 | 98 | 69.5 | 97 | 60.6 | 47 | 55.3 |
Beekeeping | Proportion of colonies and types of beehives | Agroecology | |||||||
|---|---|---|---|---|---|---|---|---|---|
Highland | Midland | Lowland | |||||||
N | % | N | % | N | % | N | % | ||
Honey bee colonies | Yes | 122 | 31.6 | 47 | 33.3 | 43 | 26.9 | 32 | 37.6 |
No | 264 | 68.4 | 94 | 66.7 | 117 | 73.1 | 53 | 62.4 | |
Types of beehives | Traditional | 105 | 27.1 | 43 | 30.5 | 33 | 20.6 | 29 | 34.1 |
Modern | 31 | 7.9 | 6 | 4.2 | 15 | 9.4 | 10 | 11.8 | |
Transitional | 21 | 5.5 | 2 | 1.4 | 5 | 3 | 5 | 5.9 | |
Livestock production constraints | Agroecology | ||||||||
|---|---|---|---|---|---|---|---|---|---|
Highland | Midland | Lowland | |||||||
N | % | Rank | N | % | Rank | N | % | Rank | |
Disease | 135 | 96.5 | 1 | 138 | 87.9 | 1 | 68 | 88.4 | 1 |
Shortage of animal health centers | 87 | 62.1 | 7 | 89 | 56.7 | 5 | 55 | 71.4 | 3 |
Feed shortage | 122 | 87.1 | 4 | 124 | 78.9 | 3 | 54 | 69.2 | 5 |
Shortage of grazing land | 124 | 88.6 | 3 | 130 | 82.8 | 2 | 54 | 70.2 | 4 |
Lack of improved breed | 129 | 92.2 | 2 | 123 | 78.3 | 4 | 63 | 81.8 | 2 |
Water shortage | 13 | 9.3 | 8 | 15 | 9.6 | 8 | 8 | 10.3 | 8 |
Lack of capital | 114 | 81.4 | 6 | 85 | 54.1 | 7 | 46 | 59.7 | 7 |
Shortage of awareness | 116 | 82.9 | 5 | 88 | 56.1 | 6 | 47 | 61.0 | 6 |
Land use types | Total land use size (mean ha) | Land use land cover per three agro-ecologies | ||||||
|---|---|---|---|---|---|---|---|---|
Highland | Midland | Lowland | ||||||
Mean | SD. | Mean | SD. | Mean | SD. | Mean | SD. | |
Total land holdings (ha) | 2.08 | 1.83 | 2.16 | 1.56 | 1.90 | 1.75 | 2.28 | 2.32 |
Cultivable land (ha) | 1.08 | 1.07 | 1.17 | 0.89 | 0.89 | 0.86 | 1.29 | 1.53 |
Grazing land (ha) | 0.29 | 0.53 | 0.34 | 0.47 | 0.31 | 0.60 | 0.18 | 0.46 |
Fallow land (ha) | 0.07 | 0.22 | 0.13 | 0.31 | 0.04 | 0.14 | 0.05 | 0.16 |
Forest land (ha) | 0.99 | 6.59 | 1.33 | 10.51 | 0.77 | 2.55 | 0.84 | 1.52 |
Degraded land (ha) | 0.01 | 0.10 | 0.01 | 0.06 | 0.02 | 0.15 | 0.00 | 0.03 |
Rented in land (ha) | 0.04 | 0.19 | 0.06 | 0.26 | 0.01 | 0.09 | 0.05 | 0.19 |
Shared in land (ha) | 0.24 | 0.43 | 0.27 | 0.52 | 0.25 | 0.39 | 0.17 | 0.34 |
Shared out land (ha) | 0.01 | 0.20 | 0.00 | 0.00 | 0.03 | 0.32 | 0.00 | 0.00 |
Residential land (ha) | 0.16 | 0.09 | 0.18 | 0.13 | 0.15 | 0.07 | 0.15 | 0.05 |
Types of forest | Proportion of hh forest ownership | Household forest ownership per agro ecology | |||||||
|---|---|---|---|---|---|---|---|---|---|
Highland | Midland | Lowland | |||||||
N | % | N | % | N | % | N | % | ||
Forest ownership | Yes | 221 | 57.3 | 75 | 53.2 | 94 | 58.8 | 52 | 61.2 |
No | 165 | 42.7 | 66 | 46.8 | 66 | 41.2 | 33 | 38.8 | |
Type of forest | Natural | 70 | 18.1 | 20 | 14.2 | 28 | 17.5 | 22 | 25.9 |
Plantation | 73 | 18.9 | 28 | 19.9 | 33 | 20.6 | 12 | 14.1 | |
Both | 79 | 20.5 | 28 | 19.9 | 33 | 20.6 | 18 | 21.2 | |
I didn’t practice | 164 | 42.5 | 65 | 46.1 | 66 | 41.2 | 33 | 38.8 | |
Purpose of forest production | Income generation | 88 | 22.8 | 28 | 19.9 | 36 | 22.5 | 24 | 28.2 |
Soil erosion control | 10 | 2.6 | 5 | 3.5 | 3 | 1.9 | 2 | 2.4 | |
Soil fertility improvement | 7 | 1.8 | 3 | 2.1 | 4 | 2.5 | 0 | 0.0 | |
Coffee shade and weather balance | 36 | 9.3 | 6 | 4.3 | 13 | 8.1 | 17 | 20.0 | |
For construction | 4 | 1.0 | 2 | 1.4 | 2 | 1.2 | 0 | 0.0 | |
Bee keeping | 7 | 1.8 | 1 | 0.7 | 5 | 3.1 | 1 | 1.2 | |
Types of forest | Proportion of hh forest ownership | Household’s Agroforestry per Agro ecology | |||||||
|---|---|---|---|---|---|---|---|---|---|
Highland | Midland | Lowland | |||||||
N | % | N | % | N | % | N | % | ||
Agroforestry practices | Yes | 235 | 60.9 | 71 | 50.4 | 98 | 61.2 | 66 | 77.6 |
No | 151 | 39.1 | 70 | 49.6 | 62 | 38.8 | 19 | 22.4 | |
Type of agroforestry | Home gardens | 101 | 26.2 | 27 | 19.1 | 39 | 24.4 | 35 | 41.2 |
Fruit based agro-forestry | 9 | 2.3 | 1 | 0.7 | 6 | 3.8 | 2 | 2.4 | |
Coffee based agro-forestry | 18 | 4.7 | 7 | 5.0 | 6 | 3.8 | 5 | 5.9 | |
Woodlots | 14 | 3.6 | 6 | 4.3 | 8 | 5.0 | 0 | 0.0 | |
Home-gardens and windbreaks | 14 | 3.6 | 6 | 4.3 | 6 | 3.8 | 2 | 2.4 | |
Home-gardens and fruit trees on cropland | 8 | 2.1 | 2 | 1.4 | 4 | 2.5 | 2 | 2.4 | |
Home-gardens, woodlot and trees on rangelands | 4 | 1.0 | 2 | 1.4 | 2 | 1.2 | 0 | 0.0 | |
Home-gardens, fruit trees on cropland, Woodlot and windbreaks | 8 | 2.1 | 2 | 1.4 | 5 | 3.1 | 1 | 1.2 | |
Didn’t practice | 151 | 39.1 | 70 | 49.6 | 62 | 38.8 | 19 | 22.4 | |
Types of soil and water conservation practice | Proportion of conservation practice | Agro ecologies | |||||||
|---|---|---|---|---|---|---|---|---|---|
Highland | Midland | Lowland | |||||||
N | % | N | % | N | % | N | % | ||
conservation practice | Yes | 261 | 67.6 | 91 | 64.5 | 116 | 72.5 | 54 | 63.5 |
No | 125 | 32.4 | 50 | 35.5 | 44 | 27.5 | 31 | 36.5 | |
Types of soil and water conservation practice | Terraces | 148 | 38.3 | 49 | 34.8 | 62 | 38.8 | 37 | 43.5 |
Check dam | 34 | 8.8 | 10 | 7.1 | 16 | 10.0 | 8 | 9.4 | |
Grasses | 14 | 3.6 | 3 | 2.1 | 8 | 5.0 | 3 | 3.5 | |
Multipurpose trees | 7 | 1.8 | 3 | 2.1 | 3 | 1.9 | 1 | 1.2 | |
Not practiced | 119 | 30.8 | 49 | 34.8 | 39 | 24.4 | 31 | 36.5 | |
Soil bund & grasses | 23 | 6.0 | 10 | 7.1 | 9 | 5.6 | 4 | 4.7 | |
Soil bund & multipurpose trees | 17 | 4.4 | 10 | 7.1 | 7 | 4.4 | 0 | 0.0 | |
Soil bund, grasses & multipurpose trees | 12 | 3.1 | 6 | 4.3 | 6 | 3.8 | 0 | 0.0 | |
Check dam & Grasses | 3 | 0.8 | 0 | 0.0 | 2 | 1.2 | 1 | 1.2 | |
Purpose of soil and water conservation practice | Reduce soil erosion | 160 | 41.5 | 42 | 29.8 | 78 | 48.8 | 40 | 47.1 |
Improve soil fertility | 12 | 3.1 | 7 | 5.0 | 4 | 2.5 | 1 | 1.2 | |
Reduce soil erosion and Increase soil moisture | 12 | 3.1 | 5 | 3.5 | 4 | 2.5 | 3 | 3.5 | |
Reduce soil erosion and Improve soil fertility | 43 | 11.1 | 20 | 14.2 | 15 | 9.4 | 8 | 9.4 | |
Reduce soil erosion, improve soil fertility and climate balance | 14 | 3.6 | 13 | 9.2 | 1 | 0.6 | 0 | 0.0 | |
Total hh lime utilization status | Lime utilization status per agro-ecology | ||||||||
|---|---|---|---|---|---|---|---|---|---|
Highland | Midland | Lowland | |||||||
N | % | N | % | N | % | N | % | ||
Lime application | Yes | 12 | 3.1 | 6 | 4.3 | 3 | 1.9 | 3 | 3.5 |
No | 374 | 96.9 | 135 | 95.7 | 157 | 98.1 | 82 | 96.5 | |
Methods of lime application | Based on soil test | 11 | 2.8 | 6 | 4.3 | 3 | 1.9 | 2 | 2.4 |
By estimation | 1 | 0.3 | 0 | 0.0 | 0 | 0.0 | 1 | 1.2 | |
Did not applied | 374 | 96.9 | 135 | 95.7 | 157 | 98.1 | 82 | 96.5 | |
Source of lime | District agricultural office | 7 | 1.8 | 1 | 0.7 | 3 | 1.9 | 3 | 3.5 |
Research center | 4 | 1.0 | 4 | 2.8 | 0 | 0.0 | 0 | 0.0 | |
University | 1 | 0.3 | 1 | 0.7 | 0 | 0.0 | 0 | 0.0 | |
Did not get/applied | 374 | 96.9 | 135 | 95.7 | 157 | 98.1 | 82 | 96.5 | |
NR related constraints | Agroecology | ||||||||
|---|---|---|---|---|---|---|---|---|---|
Highland | Midland | Lowland | |||||||
N | % | Rank | N | % | Rank | N | % | Rank | |
Soil fertility decline | 135 | 95.7 | 1 | 150 | 93.7 | 1 | 72 | 84.7 | 3 |
Soil erosion | 127 | 90.1 | 3 | 139 | 86.8 | 3 | 75 | 88.3 | 2 |
Lack of sustainable SWC Managements | 134 | 95.1 | 2 | 146 | 91.2 | 2 | 82 | 96.5 | 1 |
Lack of common understanding on SWC | 109 | 77.5 | 5 | 104 | 65.0 | 4 | 58 | 68.1 | 5 |
Deforestation | 42 | 29.8 | 6 | 36 | 22.5 | 7 | 18 | 21.2 | 7 |
Shortage of land for afforestation | 47 | 33.1 | 7 | 38 | 23.7 | 6 | 21 | 24.8 | 6 |
Lack of seedling | 8 | 6.3 | 8 | 11 | 6.9 | 8 | 4 | 4.8 | 8 |
Lack of lime accessibility | 119 | 84.3 | 4 | 88 | 55.3 | 5 | 62 | 72.8 | 4 |
Major Livelihood Activities | Agroecology | ||||||
|---|---|---|---|---|---|---|---|
Highland | Midland | Lowland | |||||
N | % | N | % | N | % | ||
Livelihood activities | Mixed crop-livestock farming | 123 | 87.2 | 133 | 83.1 | 77 | 90.6 |
Mixed farming and off/non-farm | 16 | 1.4 | 25 | 1.2 | 6 | 2.4 | |
Off/non-farm activities | 2 | 11.3 | 2 | 15.6 | 2 | 7.1 | |
Income sources (Birr/year) | Mixed crop-livestock productions | 35,782.27 | 46,605.63 | 72,245.88 | |||
Farming and off/non-farm activities | 19,250 | 27,041.67 | 21,150 | ||||
Off/non-farm activities | 4307.80 | 5193.75 | 7417.65 | ||||
Agricultural labor sources | Proportion of labor source | Agroecology | |||||||
|---|---|---|---|---|---|---|---|---|---|
Highland | Midland | Lowland | |||||||
N | % | N | % | N | % | N | % | ||
Labor Source | Family labor | 128 | 33.2 | 40 | 28.4 | 62 | 38.1 | 27 | 31.8 |
Resporical/dabo | 15 | 3.9 | 8 | 5.7 | 4 | 2.5 | 3 | 3.5 | |
Hired labor | 9 | 2.3 | 0 | 0.0 | 3 | 1.9 | 6 | 7.1 | |
Family and hired labor | 39 | 10.1 | 13 | 9.2 | 14 | 8.8 | 12 | 14.1 | |
Debo and family labors | 79 | 20.5 | 34 | 24.1 | 33 | 20.6 | 12 | 14.1 | |
Family labor, Debo and Hired labor | 107 | 27.7 | 44 | 31.2 | 40 | 25.0 | 23 | 27.1 | |
Dado and family labor | 7 | 1.8 | 1 | 0.7 | 4 | 2.5 | 2 | 2.4 | |
Labor Shortage | Yes | 253 | 65.5 | 90 | 63.8 | 103 | 64.4 | 60 | 70.6 |
No | 133 | 34.5 | 51 | 36.2 | 57 | 35.6 | 25 | 29.4 | |
Access to institutional services | Status HH access to services | Agroecology | |||||||
|---|---|---|---|---|---|---|---|---|---|
Highland | Midland | Lowland | |||||||
N | % | N | % | N | % | N | % | ||
Extension Services | Yes | 352 | 91.2 | 125 | 88.7 | 144 | 90.0 | 83 | 97.6 |
No | 34 | 8.8 | 16 | 11.3 | 16 | 10.0 | 2 | 2.4 | |
Credit Services | Yes | 101 | 26.2 | 29 | 20.6 | 48 | 30.0 | 24 | 28.2 |
No | 285 | 73.8 | 112 | 79.4 | 112 | 70.0 | 61 | 71.8 | |
Access to Market Information | Yes | 253 | 65.5 | 89 | 63.1 | 110 | 68.8 | 54 | 63.5 |
No | 133 | 34.4 | 52 | 36.9 | 50 | 31.2 | 31 | 36.5 | |
CALM | Climate Action Through Landscape Management Program for Results Project |
FGD | Focus Group Discussions |
CSA | Central Statistical Agency |
GDP | Gross Domestic Product |
MOYESH | More Young Entrepreneurs In Silk Honey |
PRA | Participatory Rural Appraisal |
SLM | Sustainable Land Management Project |
SPSS | Statistical Packages For Social Sciences |
SWC | Soil And Water Conservation |
UNESCO | United Nations Educational, Scientific And Cultural Organization |
| [1] | Addisu Hailu, Ajebush Defar, Diriba Mengistu, Hussen Abro and Yasin Esmael (eds.) 2019. Proceedings of Review Workshop on Completed Research Activities of Agricultural Economics, Extension and Gender Research Directorate held at Adami Tulu Agricultural Research Center, Adami Tulu, Ethiopia, 8-11 September 2018. Oromia Agricultural Research Institute (IQQO), Finfinne, Ethiopia. |
| [2] | Bira T, et al. A Honey Production System in Buno Bedele and Ilu Abba Bora Zones, South Western Oromia, Ethiopia. J Agri Allied Sci. 2024; 13: 003. |
| [3] | CSA. 2020a. Agricultural Sample Survey 2019/20 [2012 E. C.]. Volume II report on livestock and livestock characteristics (private peasant holdings). Central Statistical Agency (CSA): Addis Ababa, Ethiopia. |
| [4] | Dube B, Temam N, Chimdessa D, et al. Socio-economic characterization, identification and prioritization of major constraints and opportunities in Barite community watershed of Dabo Hana district of Buno Bedele zone. Adv Plants Agric Res. 2024; 10(1): 1‒9. |
| [5] | FAO & ECDPM. (2021). Political economy analysis of the Ethiopian food system. |
| [6] | Gurmu, H. R. (2020). A review paper on impact of foreign aid on economic development of Ethiopia. International Journal of Economics and Business, Zambrut, 7(1), 43–48. ISSN: 2717-3151. |
| [7] | Lukuyu, M. N.; Gibson, J. P.; Savage, D. B.; Duncan, A. J.; Mujibi, F. D. N.; Okeyo, A. M. Use of body linear measurements to estimate live weight of crossbred dairy cattle in smallholder farms in Kenya. SpringerPlus 2016, 5, 1–14. [CrossRef]. |
| [8] | Management Entity. 2021. Ethiopia’s Livestock Systems: Overview and Areas of Inquiry. Gainesville, FL, USA: Feed the Future Innovation Lab for Livestock Systems. |
| [9] | Merga, B. and J. Haji (2019). "Factors impeding effective crop production in Ethiopia." Journal of Agricultural Science 11(10): 98. |
| [10] | Mezgebu, M. (2023). "Assessment of agroforestry practices in Buno Bedele and Ilu Abba Bora zone of Oromia region, Ethiopia." |
| [11] | National Bank of Ethiopia (NBE), (2021). Annual report of 2020/21. |
| [12] | Plecher, H. (2020). Ethiopia: Share of economic sectors in the gross domestic product (GDP) from 2009 to 2019. |
| [13] | Taffesse, Alemayehu Seyoum Dorosh, Paul Gemessa and Sinafikeh Asrat (2012). “Crop production in Ethiopia: Regional patterns and trends.” Food and agriculture in Ethiopia: Progress and policy challenges, 53-83. |
| [14] | Wakshuma Gelalcha Gebewo, Mati Roba Bulcha, Mohammed Husen Tayir, Wakuma Mitiku Bune, Mahendra Pal. (2023) Current Status of Beekeeping in Ethiopia and Its Future Prospects. International Journal of Food Science and Agriculture, 7(2), 219-228. |
| [15] | Yigezu Wendimu, G. (2021). "The challenges and prospects of Ethiopian agriculture." Cogent Food & Agriculture 7(1): 1923619. |
APA Style
Temam, N., Aman, S., Hordofa, D. (2025). Characterization and Analysis of Farming System in Buno Bedele and Ilu Ababor Zones of Oromia Regional State, Ethiopia. International Journal of Agricultural Economics, 10(3), 126-148. https://doi.org/10.11648/j.ijae.20251003.14
ACS Style
Temam, N.; Aman, S.; Hordofa, D. Characterization and Analysis of Farming System in Buno Bedele and Ilu Ababor Zones of Oromia Regional State, Ethiopia. Int. J. Agric. Econ. 2025, 10(3), 126-148. doi: 10.11648/j.ijae.20251003.14
@article{10.11648/j.ijae.20251003.14,
  author = {Nuru Temam and Suleiman Aman and Diriba Hordofa},
  title = {Characterization and Analysis of Farming System in Buno Bedele and Ilu Ababor Zones of Oromia Regional State, Ethiopia
},
  journal = {International Journal of Agricultural Economics},
  volume = {10},
  number = {3},
  pages = {126-148},
  doi = {10.11648/j.ijae.20251003.14},
  url = {https://doi.org/10.11648/j.ijae.20251003.14},
  eprint = {https://article.sciencepublishinggroup.com/pdf/10.11648.j.ijae.20251003.14},
  abstract = {Farming system characterization and analysis is a roadmap for dynamic agricultural production constraints and opportunities identification and prioritization. Hence, this activity was initiated to identify and characterize the existing farming system, its constraints and opportunities in Buno Bedele and Ilu Ababor zones. A cross sectional research design with two-stage sampling was employed. Quantitative and qualitative data were collected from primary and secondary sources. A total of 386 household heads were selected for quantitative data whereas qualitative data were collected from focus group discussion and key informants via face to face interviews. Secondary data were collected from relevant published and unpublished documents. In SPSS version 20 software, simple descriptive statistics like mean, standard deviation, percentage and pair-wise ranking were used for data analysis. The result revealed that, there was a diverse crop-livestock mixed farming system where crop farming system was the dominant and characterized as rain fed and irrigation-based farming system. Cereal, horticulture, and coffee-khat-based farming systems were common in rain fed whereas few cereal and horticultural crops under irrigation farming systems were practiced in the study areas. The types of livestock reared in the areas were cattle, poultry, sheep, goats, and equines. Even though, there were numerous development supporting government and non-governmental organizations including research centers, universities, agricultural offices, climate action through landscape management (CALM) program for results project, sustainable land management (SLM) project, more young entrepreneurs in silk honey (MOYESH) project and private sectors that are contributing in crop and livestock improvement, natural resource management and job creation; high price of agricultural inputs, lack of improved seed and breeds, delay of fertilizers supply, low production and productivity, lack of capital, shortage of land, crop and livestock diseases, feed shortage, poor soil fertility, soil erosion and lack of common understanding on lime application were the major agricultural production constraints in the study areas. Therefore, all government and non-government development practitioners in the areas should consider the existing agricultural production systems, constraints and opportunities for fruitful interventions.
},
 year = {2025}
}
TY  - JOUR
T1  - Characterization and Analysis of Farming System in Buno Bedele and Ilu Ababor Zones of Oromia Regional State, Ethiopia

AU  - Nuru Temam
AU  - Suleiman Aman
AU  - Diriba Hordofa
Y1  - 2025/06/25
PY  - 2025
N1  - https://doi.org/10.11648/j.ijae.20251003.14
DO  - 10.11648/j.ijae.20251003.14
T2  - International Journal of Agricultural Economics
JF  - International Journal of Agricultural Economics
JO  - International Journal of Agricultural Economics
SP  - 126
EP  - 148
PB  - Science Publishing Group
SN  - 2575-3843
UR  - https://doi.org/10.11648/j.ijae.20251003.14
AB  - Farming system characterization and analysis is a roadmap for dynamic agricultural production constraints and opportunities identification and prioritization. Hence, this activity was initiated to identify and characterize the existing farming system, its constraints and opportunities in Buno Bedele and Ilu Ababor zones. A cross sectional research design with two-stage sampling was employed. Quantitative and qualitative data were collected from primary and secondary sources. A total of 386 household heads were selected for quantitative data whereas qualitative data were collected from focus group discussion and key informants via face to face interviews. Secondary data were collected from relevant published and unpublished documents. In SPSS version 20 software, simple descriptive statistics like mean, standard deviation, percentage and pair-wise ranking were used for data analysis. The result revealed that, there was a diverse crop-livestock mixed farming system where crop farming system was the dominant and characterized as rain fed and irrigation-based farming system. Cereal, horticulture, and coffee-khat-based farming systems were common in rain fed whereas few cereal and horticultural crops under irrigation farming systems were practiced in the study areas. The types of livestock reared in the areas were cattle, poultry, sheep, goats, and equines. Even though, there were numerous development supporting government and non-governmental organizations including research centers, universities, agricultural offices, climate action through landscape management (CALM) program for results project, sustainable land management (SLM) project, more young entrepreneurs in silk honey (MOYESH) project and private sectors that are contributing in crop and livestock improvement, natural resource management and job creation; high price of agricultural inputs, lack of improved seed and breeds, delay of fertilizers supply, low production and productivity, lack of capital, shortage of land, crop and livestock diseases, feed shortage, poor soil fertility, soil erosion and lack of common understanding on lime application were the major agricultural production constraints in the study areas. Therefore, all government and non-government development practitioners in the areas should consider the existing agricultural production systems, constraints and opportunities for fruitful interventions.

VL  - 10
IS  - 3
ER  -
Department of Agricultural Economics, Bedele Agricultural Research Center, Bedele, Ethiopia
Department of Rural Development and Agricultural Extension, Bedele Agricultural Research Center, Bedele, Ethiopia
Department of Rural Development and Agricultural Extension, Bedele Agricultural Research Center, Bedele, Ethiopia
Information