Abstract
Background: Economic Value Added (EVA), introduced by Stern Value Management in 1983, is recognized as a robust performance measure that incorporates the cost of capital to evaluate true economic profit. Unlike traditional accounting indicators, EVA emphasizes shareholder value creation and provides insights into market valuation. This study investigates the impact of EVA on the share price of Hindustan Unilever Limited (HUL), one of India’s leading FMCG companies. Methodology: The study is based on secondary data spanning 2013-14 to 2023-24, obtained from HUL’s annual reports and verified through financial databases such as NSE, Yahoo Finance, and Moneycontrol. EVA was computed using NOPAT, ROIC, and WACC, while the average share price was derived from opening and closing values. Statistical analysis included correlation, simple linear regression, and ANOVA to determine the relationship between EVA and share price performance. Results: Findings reveal a positive and statistically significant association between EVA and HUL’s average share price. The correlation coefficient (R = 0.605) indicates a moderate positive relationship. Regression results (R² = 0.366, β = 0.482, p = 0.049) confirm EVA as a significant predictor, explaining nearly 37% of the variation in share price. Despite minor fluctuations in EVA during certain years, the overall trend of rising EVA parallels the consistent growth in HUL’s market valuation, underscoring its role in long-term value creation. Conclusion: EVA emerges as a reliable indicator of financial performance and shareholder value in the Indian context. The study highlights its practical utility for investors, analysts, and corporate decision-makers, reinforcing the importance of value-based measures over conventional accounting metrics in strategic financial planning and investment analysis.
Keywords
Economic Value Added, Financial Performance, Hindustan Unilever Limited, Regression Model
1. Introduction
Residual Income (RI) is represented with added accessibility as well as acceptability in the name of Economic Value Added (EVA) by management consulting firm Stern Value Management, a leading consulting organisation as well as leading promoter of the concept. Economic value added (EVA) is a measure of a company's financial performance based on the residual wealth calculated by deducting its cost of capital from its operating profit, adjusted for taxes on a cash basis. EVA can also be referred to as economic profit, as it attempts to capture the true economic profit of a company. As noted by Stern Value Management, in 1983 the management team developed EVA, “a new model for maximizing the value created that can also be used to provide incentives at all levels of the firm.” The goal of EVA is to quantify the cost of investing capital into a certain project or firm and then assess whether it generates enough cash to be considered a good investment. A positive EVA shows a project is generating returns in excess of the required minimum return.
This measure was devised by the management consulting firm Stern Value Management, originally incorporated as Stern Stewart & Co. EVA is used to measure the value a company generates from funds invested in it. EVA assesses the performance of a company and its management through the idea that a business is only profitable when it creates wealth and returns for shareholders, thus requiring performance above a company's cost of capital. EVA as a performance indicator is very useful. The calculation shows how and where a company created wealth, through the inclusion of balance sheet items. This forces managers to be aware of assets and expenses when making managerial decisions. However, the EVA calculation relies heavily on the amount of invested capital and is best used for asset-rich companies that are stable or mature. Companies with intangible assets, such as technology businesses, may not be good candidates for an EVA evaluation. This paper aims to describe Economic Value Added and assess the impact EVA on share price.
2. Review of Related Literature
Sabol and Sverer (2017) identified by reviewing the existing body of literature on the EVA and its application; it further seeks to establish how effective it is as a performance measure and also gives the practical applications of the same
| [1] | Sabol, A., & Sverer, F. (2017). A review of the economic value added literature and application. UTMS journal of economics, 8(1), 19-27. https://hdl.handle.net/10419/174163 |
[1]
. The study applied a systematic literature review methodology in collecting information and sorting out relevant papers and theories. The conclusions most probably restate the points with an addition of some analysis of the positive aspects, negative aspects, and practical applications of EVA. Biases in the choice of books and the problems regarding generalizability are some of the limitations. Conclude it normally by summarizing the main findings and giving recommendations for future research.
Abraham et al. (2017) identified the effect of the earnings yield on various financial outcomes in both the biotechnology and oil and gas industries
| [2] | Abraham, R., Harris, J., & Auerbach, J. (2017). Earnings yield as a predictor of return on assets, return on equity, economic value added and the equity multiplier. Modern Economy, 8(1), 10. http://dx.doi.org/10.4236/me.2017.81002 |
[2]
. RATS software was used in conducting multiple regression analysis as well as an industry in the course of doing the study. Positive correlations between earnings yield and stock return, economic value added, return on equity, return on assets, and the equity multiplier were found. Some of the limitations included the application of specific industry data and the fact that the results are open to further research in other sectors. Based on the above, it was deduced that across categories of sectors, earnings yield did prove to be a good predictor of parameters of financial success.
Malichova et al. (2017) discovered the utilization of the Economic Value-Added methodology within Slovak companies, especially in the manufacturing industry. The method of the approach was that EVA had to be calculated in four steps: From the results, it emerged that EVA may influence management's perceptions about profitability; this could be judged from data received from 21 Slovak companies
. The limitations were inter alia the complexity involved in adjusting the financial data and the volatility of profitability. The conclusion highlighted the fact that EVA, even though unable to continuously maintain high value due to changing economic conditions for the firm, can always change the focus of the firm from profit to value creation.
Alsoboa (2017) aimed at comparing the ROA with EVA and CSV in Jordanian industrial enterprises listed on the ASE. The study found that EVA is a better indicator of CSV changes compared to ROA; this was based on secondary data that were obtained from yearly financial reports and applied throughout 51 companies from 2011 to 2015. The deficiencies of the research included the fact that it focused only on industrial enterprises, and very few indicators were used. The conclusion emphasized the importance of modern financial indicators in the management control system for performance evaluation purposes
| [4] | Alsoboa, S. S. (2017). The Influence of Economic Value Added and Return on Assets on Created Shareholders Value: A Comparative Study in Jordanian Public Industrial Firms. International Journal of Economics and Finance, 9(4), 63. https://doi.org/10.5539/Ijef.V9n4p63 |
[4]
.
Al-Awawdeh and Kareem Al-Sakini (2018) investigated the impact of traditional accounting rules, market value added, and economic value added on maximizing shareholders' value in Jordanian commercial banks. This study has used the pooled data regression approach to examine the financial statements for the period from 2010 to 2016
| [5] | Al-Awawdeh, H. A., & Kareem Al-Sakini, S. A. (2018). The Impact of Economic Value Added, Market Value Added and Traditional Accounting Measures on Shareholders’ Value: Evidence from Jordanian Commercial Banks. International Journal of Economics and Finance, 10(10), 40. https://doi.org/10.5539/Ijef.V10n10p40 |
[5]
. The results indicate that MVA does not show a significant increase in shareholders' value statistically; on the other hand, EVA does. One of the limitations of this study could be possible pricing inefficiencies in the Amman Stock Exchange. Finally, the conclusion has been made, stating the relevance of EVA regarding assessing and estimating share values.
Johan (2019) investigated the relations of Astra International's subsidiaries with Economic Value Added, Market Value Added, and Return on Weighted Average Cost of Capital. The research methodology consists of the analysis of financial performance measurement and also a comparison of EVA, MVA, and ROC across different subsidiaries. The results show that there are differences in measures of EVA, MVA, and ROC within the same industry. One of the limitations is that negative MVA does not translate to negative EVA values
| [6] | Johan, S. (2019). The Relationship Between Economic Value Added, Market Value Added, And Return On Cost Of Capital In Measuring Corporate Performance. Jurnal Manajemen Bisnis Dan Kewirausahaan, 2(1). https://doi.org/10.24912/Jmbk.V2i1.4804 |
[6]
. The findings of the study have very strongly brought out the fact that the perception in the market about value for any firm is more influenced by the prospects of the future than by EVA.
Taslim (2018) aimed at measuring the effect of MVA and EVA on corporate value. Factor analysis and multiple regressions were performed in the quantitative method adopted, while secondary data were sourced from the financial statements of 39 manufacturing companies listed on the Indonesia Stock Exchange from 2011 to 2014
| [7] | Taslim, F. A. (2018). The Influence of Economic Value Added and Market Value Added on Corporate Value. Russian Journal of Agricultural and Socio-Economic Sciences, 74(2), 90-98. https://doi.org/10.18551/Rjoas.2018-02.10 |
[7]
. These findings are rather contrary to previous studies where MVA and EVA were considered to have a significant effect on business value. One of the main weaknesses of this study was the small sample size used and the complexity of the EVA calculations themselves. It was seen that the MVA and the EVA were not necessarily good predictors for evaluating a firm's value.
Ahmad et al., (2019) assessed the impact of liquidity, profitability, and solvency on Hindustan Petroleum Corporation Limited's Market Value Added and Economic Value Added. Simple regression analysis will be the nature of the examination; such data will be gathered from primary and secondary sources of information
| [8] | Ahmad, I., Alam, M., & Yameen, M. (2019). A Study of Economic Value Added (Eva) & Market Value Added (Mva) Of Hindustan Petroleum Corporation Limited. Global Journal Of Economics And Business, 6(1), 225-237. |
[8]
. The results show that the debt-to-equity ratio, net profit ratio, and interest coverage ratio significantly influence MVA. Two of the limitations are the availability of data and consideration of only one organization. The paper again reiterates that financial measures play a very important role in evaluating business performance and makes some recommendations to further enhance EVA and MVA.
Renalita, and Tanjung (2019) ascertained the influence of the P/E ratio, Return on Assets, Debt-to-equity ratio, and EVA on stock returns. The sample was selected through purposive sampling in the causal research design
| [9] | Renalita, P., & Tanjung, S. (2019). Analysis Of the Effect of Economic Value Added and Other Fundamental Factors of Share Returns. Epra International Journal of Multidisciplinary Research (Ijmr) Peer Reviewed Journal, 5(9). |
[9]
. Panel data regression and descriptive statistics have been used along with econometric models for analyzing the results. Sample size or data accessibility can be the limitations. The results showed that the theories on how EVA, DER, ROA, and PER affect stock returns were upheld.
Jankalova and Kurotova (2019) evaluated business excellence with respect to CSR in view of the EVA approach. Some of the techniques used in this research, which included an in-depth literature review and financial statement analysis, are comparison, induction, and statistical analysis. The results show that sustainability is indeed a complex thing, engulfing varied ideas such as corporate social responsibility and sustainable development
. The challenges in calculating WACC and estimating the value of a firm were among the limitations. Conclusively, a general judgment about the sustainability issue was that environmental, social, economic, and governance indices should be considered.
Subedi and Farazmand (2020) opined on how the adoption of EVA by SASAC impacted SOEs in China. The methodology adopted a first-difference change analysis to control firm-level heterogeneities and endogeneity concerns. EVA use thus improved SOE performance more specifically about non-manufacturing enterprises. The important limitation of it is its focus on one industry and one nation which constrains its generalizability
. In all, this study concludes that EVA had a positive effect in enhancing the performance of an organization in the context of Chinese State-Owned Enterprises and was found to be a useful tool to evaluate the effectiveness of management in the organizations.
Tikasari and Surjandari (2020) identified the relationship between stock return, economic value added, and financial performance. This research uses mining companies listed on the Indonesia Stock Exchange from 2012 to 2018. In this research, panel regression analysis with the help of E-views and SPSS software is going to be used to analyze data gathered from 12 different businesses over 7 years
| [12] | Tikasari, N., & Surjandari, D. A. (2020). The Effect of Economic Value Added and Financial Performance on Stock Return. Saudi Journal of Business and Management Studies, 5(6), 343-352. https://doi.org/10.36348/Sjbms.2020.V05i06.005 |
[12]
. Results indicate that net profit margin and EVA have high impacts on stock returns, while the current ratio, debt-to-equity ratio, and profit per share do not. Two limitations of the study are the use of a small sample size and a narrow focus on just one industry. Based on the prediction of stock returns, net profit margin and EVA come out to be significant, and thereupon stands the conclusion.
Satwiko and Agusto (2021) established what determines stock returns, with greater emphasis on the size of a company and its financial performance. In this research, 52 non-financial companies listed on the Indonesia Stock Exchange from 2013 to 2017 are used in the analysis through purposive sampling. The hypotheses are tested using the technique of multiple regression models. The results show that price-to-book value hurts the stock returns whereas the market value added and return on equity have a positive influence
| [13] | Satwiko, R., & Agusto, V. (2021). Economic Value Added, Market Value Added, Dan Kinerja Keuangan Terhadap Return Saham. Media Bisnis, 13(1), 77-88. https://doi.org/10.34208/Mb.V13i1.956 |
[13]
. A few of the independent variables included are not significant as well; the distribution of data is also not normal. The paper concludes by recommending that other variables, like residual income and business expansion, should be included in future research.
Omneya et al., (2021) assessed business performance based on financial outcome and the effect of Economic Value Added and EVA Momentum. In this respect, stepwise regression analysis and Generalized Least Squares regression were used to test the theories surrounding the effectiveness of such indicators. The results showed that a strong relationship between these metrics for financial success, such as ROA, ROE, and EVA/EVA Momentum exists. Nevertheless, some of the limitations include difficulty in collecting data, especially during the pandemic, and businesses in the banking sector were not included
| [14] | Omneya, A.-K., Ashraf, S., & Eldin, B. B. (2021). Is Economic Value-Added Momentum (Eva Momentum) A Better Performance Measurement Tool? Evidence From Egyptian Listed Firms. American Journal of Industrial and Business Management, 11(03), 297-319. https://doi.org/10.4236/Ajibm.2021.113019 |
[14]
. The research provides better reporting standards for Egypt and concludes EVA and EVA Momentum as helpful in assessing financial performance.
Dobrowolski et al., (2022) focused on the association of social and environmental performance with the financial performance of energy firms, considering agendas for socially conscious investment and energy security
| [15] | Dobrowolski, Z., Drozdowski, G., Panait, M., & Babczuk, A. (2022). Can The Economic Value Added Be Used as The Universal Financial Metric? Sustainability, 14(5), 2967. https://doi.org/10.3390/Su14052967 |
[15]
. As a result, suggestions were provided for further investigation founded on the test with support from an empirical data set and literature review. The results indicate that for companies dealing with energy, the shift to a low-carbon economy must be successful with the checking of economic, social as well as environmental performance. In this paper, only Economic Value-Added analysis has been carried out with the use of no survey data and behavioral research. The conclusion of the study. The lesson learned was about the "limits" of EVA in different scenarios of finance and called for future research.
Tripathi et al., (2022) aimed to review scholarly works in the area of Economic Value Added to understand its usage, constitution, and computation, together with its limitations. This research employs three steps of the refinement method: keyword search, region filtering, and academic filtration on the Scopus database. It establishes the partner countries, topic groups, and leading countries in EVA research
| [16] | Tripathi, P. M., Chotia, V., Solanki, U., Meena, R., & Khandelwal, V. (2022). Economic Value-Added Research: Mapping Thematic Structure and Research Trends. Risks, 11(1), 9. https://doi.org/10.3390/Risks11010009 |
[16]
. Other limitations involved the narrow scope of issues addressed and the possible loss of keyword searches. The paper concluded with the claim about the necessity of mapping citation networks, intellectual structures, and trends in publication for furthering EVA research.
Conclusion of the literature review which will establish research gap and objective and rationale or hypothesis
The present study is aimed at establishing a relationship between Economic Value Added and Average Share Price of Hindustan Unilever Limited. Alternatively, it could also be stated whether the change in EVA is significantly contributing to the change in the Average Share Price of HUL. This research would relate to quantifying the strength and direction of the relationship between EVA and the Average Share Price, with the help of regression analysis using EVA as a predictor variable and Average Share Price as a dependent variable. It also tests the explanatory power of EVA regarding fluctuation in HUL's share price and, therefore, tries to enable the financial analysts and stakeholders to have a proper understanding of the various drivers of market valuation in the backdrop of EVA. Hence, the present study aims to analyse the Impact of EVA as a measure of financial performance on the share price of Hindustan Unilever Limited.
3. Research Methodology
3.1. Data Source
This study is based on secondary data obtained primarily from the annual reports of Hindustan Unilever Limited (HUL), covering a period of ten years from 2014 to 2024. The data used includes information from the Balance Sheet, Profit and Loss Account, and share price trends. Additional financial data, particularly related to stock prices, was collected from reputable online platforms such as Yahoo Finance, Moneycontrol, and the National Stock Exchange (NSE) website to ensure accuracy and consistency.
To calculate the Average Share Price for each financial year, the following formula was used:
Average share price= (Opening price + Closing Price)/2
3.2. Variables Used in the Study
1) Net Operating profit after Taxes (NOPAT): (PBDT + Interest on RBI loans + Interest on others + Total other Income) Less Cash Taxes
2) Invested capital: (Total equity & Reserves + Total borrowings)
3) Return on invested capital (ROIC): (NOPAT / Invested capital)
4) Cost of Equity (Ke): (Rf +b (Rm - Rf)) (capm)
5) Weighted Average Cost of capital (WACC): Weighted cost of Equity + Weighted cost of Debt
6) Economic Value Added (EVA): (ROIC - WACC)
7) Average Last Trading Share price = (Opening + Closing) / 2
3.3. Hypotheses of the Study
Hypotheses were developed to test significant impact of EVA on stock price of Hindustan Uni Lever & that hypothesis was tested using ANOVAs.
Ho: EVA of Hindustan Uni Lever did not have significant impact on Stock price of Hindustan Uni Lever.
3.4. Statistical Analysis
The Study was undertaken by applying Empirical Research Design. Correlation, Coefficient and Anova Test used to identify the relationship between EVA and Stock Market Price of Hindustan Uni Lever.
Normality Test: The Shapiro-Wilk test was conducted to determine the normality of the data for the Average Share Price and EVA of HUL. The results are summarized in
Table 1.
Table 1. Shapiro-Wilk Test for Normality.
| Shapiro-Wilk |
Statistic | df | Sig. |
Average Share Price | .860 | 11 | .057 |
EVA | .933 | 11 | .445 |
The Shapiro-Wilk test for the Average Share Price yielded a statistic of 0.860 with a significance level (Sig.) of 0.057, suggesting that the data is approximately normally distributed. Similarly, the EVA data had a statistic of 0.933 with a Sig. value of 0.445, indicating normality. Since both significance values are greater than 0.05, we fail to reject the null hypothesis of normality for both variables.
4. Results
4.1. EVA & Average Share Price
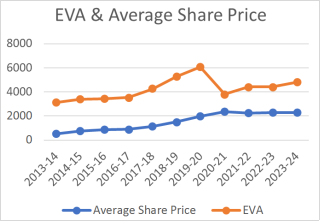
From 2013-14 to 2023-24, the average share price of Hindustan Unilever Ltd. went up significantly from ₹538.78 to ₹ 2289. This significant appreciation in the share price is commensurate with a steady increase in Economic Value Added, which indicates increasing value generation and financial performance by the company. The EVA, interestingly, smoothly increased from ₹3147 in 2013-14 to ₹4808 in 2023-24, peaking in 2019-20 at ₹6085 before falling in 2020-21 (see
figure 1). It is obvious that the trend of EVA shows a constant rise with occasional oscillations, and this must be the outcome of efficient management and operations that have built the market value of the business as reflected in the share prices vide infra. Taken together, these data sets paint HUL as a solid and growing company with confidence in the investor that has risen over the years (
Table 2).
Table 2. EVA & Average Share Price.
Years | Opening Share Price | Closing Share Price | Average Share Price | EVA |
2013-14 | 471.95 | 605.6 | 538.775 | 3147 |
2014-15 | 605.6 | 872 | 738.8 | 3380 |
2015-16 | 872 | 872.7 | 872.35 | 3438 |
2016-17 | 872.7 | 911.8 | 892.25 | 3533 |
2017-18 | 911.8 | 1335.4 | 1123.6 | 4258 |
2018-19 | 1335.4 | 1690 | 1512.7 | 5291 |
2019-20 | 1690 | 2298.5 | 1994.25 | 6085 |
2020-21 | 2298.5 | 2420 | 2359.25 | 3810 |
2021-22 | 2420 | 2046 | 2233 | 4435 |
2022-23 | 2046 | 2560 | 2303 | 4435 |
2023-24 | 2289 | 2289 | 2289 | 4808 |
Source: Author’s calculation
Figure 1. Trends of EVA and Average share price from 2014 to 2024.
4.2. Impact of EVA on Average Share Price
A simple linear regression was performed to examine the impact of EVA on the Average Share Price for HUL. The model summary is provided in
Table 3.
Table 3. Regression Analysis examine the impact of EVA on Average Share Price.
Model | R | R Square | Adjusted R Square | Std. Error of the Estimate | Change Statistics |
R Square Change | F Change | df1 | df2 | Sig. F Change |
1 | .605a | .366 | .295 | 604.451693 | .366 | 5.189 | 1 | 9 | .049 |
b. Dependent Variable: Average Share Price
The correlation coefficient is 0.605, indicating a positive moderate relationship between EVA and average share price. With this R Square value of 0.366, it can be said that EVA explains around 36.6% of the variability in average share prices. The Adjusted R Square, which acknowledges these predictors, has a value of 0.295. The significant value of the model itself, Sig. F Change, is 0.049, so at the 0.05 level, the model would be statistically significant.
Additionally, the ANOVA table (
Table 4) shows the overall significance of the regression model.
Table 4. ANOVA: EVA and the Average Share Price.
Model | Sum of Squares | df | Mean Square | F | Sig. |
1 | Regression | 1895893.110 | 1 | 1895893.110 | 5.189 | .049b |
Residual | 3288256.641 | 9 | 365361.849 | | |
Total | 5184149.751 | 10 | | | |
b. Predictors: (Constant), EVA
The regression model is significant with an F value of 5.189 and a Sig. value of 0.049. This indicates that EVA has a statistically significant impact on the Average Share Price.
4.3. Relationship Between EVA and the Average Share Price
Table 5 presents the coefficients for the regression equation, indicating the relationship between EVA and the Average Share Price for HUL.
Table 5. Relationship between EVA and the Average Share Price.
Model | Unstandardized Coefficients | Standardized Coefficients | t | Sig. | 95.0% Confidence Interval for B |
B | Std. Error | Beta | Lower Bound | Upper Bound |
1 | (Constant) | -509.197 | 914.605 | | -.557 | .591 | -2578.178 | 1559.785 |
EVA | .482 | .211 | .605 | 2.278 | .049 | .003 | .960 |
The unstandardized coefficient value of the EVA is 0.482. It means for a unit increase in EVA, the Average Share Price increases by 0.482 units. Second, the t-value for EVA is 2.278 while the significance level is 0.049 hence EVA is a significant predictor for Average Share Price. The 95% confidence interval for the EVA coefficient ranged from 0.003 to 0.960, thereby ascertaining a positive relationship between EVA and the Average Share Price.
5. Discussion
From the regression analysis, the relationship between Economic Value Added and the Average Share Price of Hindustan Unilever Limited was worked out. The coefficient of correlation, R, was 0.605. This indicates that the relationship between EVA and average share prices is positive and fair. A higher EVA generally shows an increased share price of the company, therefore showing the value created by the company among its shareholders. The coefficient of determination with an R Square of 0.366 indicates that changes in EVA explain about 36.6 percent of HUL's Average Share Price variability, which shows very strong influence of EVA on the changes in share price of the company over some time. The whole regression model is statistically significant, since the F-statistic stands at 5.189, while the corresponding significance level, Sig. F Change, comes at 0.049. This proves that the relationship realized between EVA and Average Share Price could not have been a chance occurrence; hence, EVA has a place as an explanatory variable. In particular, the coefficient for EVA is 0.482, with its t-value at 2.278 and a significance level of 0.049. Then, this uses the evaluation of the importance of EVA as a forecaster for HUL share price. This means every unit rise in EVA, HUL's average share price will increase 0.482 units. The 95% confidence interval for this coefficient comes out to be 0.003 to 0.960, which puts a range within which the true effect of EVA upon average share prices is likely to fall, hence giving reliability to this estimate. The results simply show that, in general, EVA is one important determinant of Average Share Price for Hindustan Unilever Limited. EVA may be considered by investors and analysts as a meaningful measure to evaluate the financial performance of the firm and its relation to market valuation. This insight underlines how useful EVA could be in financial analysis, providing quantitative measures of value creation and impacts on shareholder value within the context of HUL's market performance.
6. Conclusion
The study aimed to examine the impact of EVA on the Average Share Price of Hindustan Unilever Limited over ten years. The analysis reveals a clear and positive association between EVA and the company's share price, suggesting that EVA plays a significant role in influencing market valuation. As a measure of value creation, EVA effectively captures the financial performance of the company and aligns well with shareholder interests. The findings indicate that changes in EVA are meaningfully reflected in the movement of share prices, highlighting its relevance for investors and financial analysts. Overall, the study supports the view that EVA is a reliable indicator of a firm's ability to generate shareholder value and can serve as a useful tool for evaluating corporate performance in the capital market. This reinforces the importance of value-based financial metrics in guiding investment decisions and strategic financial planning.
Abbreviations
EVA | Economic Value Added |
HUL | Hindustan Unilever Limited |
NSE | National Stock Exchange |
ROIC | Return on Invested Capital |
WACC | Weighted Average Cost of Capital |
NOPAT | Net Operating Profit After Taxes |
ANOVA | Analysis of Variance |
Conflicts of Interest
The authors declare no conflicts of interest.
References
| [1] |
Sabol, A., & Sverer, F. (2017). A review of the economic value added literature and application. UTMS journal of economics, 8(1), 19-27.
https://hdl.handle.net/10419/174163
|
| [2] |
Abraham, R., Harris, J., & Auerbach, J. (2017). Earnings yield as a predictor of return on assets, return on equity, economic value added and the equity multiplier. Modern Economy, 8(1), 10.
http://dx.doi.org/10.4236/me.2017.81002
|
| [3] |
Malichova, E., Durisova, M., & Tokarcikova, E. (2017). Models of application economic value added in automotive company. Transport problems, 12.
http://dx.doi.org/10.20858/tp.2017.12.3.9
|
| [4] |
Alsoboa, S. S. (2017). The Influence of Economic Value Added and Return on Assets on Created Shareholders Value: A Comparative Study in Jordanian Public Industrial Firms. International Journal of Economics and Finance, 9(4), 63.
https://doi.org/10.5539/Ijef.V9n4p63
|
| [5] |
Al-Awawdeh, H. A., & Kareem Al-Sakini, S. A. (2018). The Impact of Economic Value Added, Market Value Added and Traditional Accounting Measures on Shareholders’ Value: Evidence from Jordanian Commercial Banks. International Journal of Economics and Finance, 10(10), 40.
https://doi.org/10.5539/Ijef.V10n10p40
|
| [6] |
Johan, S. (2019). The Relationship Between Economic Value Added, Market Value Added, And Return On Cost Of Capital In Measuring Corporate Performance. Jurnal Manajemen Bisnis Dan Kewirausahaan, 2(1).
https://doi.org/10.24912/Jmbk.V2i1.4804
|
| [7] |
Taslim, F. A. (2018). The Influence of Economic Value Added and Market Value Added on Corporate Value. Russian Journal of Agricultural and Socio-Economic Sciences, 74(2), 90-98.
https://doi.org/10.18551/Rjoas.2018-02.10
|
| [8] |
Ahmad, I., Alam, M., & Yameen, M. (2019). A Study of Economic Value Added (Eva) & Market Value Added (Mva) Of Hindustan Petroleum Corporation Limited. Global Journal Of Economics And Business, 6(1), 225-237.
|
| [9] |
Renalita, P., & Tanjung, S. (2019). Analysis Of the Effect of Economic Value Added and Other Fundamental Factors of Share Returns. Epra International Journal of Multidisciplinary Research (Ijmr) Peer Reviewed Journal, 5(9).
|
| [10] |
Jankalová, M., & Kurotová, J. (2019). Sustainability Assessment Using Economic Value Added. Sustainability, 12(1), 318.
https://doi.org/10.3390/Su12010318
|
| [11] |
Subedi, M., & Farazmand, A. (2020). Economic Value Added (Eva) For Performance Evaluation of Public Organizations. Public Organization Review, 20(4), 613-630.
https://doi.org/10.1007/S11115-020-00493-2
|
| [12] |
Tikasari, N., & Surjandari, D. A. (2020). The Effect of Economic Value Added and Financial Performance on Stock Return. Saudi Journal of Business and Management Studies, 5(6), 343-352.
https://doi.org/10.36348/Sjbms.2020.V05i06.005
|
| [13] |
Satwiko, R., & Agusto, V. (2021). Economic Value Added, Market Value Added, Dan Kinerja Keuangan Terhadap Return Saham. Media Bisnis, 13(1), 77-88.
https://doi.org/10.34208/Mb.V13i1.956
|
| [14] |
Omneya, A.-K., Ashraf, S., & Eldin, B. B. (2021). Is Economic Value-Added Momentum (Eva Momentum) A Better Performance Measurement Tool? Evidence From Egyptian Listed Firms. American Journal of Industrial and Business Management, 11(03), 297-319.
https://doi.org/10.4236/Ajibm.2021.113019
|
| [15] |
Dobrowolski, Z., Drozdowski, G., Panait, M., & Babczuk, A. (2022). Can The Economic Value Added Be Used as The Universal Financial Metric? Sustainability, 14(5), 2967.
https://doi.org/10.3390/Su14052967
|
| [16] |
Tripathi, P. M., Chotia, V., Solanki, U., Meena, R., & Khandelwal, V. (2022). Economic Value-Added Research: Mapping Thematic Structure and Research Trends. Risks, 11(1), 9.
https://doi.org/10.3390/Risks11010009
|
Cite This Article
-
APA Style
Shah, P., Pandya, N. (2025). Analyzing Impact of Economic Value Added as a Measure of Financial Performance on Share Price: A Case Study of Hindustan Unilever Limited. International Journal of Accounting, Finance and Risk Management, 10(3), 144-151. https://doi.org/10.11648/j.ijafrm.20251003.13
 Copy
|
Copy
|
 Download
ACS Style
Shah, P.; Pandya, N. Analyzing Impact of Economic Value Added as a Measure of Financial Performance on Share Price: A Case Study of Hindustan Unilever Limited. Int. J. Account. Finance Risk Manag. 2025, 10(3), 144-151. doi: 10.11648/j.ijafrm.20251003.13
Copy
|
Download
AMA Style
Shah P, Pandya N. Analyzing Impact of Economic Value Added as a Measure of Financial Performance on Share Price: A Case Study of Hindustan Unilever Limited. Int J Account Finance Risk Manag. 2025;10(3):144-151. doi: 10.11648/j.ijafrm.20251003.13
Copy
|
Download
-
@article{10.11648/j.ijafrm.20251003.13,
  author = {Pragnesh Shah and Nishwa Pandya},
  title = {Analyzing Impact of Economic Value Added as a Measure of Financial Performance on Share Price: A Case Study of Hindustan Unilever Limited
},
  journal = {International Journal of Accounting, Finance and Risk Management},
  volume = {10},
  number = {3},
  pages = {144-151},
  doi = {10.11648/j.ijafrm.20251003.13},
  url = {https://doi.org/10.11648/j.ijafrm.20251003.13},
  eprint = {https://article.sciencepublishinggroup.com/pdf/10.11648.j.ijafrm.20251003.13},
  abstract = {Background: Economic Value Added (EVA), introduced by Stern Value Management in 1983, is recognized as a robust performance measure that incorporates the cost of capital to evaluate true economic profit. Unlike traditional accounting indicators, EVA emphasizes shareholder value creation and provides insights into market valuation. This study investigates the impact of EVA on the share price of Hindustan Unilever Limited (HUL), one of India’s leading FMCG companies. Methodology: The study is based on secondary data spanning 2013-14 to 2023-24, obtained from HUL’s annual reports and verified through financial databases such as NSE, Yahoo Finance, and Moneycontrol. EVA was computed using NOPAT, ROIC, and WACC, while the average share price was derived from opening and closing values. Statistical analysis included correlation, simple linear regression, and ANOVA to determine the relationship between EVA and share price performance. Results: Findings reveal a positive and statistically significant association between EVA and HUL’s average share price. The correlation coefficient (R = 0.605) indicates a moderate positive relationship. Regression results (R² = 0.366, β = 0.482, p = 0.049) confirm EVA as a significant predictor, explaining nearly 37% of the variation in share price. Despite minor fluctuations in EVA during certain years, the overall trend of rising EVA parallels the consistent growth in HUL’s market valuation, underscoring its role in long-term value creation. Conclusion: EVA emerges as a reliable indicator of financial performance and shareholder value in the Indian context. The study highlights its practical utility for investors, analysts, and corporate decision-makers, reinforcing the importance of value-based measures over conventional accounting metrics in strategic financial planning and investment analysis.
},
 year = {2025}
}
Copy
|
Download
-
TY  - JOUR
T1  - Analyzing Impact of Economic Value Added as a Measure of Financial Performance on Share Price: A Case Study of Hindustan Unilever Limited

AU  - Pragnesh Shah
AU  - Nishwa Pandya
Y1  - 2025/09/03
PY  - 2025
N1  - https://doi.org/10.11648/j.ijafrm.20251003.13
DO  - 10.11648/j.ijafrm.20251003.13
T2  - International Journal of Accounting, Finance and Risk Management
JF  - International Journal of Accounting, Finance and Risk Management
JO  - International Journal of Accounting, Finance and Risk Management
SP  - 144
EP  - 151
PB  - Science Publishing Group
SN  - 2578-9376
UR  - https://doi.org/10.11648/j.ijafrm.20251003.13
AB  - Background: Economic Value Added (EVA), introduced by Stern Value Management in 1983, is recognized as a robust performance measure that incorporates the cost of capital to evaluate true economic profit. Unlike traditional accounting indicators, EVA emphasizes shareholder value creation and provides insights into market valuation. This study investigates the impact of EVA on the share price of Hindustan Unilever Limited (HUL), one of India’s leading FMCG companies. Methodology: The study is based on secondary data spanning 2013-14 to 2023-24, obtained from HUL’s annual reports and verified through financial databases such as NSE, Yahoo Finance, and Moneycontrol. EVA was computed using NOPAT, ROIC, and WACC, while the average share price was derived from opening and closing values. Statistical analysis included correlation, simple linear regression, and ANOVA to determine the relationship between EVA and share price performance. Results: Findings reveal a positive and statistically significant association between EVA and HUL’s average share price. The correlation coefficient (R = 0.605) indicates a moderate positive relationship. Regression results (R² = 0.366, β = 0.482, p = 0.049) confirm EVA as a significant predictor, explaining nearly 37% of the variation in share price. Despite minor fluctuations in EVA during certain years, the overall trend of rising EVA parallels the consistent growth in HUL’s market valuation, underscoring its role in long-term value creation. Conclusion: EVA emerges as a reliable indicator of financial performance and shareholder value in the Indian context. The study highlights its practical utility for investors, analysts, and corporate decision-makers, reinforcing the importance of value-based measures over conventional accounting metrics in strategic financial planning and investment analysis.

VL  - 10
IS  - 3
ER  -
Copy
|
Download