Understanding rainfall variability and trends of historical rainfall data is crucial for decision-makers to take appropriate steps and interventions to avert the hazards posed by rainfall variations and variability, particularly extremes, in order to improve community adaptation and mitigation efforts in southern Ethiopia. The monthly rainfall data are obtained from FEWSNET website, of the years 1981–2022, are for six locations of 4x4 km grids. One grid point was selected from each of the seven homogenous rainfall zones using merged weather stations data and meteorological satellite measurements. Annual long term mean rainfall varies from 331.8 to 1324.3 mm/year across the region. The temporal variability and trends of annual and seasonal rainfall data at six homogenous rainfall zones in South Ethiopia are examined in this study. The results indicates high rainfall variability across most zones especially in the year 1997 was the wettest year while 1984 was the driest year. This study employed the Mann-Kendall test and Sen's slope estimator to analyze yearly and seasonal rainfall trends. The results indicate that the annual and Belg rainfall exhibit statistically insignificant decreasing trends in most of the zones however, Bega seasonal rainfall shows significant increasing trends. The study's findings can assist decision-makers in taking appropriate steps and interventions to deter the risks posed by rainfall variations and unpredictability, particularly extremes, in order to boost community adaptation and mitigation efforts in southern Ethiopia.
This is an Open Access article, distributed under the terms of the Creative Commons Attribution 4.0 International License (http://creativecommons.org/licenses/by/4.0/), which permits unrestricted use, distribution and reproduction in any medium or format, provided the original work is properly cited.
Rainfall Trend, Mann Kendall Trend, South Ethiopia, Homogenous Rainfall Zones
1. Introduction
Climate change is a global phenomenon, and its negative effects challenge individuals and can have series consequences for various important sectors on different major sectors of the world, including water resources, agriculture, energy and tourism
[6]
Benhamed, A., Osman, Y., Ben-Salha, O., & Jaidi, Z. (2023). Unveiling the Spatial Effects of Climate Change on Economic Growth: International Evidence. Sustainability (Switzerland), 15(10), 1–20.
The changing rainfall patterns and their impact on water supplies are significant climatic issues confronting mankind today. There are substantial evidence that rainfall changes are already occurring as a result of global warming
[8]
Diaz, H. F., Bradley, R. S., & Eischeid, J. K. (1989). Precipitation fluctuations over global land areas since the late 1800’s. Journal of Geophysical Research, 94(D1), 1195–1210.
. Various authors have suggested changes in the spatial and temporal variability and trends of rainfall patterns caused by climate change and climate variability at different spatial and temporal scales in Ethiopia.
[1]
Araro, K., Legesse, S. A. & Meshesha, D. T. 2020. Climate Change and Variability Impacts on Rural Livelihoods and Adaptation Strategies in Southern Ethiopia. Earth Systems and Environment. Springer International Publishing 4(1), 15–26.
reported an inter-annual and seasonal variability of rainfall and showing increasing trend at the Konso district. Moreover, the significant increasing trends were observed for mean annual maximum and minimum temperatures of Jinka, while rainfall showed a non-significant upward trend for the last 30 to 40 years.
The research area, South Ethiopia, is distinguished by two rainy seasons that occur as the ITCZ passes through its most southern point. The major rainfall season, March to May (Belg), amounts 100-200mm each month, followed by a lesser rainfall season from October to December (Bega).
This annual cycle is influenced by the movement of the Inter-Tropical Convergence Zone (ITCZ), which migrates between 15◦S and 15◦N between January and July respectively
[18]
Segele, Z.T. and Lamb, P. J. (2005) Characterization and Variability of Kiremt Rainy Season over Ethiopia. Meteorology and Atmospheric Physics, 89, 153-180.
. The passage of the ITCZ results in a bimodal rainfall pattern in southern Ethiopia, whereas a monomodal (mostly during Kiremt) pattern in northern Ethiopia.
Due to topography effect, rainfall is restricted to Ethiopia's east, southeast, and south during the Belg season (March-May). Low pressure above South Sudan causes moisture to flow from the Indian Ocean and Arabian Sea. During, October- December, the rainfall over Ethiopia southward retreat of Kiremt systems, and easterly perturbation that induce moisture and rain-bearing clouds from the coast of East Africa
[18]
Segele, Z.T. and Lamb, P. J. (2005) Characterization and Variability of Kiremt Rainy Season over Ethiopia. Meteorology and Atmospheric Physics, 89, 153-180.
, which exhibit similar rainfall characteristics with other eastern African sub-region.
This study investigated at the variability and trends of annual and seasonal rainfall in southern Ethiopia throughout the major and short rainy seasons of Belg (March to May) and Bega (October to December) from 1981 to 2021. Despite the fact that few studies have been undertaken on the seasonal rainfall trend and variability of a limited area of the region, there is still a gap that different research must address in the majority of South Ethiopia, where recurring droughts have left their footprints throughout the years.
2. Methodology
2.1. Study Area
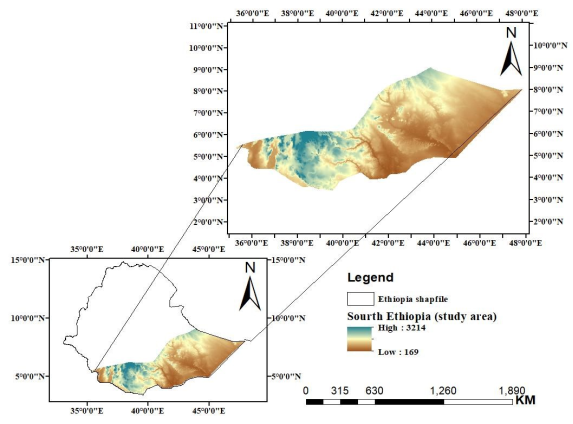
The location of the study area is located between 3.00N-8.70N and 35.40E-48.00E in Southern Ethiopia, bordering Kenya to the south and Somalia to the east and southeast. Southern Ethiopia includes the Southern Somali, Oromia, and South Ethiopia administrative areas.
Figure 1. Location map of study area (Southern Ethiopia).
2.2. Data Types and Sources
To reveal changes in climatic patterns and reliably identify rainfall trends, trend analysis necessitates long-term data collection. For this study CHIRPS monthly rainfall product that cover the period 1981–2021 obtained from FEWSNET website: (https://earlywarning.usgs.gov/fews/mapviewer/index.php?region=af).
The location of the rainfall data from each of six administrative zones is described in Table 1. Each rainfall location is represented a homogeneous zone of rainfall in the study area. Climate Hazard Group Infrared Precipitation with station data version 2 ITCZ (CHIRPSv 2) rainfall product data has been used for this research study. The US Geological Survey (USGS) and the Climate Hazards Group at the University of California, Santa Barbara (UCSB), developed it. The CHIRPS dataset is based on the infrared Cold Cloud Duration (CCD) concept, with more inputs (Climate Hazards Precipitation Climatology (CHPClim), TIR, CFSv 2 (climate forecasting system version 2), TRMM 3B 42, and in-situ precipitation observations from national and regional meteorological services) and higher spatial and temporal resolution. CHIRPS offers pentad and monthly precipitation products particularly developed for monitoring drought and environmental change over land
[10]
Funk, C., Peterson, P., Landsfeld, M., Pedreros, D., Verdin, J., Shukla, S., Husak, G., Rowland, J., Harrison, L., & Hoell, A. (2015). The climate hazards infrared precipitation with stations—a new environmental record for monitoring extremes. Scientific Data, 2(1), 1–21.
[10]
. CHIRPS products have been available at a spatial resolution of 0.05° over the quasi-global coverage of 50°N-50°S since 1981.
Table 1. Rainfall data and location in the research area.
Homogenous Rainfall Zone
Latitude
Longitude
Elevation (m)
Rainfall Data (year)
V
4.9
36.4
434
1981-2021
VI
6.04
38.59
2383
1981-2021
XII
4.33
38.77
1475
1981-2021
X
7.51
45.1
541
1981-2021
IX
7.5
41.6
1166.4
1981-2021
XI
4.75
41.1
887
1981-2021
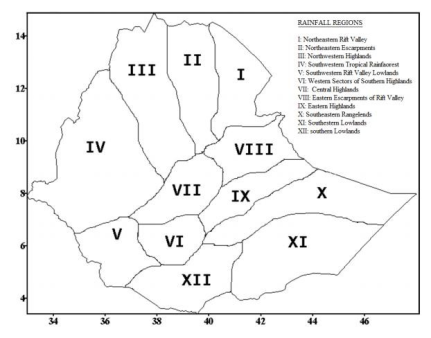
2.3. Homogeneous Rainfall Regions
Due to the inhomogeneity of precipitation over Ethiopia, several efforts have been made to divide Ethiopian into regions of homogenous rainfall
[9]
Diro, G. T., Black, E., & Grimes, D. I. F. (2008). Seasonal forecasting of Ethiopian spring rains. Meteorological Applications, 15(1), 73–83.
Korecha, D., and A. Sorteberg. "Construction of homogeneous rainfall regimes for Ethiopia." Int. J. Climatol 49 (2013): 7681-7697.
[9, 14]
. For this study, we adopt the work of
[14]
Korecha, D., and A. Sorteberg. "Construction of homogeneous rainfall regimes for Ethiopia." Int. J. Climatol 49 (2013): 7681-7697.
[14]
as working platform of homogeneous rainfall regimes. The rainfall data across Ethiopia was classified in to 12 homogeneous regions out of this south Ethiopia classified in to six zones by
[14]
Korecha, D., and A. Sorteberg. "Construction of homogeneous rainfall regimes for Ethiopia." Int. J. Climatol 49 (2013): 7681-7697.
Korecha, D., and A. Sorteberg. "Construction of homogeneous rainfall regimes for Ethiopia." Int. J. Climatol 49 (2013): 7681-7697.
[14]
).
3. Method of Data Analysis
3.1. Mann–Kendall Trend Test
In this research study, Mann-Kendall's test and Sen's slope estimator were used to determine annual and seasonal patterns of rainfall. Mann-Kendall’s test is a non-parametric method, which is less sensitive to outliers and tests for a trend in a time series without specifying whether the trend is linear or nonlinear
[11]
Hamid, A. T., Sharif, M., & Ahmed, M. L. (2013). Evaluation of trends in meteorological data of Delhi. Spec Issue Int J Sustainable Dev Green Econ, 2, 2315–4721.
[11]
. The nonparametric model Mann–Kendall test has been applied to the seasonal and the annual rainfall series to investigate the rainfall trends. For making statistical decision, the test statistics evaluated at the 5% (p =0.05) level of significance. i.e. Mann–Kendall test statistic is denoted by S and is computed using each pair of the observed valuesandof the random variable under consideration.
The trend analysis was conducted using the XLSTAT application within the MS Excel environment. The statistics for the Mann-Kendall test (S) are computed by the following statistical equations:
(1)
Where: n: numbers of data points,
(2)
means the individual sign capability that takes on the values [1, 0, or -1]. A positive S value implies an increasing trend, whereas a negative one implies a decreasing trend.
Nevertheless, the statistical analysis for the validity of the phenomenon needs to be carried out. The test procedure using the normal approximation test is described by
In the event where the x values are tied, the variance of S is given by:
Where m is the number of tied groups in the dataset and ti the number of data points in tied group. For larger than 10, ZMK approximates the standard normal distribution
[12]
Helsel, D. R., & Hirsch, R. M. (1993). Statistical methods in water resources. Elsevier.
[12]
and computed as follows:
=(4)
The presence of a statistically significant trend is assessed using the ZMK value. In a two-sided trend test, accept the null hypothesis Ho if /Z1MK/< Z1-α/2 at a certain level of significance. Z1-α/2 is the critical value of Zmk from the standard normal table. For 5% and 10% significance level, the value of Z1-α/ is 1.96 and 1.64 respectively. In MAKESENSE the tested significance level are 0.001, 0.01 and 0.1. MAKESENSE 1.0, which is primarily developed for detecting and estimate in trend in time series, was adopted in this study.
3.2. Sen's Slope Estimator
The magnitude of a trend in a time series can be determined using a nonparametric method known as Sen's estimator
[19]
Sen, P. K. (1968) Estimates of the Regression Coefficient Based on Kendall’s Tau. Journal of the American Statistical Association, 63, 1379-1389.
. Sen's nonparametric approach is used to estimate the true slope of an existing trend, such as the amount of change per year, and the test was carried out with the XLSTAT 2020 software.
A positive value of Sen's slope indicates an upward or increasing trend in the time series, whereas a negative value suggests a downward or declining trend. The slope (Ti) of all data pairs is calculated using Equation 5.
for i = 1, 2, 3, n(5)
Where,andare the data values at time j and k (j > k) respectively. Sen’s slope of estimation (true slope) represents the median of these n values ofis derived using equation 6.
=(6)
3.3. Standard Deviation
Measures of variability when analyzing the variability of rainfall, we must not overlook its variations in timescales of seasons to decades. The degree to which rainfall amounts vary across an area or over time is an important characteristic of the climate of an area. Common measures of variability, such as the standard deviation, may be interpreted based upon an assumption of an underlying standard normal distribution for the purpose of climate and weather analyses
[3]
Banacos, P. C. (2011). Box and whisker plots for local climate datasets interpretation and creation using Excel 2007/2010.
[3]
. A variety of variability measures were produced and examined to examine rainfall variability.
Rainfall variability can be described in absolute or relative terms
[11]
Hamid, A. T., Sharif, M., & Ahmed, M. L. (2013). Evaluation of trends in meteorological data of Delhi. Spec Issue Int J Sustainable Dev Green Econ, 2, 2315–4721.
[11]
. It is estimated by:
(7)
4. Result and Discussion
This study examines variations and changes in rainfall across South Ethiopia on annual, as well as main rainy season (Belg) and short rainy season (Bega) from 1981 to 2021.
4.1. Statistical Description of Annual Rainfall
4.1.1. Annual Rainfall
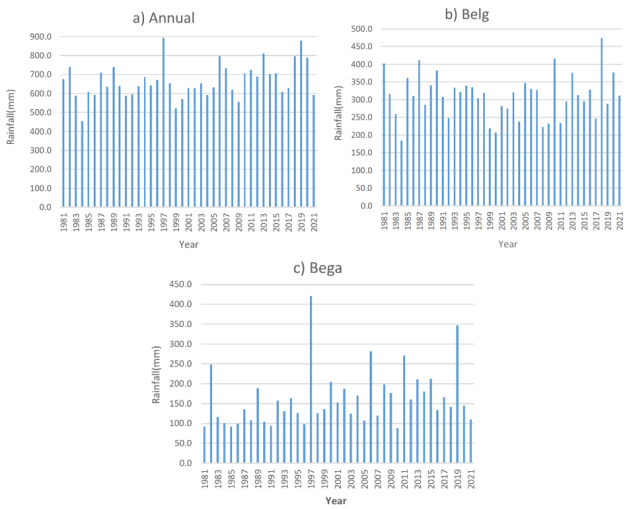
The analysis of the annual rainfall data from 1981 to 2021, the highest rainfall recorded in all five zones occurred in 1997, ranging between 558.9 and 1422.9mm. The maximum recorded rainfall in Zone V was 1422.9 mm, while in Zone IX it was 558.9 mm (Table 2).
The mean annual rainfall and standard deviation in this study are 1205.6mm/year and 122.0mm at zone VI, followed by XII (659.0 mm/year), 106.6 mm, XI (426.7 mm/year), 110.5, V (369.0 mm/year), 92.7mm, X (348.2 mm/year), 96.5 mm and IX (331.8 mm/year), 74.0 mm. Annual long term mean rainfall varies from 331.8 to 1205.6 mm/year across the region, which is the highest amounts of rainfall recoded at VI and XII zones. Which are found across western parts, whereas, the lowest amount recorded at IX and X (eastern parts of the study region) (Table 2). The long-term inter-annual variance of rainfall in this study is very high, which is highly corroborated by the findings of
[20]
Worku, M. A., Feyisa, G. L., & Beketie, K. T. (2022). Climate trend analysis for a semi-arid Borana zone in southern Ethiopia during 1981–2018. Environmental Systems Research, 11(1).
in eastern and southeastern Ethiopia from 1981 to 2009. The Standard Deviation at VI, and X and IX were 122.0, 96.4 and 74.0 mm/year respectively (table 2).
In general, the average annual rainfall in the research area decreases from west to east. This is because the region's altitude has fallen eastward, and low-altitude places normally receive less precipitation than high altitude.
[4]
BD, E., & Hutjis, R. (2015). Climate Change Impact and Adaptation in South Omo Zone, Ethiopia. Journal of Geology & Geophysics, 04(03).
discovered that when topography height was reduced by 50%, there was a definite drop in the amount of rainfall as well as a shift in the pattern of rainfall.
4.1.2. Belg Rainfall
The examination of the mean Belg rainfall showed the standard deviation between 61.7 and 87.3mm/season occurred V, VI and XII zones (western parts of the study areas) respectively, whereas 50.3 to 76.4mm/season were recorded at IX, X and XI (eastern parts the study areas) (Table 2). The research area's terrain causes this impact, with semi-arid areas in the west and arid areas in the east.
During the research period (1981-2021), Belg rainfall analysis showed that the highest rainfall occurred in the VI (658.1mm/season) in 2018, followed by XII at 573.9mm/season in 2018. The minimum amounts of rainfall of the annual and Belg in the study period recorded in 1984 at five zones out of six zones (Figure 3 (a and b)).
4.1.3 Bega Rainfall
Bega rainfall statistics (1981-2021) demonstrate a relatively lower rainfall amount across the entire zone than the major rainy season. The Bega mean rainfall ranges from 220.0 to 80.8mm/season with a standard deviation of 90.0mm at VI and 55.7 at IX (Table 2).
The range of maximum rainfall amount of the Bega was 447.0 to 256.2mm/season. The maximum rainfall of Bega at IX zone was 298.5 mm in 1997, while the lowest was 24.2 mm in 2003. The maximum rainfall of annual and Bega were recorded in 1997 across most zones (Figure 3 (a and b)). These results agreed with the study by
[7]
Conway, D. (2000). The Climate and Hydrology of the Upper Blue Nile River. The Geographical Journal, 166, 49-62.
indicates the October to February season rainfall in 1997-1998 was the wettest on record over much of Ethiopia and also parts of Somalia and Kenya in the season.
Table 2. Summary data of Belg and Bega seasonal rainfall (mm) at selected rainfall zones from 1981 to 2021.
Figure 3. Mean annual and seasonal rainfall distribution in South Ethiopia (1981-2021).
4.2. Annual and Seasonal Temporal Rainfall Trend Analysis
Table 2 shows the magnitudes of the Mann-Kendall test statistics (Z), S-slope, and P values.
When S- slope and Z values are positive, these indicate an upward trend, negative values indicate downward trend in the rainfall series. The Z value is used to assess the trend's significance at a p-value of less than 0.05. Table 2 shows the annual, major rainy season (Belg) and short rainy season (Bega) statistics for six rainfall homogeneous zones in South Ethiopia from 1981 to 2021.
4.2.1. Annual Rainfall Trend Analysis
The MK trend test revealed an increase in annual rainfall in five of the six zones. The Sen-slope and Kendall statistics test (Z) were positive, and Z value found between 0.44 to 3.54 and S-slope, 0.50 and 8.52, but not statistically significant trend. The V zone in the western parts of the research region showed p-values of 0.003, which are (p < 0.05). These factors contribute to statistically significant increasing of an annual rainfall (Table 2). However, at the IX zone, the slope of the Sen and the Z values of the Kendall statistics test were both zero. As a result, it was revealed that there was no detectable change in the data throughout the research time, indicating that everything remained consistent.
4.2.2. Bega Rainfall Trends
Table 2 summarizes the trend study of Bega seasonal rainfall in Southern Ethiopia. Rainfall was analyzed using the Z-values of the Kendall statistics test and the Sen's slope over zones throughout the study area. Over the research region, Bega rainfall increased in all zones with S-slopes of 0.3 - 2.1mm and z-values of 0.55-2.57. Among these zones, only IX and X zones showed a statistically insignificant increasing trend (p>0.05).
4.2.3. Belg Rainfall Trends
The trend study of Belg rainfall found that five out of seven zones had a declining tendency, while just one zone (V) had an increasing trend, with none statistically significant (p>0.05) (Table 2). The findings are comparable with those of other research that found a non-significant increasing trend in annual rainfall over South Ethiopia
[5]
Belay, A., Demissie, T., Recha, J. W., Oludhe, C., Osano, P. M., Olaka, L. A., Solomon, D., & Berhane, Z. (2021). Analysis of climate variability and trends in Southern Ethiopia. Climate, 9(6), 1–17.
Ayal, D. Y., Radeny, M., Desta, S., & Gebru, G. (2018). Climate variability, perceptions of pastoralists and their adaptation strategies: Implications for livestock system and diseases in Borana zone. International Journal of Climate Change Strategies and Management, 10(4), 596–615.
demonstrated that there was a decline in annual and Belg rainfall at semi-arid, XII zone between 1980 and 2010.
[16]
Mulugeta, S., Fedler, C., & Ayana, M. (2019). Analysis of long-term trends of annual and seasonal rainfall in the Awash River Basin, Ethiopia. Water (Switzerland), 11(7).
found a non-significant trend of decreasing annual rainfall in the Awash River basin (1902-2016). Moreover,
[20]
Worku, M. A., Feyisa, G. L., & Beketie, K. T. (2022). Climate trend analysis for a semi-arid Borana zone in southern Ethiopia during 1981–2018. Environmental Systems Research, 11(1).
found no significant declining trend during the Bega season (1981-2017) in Ethiopia's Amhara region.
Table 3. Mann-Kendal annual and seasonal rainfall trend and Sen Slope for selected rainfall homogenous zones (1981–2021).
Zones
Variable
Z
p-value
Sen's slope
VI
Annual rainfall
1.45
0.15
2.70
Belg rainfall
-0.44
0.66
-0.60
Bega rainfall
2.21
0.03
2.05
IX
Annual rainfall
0
1.00
-0.00
Belg rainfall
-1.29
0.20
-0.93
Bega rainfall
0.66
0.51
0.35
XI
Annual rainfall
1.13
0.26
1.50
Belg rainfall
-0.86
0.39
-1.06
Bega rainfall
2.35
0.02
1.82
X
Annual rainfall
0.44
0.66
0.50
Belg rainfall
-0.62
0.54
-0.58
Bega rainfall
1.52
0.13
0.86
XII
Annual rainfall
1.65
0.099
2.12
Belg rainfall
-0.46
0.65
-0.42
Bega
2.44
0.015
1.72
V
Annual
2.98
0.003
3.56
Belg
0.999
0.312
0.85
Bega
2.57
0.010
1.45
5. Conclusion
The present study analyzed the six rainfall homogenous zones across South Ethiopia. The analysis of the time series was carried out using description of statistical analysis, Mann-Kendall nonparametric test and Sen’s slope, which are widely-used tests for conducting trend analyses of meteorological data.
Relatively maximum amount of annual rainfall observed in 1997, while minimum in 1884, the variability is more or less the same for both seasons when compared to the seasons.
A total of six zones rainfall data were analyzed for trends. The analysis found an increasing trend in annual rainfall from 1981-2021, but a decreasing trend in V zone in the western parts of research region. On the other hand, rainfall trend analysis of Belg season have shown opposite with annual rainfall across all zones. However, in Belg season the trend analysis indicated statistically insignificant across all zones. The Bega rainfall showed significant increasing trends across all zones but the statistical significance level at 95% only at five zones. A more detailed analysis is essential using observed rainfall data for longer periods to confirm or reject the presence of linkages between the changes in the patterns of rainfall and climate indices.
Abbreviations
ITCZ
Inter Tropical Convergence Zone
CHIRPSv 2
Climate Hazard Group Infrared Precipitation with Station Data Version 2
USGS
United State Geological Survey
UCSB
University of California, Santa Barbara
CCD
Cold Cloud Duration
CHPClim
Climate Hazards Precipitation Climatology
TIR
Thermal Infrared
CFSv 2
Climate Forecasting System Version 2
TRMM
Tropical Rainfall Measuring Mission
Acknowledgments
We would like to thank the FEWSNET for allowed us free accesses invaluable raw data.
Author Contributions
Chali Debele Gurji is the only author. The author read and approved the final manuscript.
Funding
For the study presented, the authors received no support from any organization.
Data Availability Statement
Statement Meteorological data for this study were obtained from FEWSNET website.
Conflicts of Interest
The author declares no conflicts of interest.
References
[1]
Araro, K., Legesse, S. A. & Meshesha, D. T. 2020. Climate Change and Variability Impacts on Rural Livelihoods and Adaptation Strategies in Southern Ethiopia. Earth Systems and Environment. Springer International Publishing 4(1), 15–26.
Ayal, D. Y., Radeny, M., Desta, S., & Gebru, G. (2018). Climate variability, perceptions of pastoralists and their adaptation strategies: Implications for livestock system and diseases in Borana zone. International Journal of Climate Change Strategies and Management, 10(4), 596–615.
Belay, A., Demissie, T., Recha, J. W., Oludhe, C., Osano, P. M., Olaka, L. A., Solomon, D., & Berhane, Z. (2021). Analysis of climate variability and trends in Southern Ethiopia. Climate, 9(6), 1–17.
Benhamed, A., Osman, Y., Ben-Salha, O., & Jaidi, Z. (2023). Unveiling the Spatial Effects of Climate Change on Economic Growth: International Evidence. Sustainability (Switzerland), 15(10), 1–20.
Diaz, H. F., Bradley, R. S., & Eischeid, J. K. (1989). Precipitation fluctuations over global land areas since the late 1800’s. Journal of Geophysical Research, 94(D1), 1195–1210.
Funk, C., Peterson, P., Landsfeld, M., Pedreros, D., Verdin, J., Shukla, S., Husak, G., Rowland, J., Harrison, L., & Hoell, A. (2015). The climate hazards infrared precipitation with stations—a new environmental record for monitoring extremes. Scientific Data, 2(1), 1–21.
[11]
Hamid, A. T., Sharif, M., & Ahmed, M. L. (2013). Evaluation of trends in meteorological data of Delhi. Spec Issue Int J Sustainable Dev Green Econ, 2, 2315–4721.
[12]
Helsel, D. R., & Hirsch, R. M. (1993). Statistical methods in water resources. Elsevier.
Mulugeta, S., Fedler, C., & Ayana, M. (2019). Analysis of long-term trends of annual and seasonal rainfall in the Awash River Basin, Ethiopia. Water (Switzerland), 11(7).
Segele, Z.T. and Lamb, P. J. (2005) Characterization and Variability of Kiremt Rainy Season over Ethiopia. Meteorology and Atmospheric Physics, 89, 153-180.
Worku, M. A., Feyisa, G. L., & Beketie, K. T. (2022). Climate trend analysis for a semi-arid Borana zone in southern Ethiopia during 1981–2018. Environmental Systems Research, 11(1).
Gurji, C. D. (2025). Assessing the Trends and Variabilities of Seasonal and Annual Rainfall Across South Ethiopia. International Journal of Atmospheric and Oceanic Sciences, 9(1), 70-77. https://doi.org/10.11648/j.ijaos.20250901.18
Gurji, C. D. Assessing the Trends and Variabilities of Seasonal and Annual Rainfall Across South Ethiopia. Int. J. Atmos. Oceanic Sci.2025, 9(1), 70-77. doi: 10.11648/j.ijaos.20250901.18
Gurji CD. Assessing the Trends and Variabilities of Seasonal and Annual Rainfall Across South Ethiopia. Int J Atmos Oceanic Sci. 2025;9(1):70-77. doi: 10.11648/j.ijaos.20250901.18
@article{10.11648/j.ijaos.20250901.18,
  author = {Chali Debele Gurji},
  title = {Assessing the Trends and Variabilities of Seasonal and Annual Rainfall Across South Ethiopia
},
  journal = {International Journal of Atmospheric and Oceanic Sciences},
  volume = {9},
  number = {1},
  pages = {70-77},
  doi = {10.11648/j.ijaos.20250901.18},
  url = {https://doi.org/10.11648/j.ijaos.20250901.18},
  eprint = {https://article.sciencepublishinggroup.com/pdf/10.11648.j.ijaos.20250901.18},
  abstract = {Understanding rainfall variability and trends of historical rainfall data is crucial for decision-makers to take appropriate steps and interventions to avert the hazards posed by rainfall variations and variability, particularly extremes, in order to improve community adaptation and mitigation efforts in southern Ethiopia. The monthly rainfall data are obtained from FEWSNET website, of the years 1981–2022, are for six locations of 4x4 km grids. One grid point was selected from each of the seven homogenous rainfall zones using merged weather stations data and meteorological satellite measurements. Annual long term mean rainfall varies from 331.8 to 1324.3 mm/year across the region. The temporal variability and trends of annual and seasonal rainfall data at six homogenous rainfall zones in South Ethiopia are examined in this study. The results indicates high rainfall variability across most zones especially in the year 1997 was the wettest year while 1984 was the driest year. This study employed the Mann-Kendall test and Sen's slope estimator to analyze yearly and seasonal rainfall trends. The results indicate that the annual and Belg rainfall exhibit statistically insignificant decreasing trends in most of the zones however, Bega seasonal rainfall shows significant increasing trends. The study's findings can assist decision-makers in taking appropriate steps and interventions to deter the risks posed by rainfall variations and unpredictability, particularly extremes, in order to boost community adaptation and mitigation efforts in southern Ethiopia.
},
 year = {2025}
}
TY  - JOUR
T1  - Assessing the Trends and Variabilities of Seasonal and Annual Rainfall Across South Ethiopia

AU  - Chali Debele Gurji
Y1  - 2025/06/25
PY  - 2025
N1  - https://doi.org/10.11648/j.ijaos.20250901.18
DO  - 10.11648/j.ijaos.20250901.18
T2  - International Journal of Atmospheric and Oceanic Sciences
JF  - International Journal of Atmospheric and Oceanic Sciences
JO  - International Journal of Atmospheric and Oceanic Sciences
SP  - 70
EP  - 77
PB  - Science Publishing Group
SN  - 2640-1150
UR  - https://doi.org/10.11648/j.ijaos.20250901.18
AB  - Understanding rainfall variability and trends of historical rainfall data is crucial for decision-makers to take appropriate steps and interventions to avert the hazards posed by rainfall variations and variability, particularly extremes, in order to improve community adaptation and mitigation efforts in southern Ethiopia. The monthly rainfall data are obtained from FEWSNET website, of the years 1981–2022, are for six locations of 4x4 km grids. One grid point was selected from each of the seven homogenous rainfall zones using merged weather stations data and meteorological satellite measurements. Annual long term mean rainfall varies from 331.8 to 1324.3 mm/year across the region. The temporal variability and trends of annual and seasonal rainfall data at six homogenous rainfall zones in South Ethiopia are examined in this study. The results indicates high rainfall variability across most zones especially in the year 1997 was the wettest year while 1984 was the driest year. This study employed the Mann-Kendall test and Sen's slope estimator to analyze yearly and seasonal rainfall trends. The results indicate that the annual and Belg rainfall exhibit statistically insignificant decreasing trends in most of the zones however, Bega seasonal rainfall shows significant increasing trends. The study's findings can assist decision-makers in taking appropriate steps and interventions to deter the risks posed by rainfall variations and unpredictability, particularly extremes, in order to boost community adaptation and mitigation efforts in southern Ethiopia.

VL  - 9
IS  - 1
ER  -
 In the event where the x values are tied, the variance of S is given by: