1. Introduction
Pakistan's Social Safety Net Programme (SSNP) is an ongoing national endeavor dedicated to alleviating poverty and fostering social harmony. This is achieved by strategically redistributing resources to the most vulnerable and disadvantaged segments of society. The SSNP employs a multifaceted approach, utilizing both direct cash transfers and a range of other essential services. These interventions are supported through budgetary allocations, encompassing significant programs such as the Benazir Income Support Programme (BISP), Pakistan Bait-ul-Mal (PBM), and Social Security & Welfare initiatives. Complementing these are non-budgetary components like the Pakistan Poverty Alleviation Fund (PPAF), as well as crucial services provided through Zakat, the Employees Old-age Benefit Institution (EOBI), and the Workers Welfare Fund (WWF)
. Furthermore, the programme recognizes the vital role of microfinance, facilitated through specialized financial institutions, in empowering the needy poor with access to financial resources. Safety net cash transfer programs are highly effective, serving two key purposes. First, they enable countries to invest in their human capital by supporting vulnerable populations. Second, and crucially, they deliver direct financial aid to impoverished individuals, leading to a tangible improvement in their quality of life. As of today, these vital programs reach approximately 2.5 billion people, with a significant impact on the most vulnerable, covering around 650 million people, or 56% of the world's poorest quintile.
. The Benazir Income Support Programme (BISP) stands as a federal unconditional cash transfer initiative, serving as a key pillar of the Government of Pakistan's social safety net. Beyond immediate poverty alleviation, BISP is strategically designed with long-term objectives aligned with the Sustainable Development Goals (SDGs), specifically targeting the eradication of extreme and chronic poverty while simultaneously fostering the empowerment of women across the nation
. Furthermore, limited cash transfers received through these programs force them to utilize the transfers largely for living expenses. Increased financing of SSN will not only increase the coverage of the programs but will also help improve living and health 4 outcomes, which are essential for the sustainable welfare system in Pakistan.
| [2] | Ali, G., & Hussain, E. (2020). Perspectives on Contemporary Pakistan. Routledge. |
[2]
Addressing long-term socioeconomic and climatic stability and investments in children's physical, mental, and social well-being are essential, given Pakistan's serious undernutrition crisis. In 2018, over 38% of Pakistani children were stunted, 7% were wasted, and 23% were underweight. In 2017–18, the prevalence of stunting, wasting, and underweight was 30%, 4%, and 14% in the Punjab, the largest province in the nation by population and GDP share. In terms of the prevalence of stunting, wasting, and underweight children, predicted probabilities suggest that rural Punjab is substantially better off than urban Punjab, and, surprisingly, girls are better off than boys
| [8] | Gul, R., Khan, S. S., Mazhar, S., & Tahir, T. (2020). Influence of logical and spatial intelligence on teaching pedagogies of secondary school teachers. Humanities & Social Sciences Reviews, 8(6), 01-09. |
[8]
. Analyze the effectiveness of the government's two most significant social welfare programs in Pakistan, the Sehat Sahulat (SSP) Program and the Benazir Income Support Program (BISP), to reduce poverty and improve health outcomes. Although BISP has produced favorable results, including a decrease in waste (especially among females) and an increase in food consumption, it may even be inefficient since it lacks adequate health.
| [9] | Tariq, I., Aslam, T., & Khan, M. A. (2021). Impact of selected social welfare programs on poverty alleviation and health outcomes in Pakistan. Journal of Humanities, Social and Management Sciences (JHSMS), 2(1), 214-232. |
[9]
. The high rates of malnutrition in Pakistan (40.2% stunting, 28.9% underweight, and 17.7% wasting) are a sign of a persistent problem with child nutrition. Pakistan is the second-highest burden country in the area for malnutrition due to these levels. A child's first 1,000 days of life provide a window of opportunity to build a solid foundation for future success. The child's neurological development is characterized by a high degree of flexibility throughout this time, which is characterized by significant change.
| [4] | Aslam, M., & Li, Z. (2024). A MULTINOMIAL APPROACH FOR ORGANIC AGRICULTURAL PRODUCTION PRACTICES ADOPTION VIS-À-VIS SOCIO-ECONOMIC AND ICT DETERMINANTS. JAPS: Journal of Animal & Plant Sciences, 34(3). |
[4]
corroborates the associations of child undernutrition in Pakistan with risk factors such as poverty, poor maternal nutrition, food insecurity, and relatively small size at birth. They also suggest that over time, gradual warming and changes in precipitation could also be contributing to slower linear growth, stunting, and wasting in the country.
| [12] | Hassan, T., & Bibi, N. (2016). To Assess the Benazir Income Support Programme in Achieving in Achieving Food Security. International Journal of Pure and Applied Management Sciences, Volume 1(1) (2016). |
[12]
Hassan & Bibi (2016) attempted to measure the role of BISP cash assistance in achieving food security by using primary data for Barikot, district Swat, KPK. Positive impacts were found on certain food items, i.e. wheat, sugar, milk and vegetable consumption. Stunting has been linked to a higher probability of mortality and morbidity, as well as poor cognitive growth, school performance, learning capacity, job capacity, and work efficiency. The rate of stunting in children has declined by only 0.5% in Pakistan, which is very low. The multi-sector method tackles multiple variables that contribute to stunting, including ineffective intervention programs. To avoid malnutrition and stunting in Pakistani children, it is critical to launch cost-effective tiered interventions at pre-conception pregnancy and early postpartum phases.
| [1] | Ali, A. (2021). Current Status of Malnutrition and Stunting in Pakistani Children: What Needs to Be Done? Journal of the American College of Nutrition, 40(2), 180-192. |
[1]
In Pakistan, inadequate nutrition is fairly prevalent among communities and is a significant issue.
| [20] | Shuja, S., Ategbo, E. A., Ihtesham, Y., & Ahmed, K. M. (2020). Wasting prevention and treatment-central to stunting reduction in Pakistan. Field Exchange 63, 17. |
[20]
Children and women of reproductive age experience significant effects from undernutrition, Obesity or overweight, stunting and wasting, and nutritional deficits in combination or across the nation. After Nigeria, India, and Pakistan have the most children who are stunted. More than 40% of young children are stunted. Children, 12 million of whom 17.7% are stunted, 2.5 million are thought to be severely wasted children under the age of five (Government of Pakistan, 2018). Pakistan was one of the first nations to formally ratify the Sustainable Development Goals, which aim to eliminate stunting in children fewer than five by 40% and keep childhood malnutrition below 5%. There has been a modest there has been an increase in the prevalence of wasting (18% in 2018) compared to 1990 levels (12.5%), as well as a minor decrease in the frequency of stunting since in the year 2001 an average yearly reduction rate of around 0.4% in the prevalence of wasting (18% in 2018) compared to 1990 levels (12.5%) and a slight decline in the frequency of stunting since 2001 (an average annual reduction rate of roughly 0.4%) progress is slow and Pakistan is still far from attaining these goals. (Government of Pakistan, 2018).
To the best of our knowledge, processing (i.e., Impact evaluation on BISP in the context of SDGs 3 Good health and social well-being in terms of achieving sustainable development goals has not been included in any of the available studies. Studies have been focused on
| [11] | Jahangeer, A., Zaidi, S., Das, J., & Habib, S. (2020). Do recipients of cash transfer scheme make the right decisions on household food expenditure? A study from a rural district in Pakistan. JPMA, 70(5), 796-802. |
[11]
analyzing the effectiveness of health outcomes and poverty alleviation of social welfare in Pakistan.
| [10] | Jamil, M. (2024). Impacts of the Benazir Income Support Program on Poverty Alleviation in District Swat. Review of Law and Social Sciences, 2(3), 15-22. |
[10]
Evaluate the therapeutic value of particular nutritional supplementation food SNF without cash transfers, UCTs social behavior change communication, and its distribution to BISP recipients to prevent stunting in children between the ages of 6 and 23 months.
| [13] | Iqbal, T., Padda, I. U. H., & Farooq, S. (2020). Sustainable impacts of social safety nets: The Case of BISP in Pakistan. Pakistan Journal of Applied Economics, 30(2), 153-180. |
[13]
Assessed beneficiaries of the BISP on monthly food commodities and the cash incentive project impact on the purchase of nutritious foods
| [21] | Soofi, S. B., Ariff, S., Khan, G. N., Habib, A., Kureishy, S., Ihtesham, Y., & Bhutta, Z. A. (2022). Effectiveness of unconditional cash transfers combined with lipid based nutrient supplement and/or behavior change communication to prevent stunting among children in Pakistan: a cluster randomized controlled trial. The American Journal of Clinical Nutrition, 115(2), 492-502. |
[21]
. Hypothesized without conditional cash transfer (UCTs) in addition to the lipid nutrition supplement LNS and social behavioral change communication (SBCC), preventing stunting among children 6-23 months. Moreover, it was not generally possible to evaluate the impact evaluation on BISP in the context of achieving SDG 3 Good health and social well-being, especially targeted stunting and wasting among 0-less under years.
Our research has a positive impact on scholars and governance. On the side of learning, it will perform a comprehensive statistical panel study in areas where no previous research has investigated the effects of the child deprivation index. In terms of policy, the findings will aid in rethinking the promotion of health in Pakistan and the role of SSN. The study would also assist policymakers and researchers in understanding how social safety nets might be employed in Pakistan to promote and achieve the SDGs.
3. Literature Review
Benazir Income Support Program (BISP) strategically prioritizes women as direct recipients of cash transfers, recognizing the well-established evidence that empowering women financially yields significant and far-reaching benefits for the entire family, demonstrably improving household consumption patterns and fostering better educational and health outcomes for children
| [13] | Iqbal, T., Padda, I. U. H., & Farooq, S. (2020). Sustainable impacts of social safety nets: The Case of BISP in Pakistan. Pakistan Journal of Applied Economics, 30(2), 153-180. |
[13]
. The BISP program has effectively served as a crucial safety net, demonstrably lessening the adverse effects of poverty on vulnerable households and bolstering their resilience against unforeseen crises. Its successful implementation has yielded significant positive changes across various aspects of beneficiaries' lives, including increased consumption and improved dietary intake, enhanced child nutrition and food security, greater ability to retain assets, increased mobility for women, more investment in health and education, and a strengthened capacity for savings (World Bank, 2024).
A study assessed the 421 households that participated in the poll with a quarterly food expenditure of PRs 7,577 on average. In only 135 (32%) of the families were the primary decision-makers for food purchases. Similarly, in a total of 56% of the HH, when it came to choosing options about cash grant purchases, women prevailed
| [14] | Shah, N., Zaheer, S., & Iram, U. (2024). Health insurance, social safety net and maternal health service utilisation in Pakistan: a population based cross-sectional study. BMJ open, 14(8), e079646. |
[14]
. Despite having a significant impact on boosting women's autonomy without conditional cash grants did not significantly translate into the purchasing of nutrient dense foods
| [17] | Mustafa, G., Iqbal, N., & Rehman, F. U. (2022). Evaluating the Short Run and Long Run Impacts of Unconditional Cash Transfers on Food-Seeking Behaviour: New Insights from BISP, Pakistan. The Pakistan Development Review. |
[17]
Analyzed the Benazir Income support program as a source of Increasing financing of social safety nets not and be advantageous in terms of boosting education and health results, all of which are required for Pakistan to create an effective and environmentally friendly welfare system.
| [15] | Mumtaz, Z., & Whiteford, P. (2017). Social safety nets in the development of a welfare system in Pakistan: an analysis of the Benazir Income Support Programme. Asia Pacific Journal of Public Administration, 39(1), 16-38. |
[15]
Assessed that the cash transfer of the BISP has a significant impact on HH consumption. However, the benefits of households facing Quarterly cash aid impacts on the MPI (Multidimensional Poverty Index) and CDI (Child Deprivation Index) are not significant in cross-sectional research, indicating high rates of poverty and no persistent impact.
The work investigates the BISP's selecting and targeting strategies, the consequences of the BISP's distribution of money on health and academic achievement in poverty
| [15] | Mumtaz, Z., & Whiteford, P. (2017). Social safety nets in the development of a welfare system in Pakistan: an analysis of the Benazir Income Support Programme. Asia Pacific Journal of Public Administration, 39(1), 16-38. |
[15]
. As well as limited financial resources and political will are the major constraints to investment in social protection programs. There is a need for Social Protection programs, and 27 develops a well-designed and effective welfare system in the country
| [3] | Amjad, Z. S., Mustafa, U., & Farooq, S. (2018). Targeting and effectiveness of social safety net programs: the case of Zakat and BISP in Pakistan. Nust Journal of Social Sciences and Humanities, 4(2), 134-167. |
[3]
. Made a comparison of Zakat & BISP to evaluate the effectiveness of both programs on consumption head count poverty and MPI (Multidimensional Poverty Index)
| [15] | Mumtaz, Z., & Whiteford, P. (2017). Social safety nets in the development of a welfare system in Pakistan: an analysis of the Benazir Income Support Programme. Asia Pacific Journal of Public Administration, 39(1), 16-38. |
[15]
. Intends to contrast the planning and implementation of BISP with other well-known SSNs all over the world. Using the current studies, they investigate the impact of BISP transfers of cash on poverty, health education, and livelihood. Previous studies have established health insurance schemes and social safety net programs as a source of financial protection, ensuring inclusion and equity, enhancing well-being, and shielding families from financial catastrophe
| [16] | Khan, G. N., Kureishy, S., Ariff, S., Habib, M. A., Usmani, A. A., Mubarak, A., & Soofi, S. B. (2020). Specialized nutritious food combined with cash transfers and social and behavior change communication to prevent stunting among children aged 6 to 23 months in Pakistan: protocol for a cluster randomized controlled trial. JMIR Research Protocols, 9(8). |
[16]
.
| [17] | Mustafa, G., Iqbal, N., & Rehman, F. U. (2022). Evaluating the Short Run and Long Run Impacts of Unconditional Cash Transfers on Food-Seeking Behaviour: New Insights from BISP, Pakistan. The Pakistan Development Review. |
[17]
analyzed SSNs in developing countries like Domestic restrictions limit the spread of social safety net programs in Pakistan, which is seen as an efficient approach for combating poverty and boosting education and health. However, the minimal financial transfers that these programs provide require households to use the payments primarily for urgent living expenses and expenditure on strengthening educational and health requirements. Furthermore, Increased funding for SSN will not only expand program coverage but will also improve education and health results
| [14] | Shah, N., Zaheer, S., & Iram, U. (2024). Health insurance, social safety net and maternal health service utilisation in Pakistan: a population based cross-sectional study. BMJ open, 14(8), e079646. |
[14]
. There is a linkage between the health system and social protection programs, but research in this field has focused on a few areas.
3.1. Sustainable Development Goals and Social Safety Net
The Sustainable Development Goals provide an expansion of research in this field and coordinate funding for research with the demands of researchers and policymakers.
| [5] | Azeem, M. M., Mugera, A. W., & Schilizzi, S. (2019). Do social protection transfers reduce poverty and vulnerability to poverty in Pakistan? Household-level evidence from Punjab. The Journal of Development Studies, 55(8), 1757-1783. (Annika Kjellgren, 2014). |
[5]
revealed the results that social protection has a good influence on lowering family poverty and vulnerability to poverty, and this benefit is mostly driven by short-term flood relief cash transfer programs or government employees’ pensions, as well as families' frequent purchases from utility store networks.
| [21] | Soofi, S. B., Ariff, S., Khan, G. N., Habib, A., Kureishy, S., Ihtesham, Y., & Bhutta, Z. A. (2022). Effectiveness of unconditional cash transfers combined with lipid based nutrient supplement and/or behavior change communication to prevent stunting among children in Pakistan: a cluster randomized controlled trial. The American Journal of Clinical Nutrition, 115(2), 492-502. |
[21]
conducted a study on Sustainable Development Goal 1 intends to alleviate poverty through social safety nets. Highlighted the Ehsaas program, which includes various initiatives that are beneficiaries for millions of households and poor 26 families in Pakistan. Furthermore, spending under each social safety net also included the Livelihood Enhancement Program (LEP) which is the major poverty alleviation initiative under the Ehsaas program. The outcome of the study is that Khyber Pakhtunkhwa and Baluchistan provinces getting beneficiaries, assets and skills pieces of training. They are helpful in boosting incomes and a great strategy to give families in need access to more opportunities.
3.2. Social Safety Net Are Accessible in Underdeveloped Nations
Deal with social safety net programs reach the poor and disabilities in developing countries they also emphasize on inclusion of social safety nets and the relationship between disability poverty and SSN
| [22] | Javed, A., Lee, C., Zakaria, H., Buenaventura, R. D., Cetkovich-Bakmas, M., Duailibi, K,. & Azeem, M. W. (2021). Reducing the stigma of mental health disorders with a focus on low-and middle-income countries. Asian journal of psychiatry, 58, 102601. |
[22]
. They were targeted on the challenges and advantages of disabilities
| [23] | Mitra, S. (2005). Disability and social safety nets in developing countries. Mitra, S. (2006), Disability and Social Safety Nets in Developing Countries, International Journal of Disability Studies, 2(1), 43-88. |
[23]
. The World Bank report identified five hundred and eighty-nine programs in 149 developing countries’ economies out of one hundred and fifty-seven surveyed of which one hundred thirty-nine have detailed program levels based on the number of recipients.
| [19] | Saleem, J., Zakar, R., Bukhari, G. M. J., Fatima, A., & Fischer, F. (2021). Developmental delay and its predictors among children under five years of age with uncomplicated severe acute malnutrition: a cross-sectional study in rural Pakistan. BMC Public Health, 21(1), 1-10. |
[19]
assessed the prevalence of suspected developmental delay and their predictors in children under the age of 5 years with uncomplicated severe acute malnutrition in underdeveloped areas of Pakistan.
| [27] | Glewwe, P. (2002). Schools and skills in developing countries: education policies and socioeconomic outcomes. Journal of economic literature, 40(2), 436-482. |
[27]
estimated the reverse causality is that teenage girls in developing countries who become pregnant typically drop out of school.
On average a developing program runs 20 SSN programs. Cash transfer and Programs for school meals are prominent all most all countries. All over the world almost 1.9 million people enrolled in the SSN program. Cash transfer and conditional cash transfer have become more complex in 64 countries it dramatically increased in 2008. SSN programs and Transfers are examples of programs 29 that fall under the authority of social safety nets, as well as probable overlap with other components of social security.
4. Data Description
To investigate the impact of BISP’s unconditional cash assistance on selected welfare indicators, we have used BISP’s Impact Evaluation Panel Survey conducted by Oxford Policy Management (OPM). The panel survey was designed to gauge BISP cash assistance’s impacts on a variety of indicators, including per adult equivalent monthly consumption, headcount poverty, multidimensional poverty index (MPI), nutrition, livelihood, assets, saving, and women’s empowerment. The evaluation survey was typically designed to gauge impacts where a baseline was established in 2011 (right before intervention) by surveying both the beneficiary and non-beneficiary households. After 2 years of intervention, a series of follow-up rounds were conducted in 2013, 2014 and 2016 to gauge the impacts of the intervention. The current research has used only the baseline and the 2016 round, as sufficient time passed after the intervention until 2016; thus, one can expect interventions to have socio-economic impacts.
The baseline survey was conducted from 8,675 households in all four provinces of Pakistan. Since impact evaluation requires robust treatment and control groups, BISP established treatment and control groups on the basis of narrowed PMT bandwidth; households having a PMT score between 11.17 and 16.17 were declared as beneficiaries and households having scores between 16.18 and 21.17 were declared as non-beneficiary households. Establishing a baseline helped in comparing the beneficiary (treated) and non-beneficiary (control) households across that time and over time.
The 2019 follow-up round covered 9,159 households (
Table 1). However, one can observe a high attrition rate between the rounds (2016 and 2019) that was due to data matching issues, as the baseline was conducted right before the poverty score card survey in some areas. Therefore, households that were found to be matched on PMT scores in both the baseline survey and poverty score card survey were considered valid and the rest were dropped.
Table 1. Sample Size of BISP's Panel Data.
Province | Households Surveyed in 2016 (Baseline Survey) | Households Surveyed in 2019 (Evaluation Survey) | Panel Households (2016 and 2019) |
Rural | Urban | Total | Rural | Urban | Total | Target | Control |
Punjab | 2389 | 773 | 3162 | 2287 | 999 | 3286 | 580 | 419 |
Sindh | 1524 | 810 | 2334 | 1794 | 1213 | 3007 | 1001 | 233 |
KPK | 1533 | 521 | 2054 | 1505 | 670 | 2175 | 651 | 269 |
Balochistan | 829 | 296 | 1125 | 434 | 237 | 671 | 154 | 73 |
Total | 6275 | 2400 | 8675 | 6020 | 3119 | 9139 | 2386 | 994 |
Source: Estimated from the BISP Impact Evaluation Survey 2016 and 2019.
4.1. Methodology
To accomplish the objectives of the proposed research on selected welfare indicators, we have conducted both bi-variate and multivariate analyses. The selected welfare indicators are: per-adult equivalent monthly consumption, headcount poverty, multidimensional poverty index (MPI) and child deprivation index (CDI). The reason for selection of impact variables is the potential BISP’s impact where ‘Theory of Change’ suggests that BISP’s cash transfer will help in consumption smoothing in the short-run and assets building in the long-run.
We have used both the various statistical techniques to gauge overtime and across the impacts, i.e. Regression Discontinuity Design (RDD) and difference-in-difference (DiD). However, one of the major drawbacks is to tackle selection biases in evaluation as beneficiary (treated) households vary from non-beneficiary (control) households on socio-demographic characteristics. Propensity score matching (PSM) is a potential solution to avoid selection biases, as it provides appropriate comparisons by constructing a treated and valid counterfactual group. However, the technique faces certain challenges, i.e. weak internal validity and an absence of long-range comparisons
| [25] | Iqbal, N., & Nawaz, S. (2017). Targeting efficiency and effectiveness of national cash transfers program: Lessons from BISP, Pakistan. Economic challenges facing Pakistan in the regional and global environment, 19, 337-357. |
[25]
.
In multivariate analysis, we have used the Regression Discontinuity Design (RDD) technique to gauge the cross-sectional impacts for the 2016 round where beneficiary households were compared to non-beneficiary households on selected welfare indicators. Similarly, we have applied the Difference in Difference (DiD) technique for panel households to measure the welfare impacts over time. As detailed in
Table 1, we have data from 3380 panel households who were interviewed in both the 2016 and 2019 rounds. It is worth mentioning that all the beneficiary households cannot be compared with non-beneficiary households due to variations in socio-demographic and economic characteristics. Therefore, we have developed two comparable groups for comparison; beneficiary households having a PMT score from 11.17 to 16.17 were compared with non-beneficiary households having a PMT score from 16.18 to 21.17.
The bi-variate analysis has covered a comparison of socio-demographic and economic characteristics between beneficiary households and non-beneficiary households by developing two bandwidths of the poverty score, wherein households having scores above 11.17 and below 16.17 are declared as beneficiary households whilst households having scores above 16.17 but below 21.17 serve as the non-beneficiary group.
Before explaining the methodology, it is necessary to provide details on the measurement of selected welfare indicators as follows:
1) Child Health
We gained child specific information on weight height age 0-5 years and gender to build outcome variables. Children's weight is recorded in kilograms and their height determined in inches. By the specific information of children, we have estimates three indicators of child growth as suggested by the World Health Organization weight for height and age. The Z-score system framework employed to define these indicators. The morphological value is determined by using this method as a standard deviation above or below the reference median value. The age gender weight and height of children under five years old are used to generate the three child growth indicators. As to the WHO, body weight for age should be used to estimate stunting underweight. While using weight to determine height diminishes
| [21] | Soofi, S. B., Ariff, S., Khan, G. N., Habib, A., Kureishy, S., Ihtesham, Y., & Bhutta, Z. A. (2022). Effectiveness of unconditional cash transfers combined with lipid based nutrient supplement and/or behavior change communication to prevent stunting among children in Pakistan: a cluster randomized controlled trial. The American Journal of Clinical Nutrition, 115(2), 492-502. |
[21]
. Studied main goal is to find out how stunting in children between the ages of 6 and 23 months may be reduced by giving them a medium amount of a lipid based nutrient supplement without condition cash transfers and social and behavior change communication. The study investigates the efficacy of packages for initiatives made up of cash transfers from the BISP without supplementary LNS and SBCC. The trial's findings will be used to build efficient intervention plans to avoid stunting in children between the ages of 6 and 23 months and to give strong evidence as to which intervention packages can significantly affect children's linear growth.
2) The multidimensional poverty index (MPI) is constructed by following Oxford Poverty and Human Development Initiative (OPHI) methodology. The MPI index is calculated by using three dimensions, including education, health and standard of living. Overall, 11 indicators are taken from 3 dimensions. Equal weights are assigned to each of the dimensions by following OPHI methodology. A household will be considered deprived and an MPI poor if s/he is deprived in 1/3 of the weighted indicators.
3) The
child deprivation index (CDI) is constructed using the following OPHI methodology. The same is also used by
| [24] | Banerjee, A., Duflo, E., Glennerster, R., & Kinnan, C. (2015). The miracle of microfinance? Evidence from a randomized evaluation. American economic journal: Applied economics, 7(1), 22-53. |
[24]
for constructing the health index of Pakistan and for the child poverty index of Uganda. The index is developed at the household level by selecting more indicators related to children, and equal weights are assigned to five dimensions. A household is considered to be deprived and CDI poor if any household is deprived in 1/3 of the weighted indicators.
4) BISP beneficiaries:
A PMT score is an operational variable, whereas the binary parameter of the BISP beneficiary is the most important independent variable. The age and gender for the children were control variables. To do this we focus on a specific subset of the assessment houses included in the complete sample used in OPM (2016) the families that participated in four additional household surveys between 2016 and 2019. These surveys comprise a completed in 2the starting point polling 2011 prior to BISP recipients receiving their first cash payments and three follow-up surveys completed in 2013, 2014, and 2016 that re-interviewed the same beneficiary families following the start of payments.
5) Household Income
The HH-specific factors comprise family size, head's age, gender, education, and HH level calorie consumption. Nonetheless, there are three criteria used to classify weight for height. If the weight for height score is more than +2, it is considered overweight; if it is anticipated to be between 2 and 3, it is considered mild wasting. It includes sustainable, inclusive, and sustained growth as one of its economic goals at the start of the 1970s, when a paradox was created, the Clubhouse Ferrari demonstrated the boundaries of proliferation in restricting the natural world.
4.2. Regression Discontinuity Design (RDD) Technique
Here we have employed the RDD for evaluating the impact of BISP’s cash assistance on selected welfare indicators by using various fixed bandwidths, i.e., +/-3 to +/-5, and optimal bandwidth. The reason behind using various bandwidths is to ensure internal validity. In other words, socio-demographic and economic characteristics of beneficiary and non-beneficiary households must be the same, as one can then expect a concise comparison while reducing the bandwidth. The RDD technique encompasses strong internal validity for those households located near or in close proximity to the threshold, which gives Local Average Treatment Effects (LATE) for households near the threshold but weak external validity for those farther from the cut-off—that’s why we excluded benefiting households having scores below 11.17. Under certain assumptions of RDD, we have used observations close to the cut-off/threshold for assessing the impact of the programme on the outcome variable (OV) by taking the difference in the OV of the treatment and control group observations around the cut-off point, as illustrated below:
OV (1) − OV (0) = (OV𝑖|𝑥𝑖, = 1,𝐵𝐼𝑆𝑃score𝑖𝐸(OV𝑖|𝑥𝑖,𝑖= 0,𝐵𝐼𝑆𝑃score𝑖)
The existing available literature has basically portrayed two types of RDD, namely sharp RD, wherein only eligible households can be selected for assistance while non-eligible households will not be part of the programme and perfect compliance in selecting beneficiary and non-beneficiary households is possible. In Fuzzy RD, however, some non-beneficiary group households may receive assistance based on some socio-economic characteristics like disability, and this approach does not require perfect compliance from beneficiary and non-beneficiary households. Here we have used Fuzzy RD, as the BISP’s assistance has also been given to some those households who are eligible but have a poverty score above 16.17. Furthermore, here we have used a non-parametric approach that involves estimating differences in the intercepts, i.e. discontinuity intwo local polynomial estimators from each side of the eligibility cut-off/threshold. Formally, for positive bandwidth h:
We used a Kernel Weight technique to apply larger weights to observations closest to the cut-off point instead of those further away. As a result, triangular kernel weights were assigned to each of the observations. This approach compares (treatment group) families to (control group) households to assess the impact of any intervention. It also compares people (other entities) who are just affected by the rule with people who are not affected by the rule.
4.3. (DiD) Difference in Differences Technique
When comparing the same treated and non-treated families over time (2016 and 2019), the study uses the DiD approach to measure effects for panel households. To calculate the intervention's effectiveness, the DiD technique examines the variation in the outcome variables across chronological distinctions between the beneficiary and non-beneficiary groups.
O𝒖𝒕𝒄𝒐𝒎𝒆=𝜷𝟎+𝜷𝟏𝒉𝒉𝒊+𝜷𝟐𝒔𝒐𝒄𝒊𝒐𝒆𝒄𝒐𝒄𝒉𝒂𝒓𝒂𝒄𝒕𝒆𝒓𝒊𝒔𝒕𝒊𝒄𝒔+𝜷𝟑(𝒂𝒈𝒆∗𝒃𝒊𝒔𝒑𝒃𝒆𝒏𝒆𝒇𝒊𝒄𝒊𝒂𝒓𝒊𝒆𝒔) +𝒇𝒆+𝜺
Outcomes variable: Health (stunting, wasting, weight, age (0+5), wellbeing (Proxy food consumption score). Independent variables: household income (education, socioeconomic characteristics, age, gender), BISP beneficiary. The outcomes are stunting, wasting, weight (age 0+5) & wellbeing (Proxy food consumption score).
β0 𝑖𝑠 𝑎 𝑐𝑜𝑛𝑠𝑡𝑎𝑛𝑡 𝑡𝑒𝑟𝑚,
𝛽1 𝑖𝑠 ℎ𝑜𝑢𝑠𝑒 ℎ𝑜𝑙𝑑 𝑖𝑛𝑐𝑜𝑚 Including socio economic characteristics, education, and gender). β3 𝑏𝑖𝑠𝑝𝑏𝑒𝑛𝑒𝑓𝑖𝑐𝑖𝑎𝑟𝑖𝑒𝑠, 𝑛𝑜𝑛 𝑏𝑖𝑠𝑝 𝑏𝑒𝑛𝑒𝑓𝑖𝑐𝑖𝑎𝑟𝑖𝑒𝑠:
fe is the fixed effect of each residence, and
€ is the erroneous term.
We have utilized two statistical techniques to analyze the impacts over time as well as across the board: (DiD) and (RDD). However, dealing with selection biasness in assessment is one of the key problems since beneficiary (treatment) homes differ from no beneficiary (control) households in terms of socio-demographic traits.
Regression Discontinuity Design (RDD) was employed in multi variate analysis to evaluate the cross-sectional effects for the 2016 round where beneficiary families and non-beneficiary households were contrasted on a few welfare measures.
To quantify the welfare implications over time for panel homes, we similarly used the Difference in Difference (DiD) approach. We have data from 3380 panel families that were surveyed in the year 2016 and 2019.
5. Results and Discussion
The present section encompasses the findings of the study, where section 5.1 has covered bi-variate analysis by making a comparison between beneficiary and non-beneficiary households, whereas section 5.2 has explained multi-variate analysis, including the results estimated through the RDD and DiD approaches.
5.1. Economic and Socioeconomic Variables
As detailed in the methodology, we have established two groups for comparison: beneficiary households having PMT scores between 11.17 and 16.17 and non-beneficiary households having scores between 16.18 and 21.17. Therefore, the impact evaluation analysis is carried out within a narrowed PMT bandwidth of+/-5 cut-off.
Table 2 displays the findings on socio-demographic characteristics of beneficiary and non-beneficiary households where both the 2011 and 2016 rounds are used. Three results can be drawn from the analysis: first, beneficiary and non-beneficiary households are almost homogenous on various socio-demographic and economic characteristics, except that the former has been receiving cash assistance. Second, both sorts of households have been facing a high number of vulnerabilities, i.e. larger household size, high dependency rates, lower levels of education and higher levels of malnutrition. Third, during the 2011 and 2016 period, only a few indicators have shown improvement in each household’s well-being among both groups, i.e. improvement in child schooling, reduction in dependency and child labour, whereas there is still a high level of malnutrition.
Table 2. Socio Economic Characteristics by PMT Score within +/-5 Bandwidth.
Characteristics | 2016 Round | 2019 Round |
PMT Score 11.17 to 16.17 | PMT Score 16.18 to 21.17 | PMT Score 11.17 to 16.17 | PMT Score 16.18 to 21.17 |
Household size (average) | 7.6 | 7.9 | 7.7 | 7.2 |
Age of head (Avg yrs.) | 46.3 | 44.9 | 47.9 | 48.3 |
Female-headed households (%) | 6.6 | 8.4 | 11.1 | 13.8 |
Male adults (No.) | 1.8 | 1.9 | 2.1 | 2.0 |
Female adults (No.) | 1.9 | 1.9 | 2.2 | 2.1 |
Presence of disabled persons (%) | 32.8 | 31.5 | 22.7 | 22.2 |
High-dependency households (%) * | 56.8 | 48.6 | 37.7 | 34.1 |
Education of HH head (avg yrs.) | 2.1 | 2.4 | 2.4 | 2.9 |
Employment status of household head (%) | 81.6 | 76.4 | 75.2 | 72.1 |
Maximum education of household (avg yrs.) | 6.7 | 6.3 | 7.3 | 7.9 |
Child stunting (%) | 41.5 | 41.9 | 45.4 | 43.6 |
Child wasting (%) | 21.1 | 19.5 | 18.1 | 18.1 |
Child underweight (%) | 38.1 | 39.2 | 34.0 | 31.3 |
Child attendance age 5-12 years (%) | 57.0 | 45 | 70.4 | 60.4 |
Child labor age 5-14 years (%) | 16.7 | 14.1 | 13.4 | 10.7 |
Source: Estimated from the BISP Impact Evaluation Survey 2011 and 2016 rounds.
A comparison among beneficiary and non-beneficiary households on dwelling and asset ownership is provided in
Table 3, where both the 2011 and 2016 rounds are documented. The findings reveal that both the beneficiary and non-beneficiary households are at their most disadvantaged conditions in 2011 and 2016 due to their poor living conditions, i.e. less access to toilet facilities, challenges in access to safe drinking water, high crowding rates, and low-quality housing (
katcha). In addition, the majority of them lack reproductive assets, i.e. land and livestock. Profiling both sorts of households (beneficiary and non-beneficiary) illustrates that both groups have exhibited, on average, similar characteristics across time.
Table 3. Household Assets Characteristics by PMT Score around +/-5 Bandwidth.
Characteristics | 2016 Round | 2019 Round |
PMT Score 11.17 to 16.17 | PMT Score 16.18 to 21.17 | PMT Score. 11.17 to 16.17 | PMT Score 16.18 to 21.17 |
Owning house (%) | 77.9 | 80.7 | 81.8 | 84.1 |
Small animals (%) | 41.7 | 40.3 | 32.6 | 29.7 |
Large animals (%) | 31.8 | 30.2 | 28.9 | 27.2 |
Owning agricultural land (%) | 12.4 | 13.9 | 12.2 | 12.5 |
Floor katcha (%) | 72.9 | 65.3 | 59.0 | 53.1 |
Access to toilet facilities (%) | 60.2 | 66.9 | 83.1 | 86.3 |
Access to safe drinking water (%) | 76.8 | 79.7 | 82.5 | 84.1 |
Persons per room (Average) | 5.1 | 5.5 | 4.9 | 4.4 |
HH faced shocks during the last two years (%) | 73.8 | 68.5 | 48.4 | 49.3 |
Source: Estimated from the BISP Impact Evaluation Survey 2016 and 2019 rounds.
In bi-variate analysis, we have also gauged the performance of cash assistance on selected socioeconomic indicators by comparing both the cross-sectional and panel-surveyed beneficiary and non-beneficiary households. The consumption expenditures show that during the 2016 to 2019 period, the average real per-adult equivalent monthly expenditures improved, as shown by both the cross-sectional and panel analysis. The improvement is almost uniform on food and non-food consumption, as well as among both the beneficiary and non-beneficiary households.
Table 4. Good health and well-being among beneficiaries Non beneficiary’s household.
Characteristics | 2016 Round | 2019 Round |
Stunting in children% | 41.5 | 41.9 | 45.4 | 43.6 |
Wasting in children% | 21.1 | 19.5 | 18.1 | 18.1 |
Underweight child% | 38.1 | 39.2 | 34.0 | 31.3 |
Real per adult equivalent monthly consumption (in Rs.) | 1864 | 1896 | 2349 | 2481 |
Real per adult equivalent monthly food consumption (in Rs.) | 803 | 791 | 1173 | 1206 |
Headcount poverty (%) based on CBN Approach | 87.1 | 85.3 | 87.8 | 84.4 |
Source: Estimated from the 2016 and 2019 cycles from the BISP Impact Assessment Survey
In terms of health, child nutrition has a significant role in the reported rates of MPI poverty, with nearly one in five households in 2016 having a malnourished kid between the ages of 0-59. Security for nutrition for kids and newborns is crucial to the BISP's longer-term objectives of shielding an especially susceptible group as a result of perpetual poverty. A substantial body of research suggests there should be inadequate nutrition for babies and young children plays an important role in the inter-generational transfer of poverty.
| [18] | Grantham-McGregor, S., Cheung, Y. B., Cueto, S., Glewwe, P., Richter, L., & Strupp, B. (2007). Developmental potential in the first 5 years for children in developing countries. The lancet, 369(9555), 60-70. |
| [26] | Kopeinig, M., & Petritsch, W. (2009). Das Kreisky-Prinzip: im Mittelpunkt der Mensch. Czernin. |
[18, 26]
While a lower lifetime income is associated with poorer academic performance. (BISP, 2016) Reports that that there has been minimal development done to improve the nutrition of kids living in BISP recipient families, with malnutrition rates being persistently high from 2011 to 2016 revealed stunting rates 51 per of boys and 46 per of girls are respectively. Also implying a persistent malnourishment issue the magnitude of this predicament is understandable. The child has had multiple bouts of illness or disease during their childhood and has not got appropriate protein, calories, and micronutrients. Furthermore, the prevalence of stunting in the population is far above the level considered a calamity by the World Health Organization.
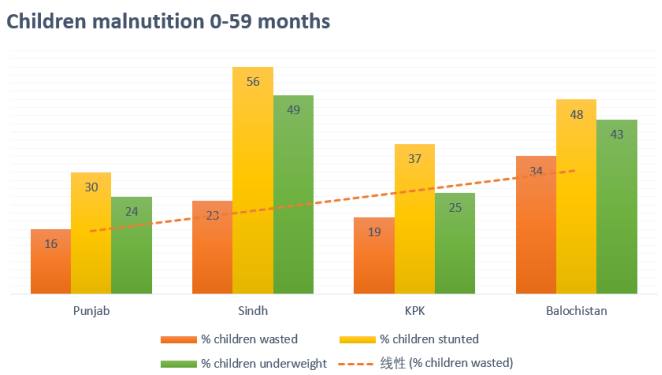
Figure 1 also reports high proportions of underweight children, with 35% of children aged 0-59 months underweight across Pakistan. Reflecting the relatively high rates of stunting and wasting, the highest proportions of children underweight can be found in Sindh and Balochistan.
Figure 1. Children Malnutrition 0-59 months.
Table 5. BISP Impact on Child Health.
| Mean Treatment | Sample Size Treatment | Impact Estimate |
All bene | RD bene | RD | PSM | RD | PSM |
Proportion of children aged 0-59 months wasted |
All Children | 21 | 21 | 1,984 | 2,567 | -2 | -1 |
Male | 23 | 23 | 1,059 | n/a | -2 | n/a |
Female | 20 | 19 | 925 | n/a | -3 | n/a |
Proportion of children aged 0-59 months stunted |
All Children | 44 | 43 | 1,984 | 2,567 | 6 | 0 |
Male | 45 | 45 | 1,059 | n/a | 0 | n/a |
Female | 42 | 42 | 925 | n/a | 10 | n/a |
Proportion of children aged 0-59 months underweight |
All children | 35 | 35 | 1,984 | n/a | -1 | n/a |
Male | 36 | 36 | 1,059 | n/a | -6 | n/a |
Female | 34 | 34 | 925 | n/a | 5 | n/a |
Source: BISP impact evaluation survey (2019). Notes: (1) Asterisks (*) indicate that an impact estimate is statistically significant: *** p <.01; ** p <.05; * p <.10.
Table 5 indicates that we do not find that a statistically significant effect of the BISP on child nutritional status, whether this is measured by wasting, stunting, or underweight, either for boys or girls in the evaluation sample. This finding is at odds with previous rounds of evaluation which consistently found that the BISP had an impact on reducing the level of wasting observed for female children aged 0-59 months.
5.2. Conclusion and Policy Implications
The present research has explored the welfare impact of BISP cash assistance by conducting both cross-sectional and panel analyses. The bi-variate analysis shows that beneficiary group and non-beneficiary households hold almost similar socio-demographic and economic characteristics. The findings reveal that BISP has a mild welfare impact, as cross-sectional analyses have shown positive impacts on non-food consumption, total consumption and poverty, whereas there is no impact on the child deprivation index and multidimensional poverty index. The panel analysis shows positive impacts on consumption and the child deprivation index.
The findings draw various implications. First, unconditional cash assistance alone may not be helpful in graduating people out of poverty on a sustainable basis. The BISP has to focus on conditional cash transfers that would help in asset creation and skill development i.e. Mexico, Brazil, Chile etc. have been doing. Second, the current cash assistance (Rs. 5000 quarterly) is not sufficient even in consumption smoothening. The amount must be increased up to the extent that may help in achieving optimal consumption uniformity. Third, the programme should focus on other chronic challenges i.e. malnutrition, financial literacy, child schooling etc. that may help in improving SDG goals. Fourth, the control group (non-beneficiary households) suggests that various deserving households are overlooked by the programme. Keeping in view the dynamic nature of poverty, the process of including and excluding deserving households must also be dynamic in nature. Lastly, after the 18th Amendment, social security and safety nets are now provincial subjects. Keeping in view, a social protection framework is required to clarify roles and responsibilities of federal and provincial governments as well as to tap the private sector.