Research Article | | Peer-Reviewed

Perceived Role of Competitive Intelligence for the Organization: Empirical Evidence from Cameroonian Business Environment

Received: 27 July 2026     Accepted: 17 August 2026     Published: 30 September 2026
Views:       Downloads:
Abstract

Businessmen, for the success of their companies, multiply strategies, techniques and tools in order to control and tackle their competitors and build strategic value. The most suitable tool to realize these ambitions is Competitive intelligence. The main objective of this study is to collect opinions of managers of companies operating in Cameroon regarding the overall utility of Competitive Intelligence (CI). To accomplish this objective, we first explored whether and how CI is practiced into companies operating in Cameroon, compared this functioning and opinions between foreign and local companies as well as classified most impacting variables. This study is inherently qualitative. The study is done by conducting explorative research on CI; therefore, questionnaire has been submitted to CI companies ‘managers in Cameroon. R software was used as it seems more convenient for statistical computing, data analysis, and graphics. Surprisingly, companies functioning in Cameroon globally use Competitive Intelligence to ensure the success of their activities. While looking at the Cameroonian practitioners’ familiarity with CI term, the organizational setup (e.g., departments responsible for CI, number of CI employees, CI budget, etc.) and the CI process flow (e.g., CI process stages, dissemination of CI, etc.), it was discovered that CI in Cameroon is appeared in a relatively unsophisticated scheme partially due to its newness. Results outline the positive effect of CI for companies and the global satisfaction of company’s managers as it contributes to the best understanding of the market, identification of the strengths and weaknesses of competitors, facilitation of decision-making, reduction of risks, long-term strategic advantages, etc.

Published in International Journal of Business and Economics Research (Volume 15, Issue 5)
DOI 10.11648/j.ijber.20261505.12
Page(s) 104-138
Creative Commons

This is an Open Access article, distributed under the terms of the Creative Commons Attribution 4.0 International License (http://creativecommons.org/licenses/by/4.0/), which permits unrestricted use, distribution and reproduction in any medium or format, provided the original work is properly cited.

Copyright

Copyright © The Author(s), 2026. Published by Science Publishing Group

Keywords

Competitive Intelligence, Organization, Company, Cameroon, Satisfaction

1. Introduction
Management systems are nowadays exceptionally growing dynamic and less foreseeable means very sophisticated; situation that let companies functioning in ambiguous environments. Organizations are continuously facing fascinating challenges on a macro and micro level because of globalization and interminably increasing competition. Disconcerted to internal and external pressures, firms have been enforced to meticulously track their environments. The present competitive environment might be very unpredictable and volatile due to the raising globalization, acquisitions and mergers, and a growth in technology uses and new business practices . This dynamic and complex environment imposes the businessmen to think and develop strategies and tools to scope with these challenges . They need to know, controlling and master all the information comprising strategic value. In a highly business environment, firms must be aware of their competitors’ movements and activities . Competitive intelligence is identified as strategic tool that aids companies to be aware of their competitor’s behaviors and plans . Competitive Intelligence can also be recognized as an instrument to heighten competitiveness. This is possible on the one hand through the identification of the opportunities and the risks in time to act upon can be effectively utilized as a mean to increase competitiveness; on the other hand, it can be used as a tool or instrument of making further sense of the competitive business environment. Competitive intelligence allows to organizations a better understanding of the business and industry environment, as well as continuous learning from competitors’ corporate and business strategies. It reduces the risk inbuilt in the choice of competitive strategies for an organization, which is fundamental to achieve success in today’s competitive conditions.
Looking back several epochs, researches on Competitive Intelligence focused mainly on military domain. Competitive intelligence is not a new business activity . Although competitive intelligence is today viewed as a new field of study . The rising importance of Competitive intelligence in academics conveys it closer to be considered as a pertinent discipline in social sciences .
Scientists and academics commenced to develop and applied Competitive Intelligence techniques from National Security to business field during the last decades of the 20th century. Competitive Intelligence progressed from military theory to economics, information science, marketing and strategic management . As a tool, Competitive Intelligence delivers competitive advantage to companies and helps decision-makers . As a profession, Competitive Intelligence should respect a code of ethics developed and prescribed by the Society of Strategic and Competitive Intelligence Professionals (SCIP) . Competitive intelligence produces actionable intelligence that, in turn, helps enterprises in decision-making . Competitive Intelligence main objective is to use several information sources in view to intensify the company competitiveness and decrease the rivals’ competitive advantage . The rising competition in total markets pushes enterprises to look for competences that enhance the competitive perspective to the global strategy. Organizations have to know their competitors if they vow to subsist in the contemporaneous dwindling markets that comprising rising number of enterprises putting in place Competitive Intelligence units to their practices. Internet progressions and the technology developments drive organizations to use Competitive Intelligence techniques . Not only internal environment should be considered by companies in order to make decisions that guarantee the maintenance of competitive advantage and business survival. They ought to meticulously take in account their external environment by thinking about what happened, is happening and could happen as the matter of competitive Intelligence. Competitive intelligence enmeshes a transfer of knowledge from the environment to the company within conventional rules so, it ought to observe code of ethics and be legal . Competitive Intelligence is positioning as a suitable tool that lets organizations to get information concerning their environment, permitting them to identify opportunities, anticipate changes, and focus on innovation.
Competitive Intelligence is a process that consists of a number of steps. Whilst the objectives of Competitive Intelligence are clear, there is some confusion about how the Competitive Intelligence process should be structured . Some scholars view Competitive Intelligence process as a cycle, while others view it as a linear process . Another group of scholars outline many stages in the Competitive Intelligence process, while others identify fewer stages . As caution, without a proper process and structure, it is difficult to develop Competitive Intelligence. Hence, there is a need for a common understanding of the Competitive Intelligence process.
There are many definitions of Competitive Intelligence in the literature. Although explored the definitions of Competitive Intelligence, he has never attempted to come up with a universally accepted definition. Current literature contains much of definitions of Competitive Intelligence. Scientists, researchers and academicians haven’t come out with an unanimously acknowledged definition of Competitive Intelligence process.
Prior researches except for example do not highlight Competitive Intelligence practices in developing countries where this it’s still relatively inexperienced. Competitive Intelligence is particularly widespread in the North American region and in giant Asian and European economies such as China, Japan, France, Great Britain and Germany. This study is addressing the researches’ scarcity regarding developing countries. Cameroon, a developing Sub-Saharan country is the research area.
Competitive Intelligence current literature did not disclose any study on the field regarding any Sub-Saharan African developing country category in which Cameroon is located. The key purposes of this study are to fill this gap in literature on the one hand and to research Competitive Intelligence practices of Cameroonian companies on the other hand. As this study is the first to be carried out in Cameroon, the hope is that it should be helpful for firms operating in Cameroon business environment by providing real time information on the state of the Competitive Intelligence practices in Cameroon. Another importance related to this study might be the provision of the capacities to the companies in order to compare their Competitive Intelligence practices with the ones of their competitors indoors their country. Moreover, conclusions of this study may be important for a comparison with results of similar investigations in other countries. There is obviously no doubt that this study would further be of a special interest for Cameroonian Competitive Intelligence practitioners in order to detect what has to be done.
2. Methodology
2.1. Research Method
Quantitative research has been originally planned for this study. Serious difficulties occurred when looking for the way to simply distinguish the right contacts in Cameroonian companies. The newness of Competitive Intelligence practices in Cameroon business area and the high-confidential status of the topic do not permit to constitute a sample that is wide enough. The pre-test of five expert interviews in order to develop a questionnaire directed the research to the qualitative one that is looked more accurate and favorable to investigate Competitive Intelligence overall role within companies, as Competitive Intelligence practices and consciousness broadly varied. The sample constitutes a well-balanced combination of some companies from different industries located in Yaoundé, the political capital city. During a time period of eight months (February to September 2025), information has been collected. As the further objective of this study was to gain an insight into the topic at hand instead of un-research topic, the relatively sample size is applicable . Consequently, the decision has been taken to engage in questionnaires according to .
2.2. Sample Description
The sampling frame based on a non-random judgement sample consisted of 50 companies disseminated inside Yaoundé. Two version of letters (one in French, the other in English as Cameroon is a bilingual country and because of the presence of many foreign companies) have been written and sent to the top management of each company in order to get an appropriate contact person to whom the questionnaire has to be addressed and to get questionnaire completion permission. Submitted to 50 companies, 30 questionnaires with semi-structured questions have been fully filled, which represents a response rate of 60% while 7 (14%) partially completed and were suppressed. In fact, a digital questionnaire with multiple choice responses has been elaborated using google form application. To be filled, questionnaires were submitted to each person via phone numbers and company’s e-mails, filled online, and were sent back through WhatsApp application and researchers e-mails. The final sample presented a broad diversity in terms of business field, company size and position of the persons devoted to CI in the company. Even though Competitive Intelligence investigations conducted in other countries concluded that the topic first spreads within bigger companies of a country before it gets widely accepted in small and medium sized enterprises , the sample was determined based on the companies operating in the Cameroon business environment that is seemed fragile with no big listed Forbes player. Small and medium sizes companies are mostly identified. Details about industry type present 13 companies belonging to retail and commerce, 7 to telecommunications and finance, 7 to tourism and hotel, and 3 to non-precise type. To ease analyses, Company’s nationality was gathered into two groups that are Cameroonian (national) and foreign companies. Each group consists of half of the companies, representing 15 Cameroonian companies and 15 foreign companies.
2.3. Questionnaire Guide
In order to establish a certain level of reliability and touch the same topics during all the questionnaire completion, it was first crucial to develop an interview guide which was applied during the interviews pretest and served for the elaboration of the questionnaire. Google form software was helpful in building multiple choices questions to assure a maximum of suppleness during the completion without omitting to address any of the major topics . The sequence and formulation of the question followed the same order then, thirty-one questions divided into two parts have been elaborated based on existing literature and the authors personal thoughts; the first part comprises company general characteristics while the second part deeply focuses on the Competitive Intelligence definition, practices, work, the possibilities of measuring the outcome, and the global perceived utility of Competitive Intelligence for the company.
2.4. Analysis
R, an open-source software environment and programming language for statistical computing, data analysis, and graphics is used. To ease analyses, questions length has been reduced so, new modalities have appeared. Moreover, a general coding system was developed along the reception of the responses following the respect of numeral order means the first response got the number 1, the second number 2, and so on. To check the dependency relationships between variables, Chi-square tests, allowed us to assess the existence of statistical links between two variables. A p-value of less than 0.05 indicates a significant dependency between the variables tested. Discriminant analysis (DA) and multiple component analysis (MCA) enabled us to better identify similarities between variables. Discriminant analysis was used to identify the most decisive variables. This method aims to classify variables according to their impact on the distinction between groups in terms of CI use. In other words, it identifies the characteristics that play a key role in companies' decisions to adopt CI. Kaizer's rule permitted us to target modalities that make a significant contribution to the formation of axes. Gower's distance at the end facilitated building the dendrogram resulting from hierarchical clustering highlighting groupings of qualitative variables based on their similarity.
2.5. Variables Description
Analyzing the competitive intelligence situation in companies requires a set of data collected from those companies. As part of this study, data was collected from 30 companies (N=30) of various nationalities operating in a range of sectors. These data cover 21 variables with approximately 75 modalities. The table below presents each variable as well as the number and percentage of modalities for each variable.
Table 1. Distribution of study variables according to their number and representativeness.

Variable

Modalities

Number

Percentage

Company_nationality

Cameroonian_Company

15

50

Foreign_Company

15

50

Company_size

01_99Employes

13

43.3

100_200 Employees

10

33.3

More than 200 Employees

7

23.3

Industry_Type

F_Ind_Ret_Com

13

43.3

Other_ind

3

10

Post_Telecom_Fin_ serv

7

23.3

Tourism_Hotel

7

23.3

Company_Age

10 Years and Above

19

63.3

Less than 10 Years

11

36.7

Respondent_CI_def

No_Definition

6

20

Other_Definition

8

26.7

Respondent_CI_def5

10

33.3

Respondent_CI_def9

6

20

Terminology_CI_act

No_Specific_Terminology

8

26.7

Other_Terminologie

7

23.3

Terminology_CI_act2

10

33.3

Terminology_CI_act8

5

16.7

Position_responsible_CI

Other_Position_resp

5

16.7

Position_responsible_CI2

18

60

Position_responsible_CI5

7

23.3

Dept_Responsible_CI

Dept_Responsible_CI3

10

33.3

Dept_Responsible_CI4

6

20

Dept_Responsible_CI7

6

20

Other_Dept_Responsible

8

26.7

NEDD_CI_Company

NEDD_CI_Company1

14

46.7

NEDD_CI_Company3

7

23.3

Other_NEDD_CI

9

30

CI_budget

No_Budget

10

33.3

Other_CI_budget

1

3.3

Separated_CI_Budget

19

63.3

Typ_coll_info

Other_Typ_coll_info

6

20

Typ_coll_info110

9

30

Typ_coll_info111

5

16.7

Typ_coll_info112

10

33.3

CI_inf_source

CI_inf_source110

3

10

CI_inf_source111

14

46.7

CI_inf_source112

7

23.3

Other_Inf_Source

6

20

CI_proces_stages

CI_proces_stages110

4

13.3

CI_proces_stages111

20

66.7

Other_CI_proces_stages

6

20

initiatives_CI_activities

Continuously

16

53.3

None

6

20

Other_ini_CI_activities

8

26.7

Ways_diss_CI_fdings

Other_Ways_diss_CI_fdings

6

20

Ways_diss_CI_fdings110

8

26.7

Ways_diss_CI_fdings111

16

53.3

Hierarchy_level_CI

Hierarchy_CA_DG

24

80

Other_Hierarchy_level

6

20

Dpmt_receive_CI_inf

Marketing

23

76.7

Other_Dpmt

7

23.3

Strat_tac_CI_util

None_Both

6

20

Strat_tac_util

23

76.7

Tactical_utilization

1

3.3

Perceivedbenefits_reasons_CI

Other_Perceivedbenefits_reasons

6

20

Perceivedbenefits_reasons_CI21

8

26.7

Perceivedbenefits_reasons_CI22

11

36.7

Perceivedbenefits_reasons_CI23

5

16.7

Current_rol_CI

Negative.situation

1

3.3

Neutral.situation

5

16.7

Positive.situation

24

80

Satisfaction

No

6

20

Yes

24

80

3. Results (Findings)
The findings of this study are structured into four stages. The familiarity of Competitive Intelligence practitioner’s knowledge is first analyzed. In the second phase, the organizational aspects of Competitive Intelligence in the Cameroonian business environment are presented. The next stage of analysis concerns the illustration of the data collection practices of Competitive Intelligence workers and the several aspects of the Competitive Intelligence process. Lastly, Competitive Intelligence perceived benefits and some issues like satisfaction concerning the measuring process of the value of Competitive Intelligence are highlighted.
3.1. Analysis of Company Profiles
This section describes the profiles of the companies and their preferences with regard to variables in the study.
Figure 1. Distribution of companies by nationality.
This graph shows the distribution of companies according to their nationality. It shows that one (01) in two (02) companies, or 50% of the companies in the sample, are Cameroonian. Companies of other nationalities also represent 50% of the total sample.
3.2. Company Size
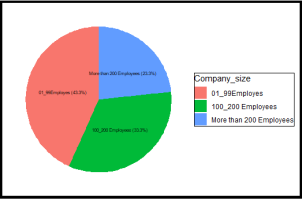
Figure 2. Breakdown of companies by size.
The size of a company corresponds to the total number of employees it employs. The graph below illustrates the distribution of companies according to their size, divided into three categories:
1) 1 to 99 employees;
2) 100 to 200 employees;
3) more than 200 employees.
Just over two in five companies (43.3%) have fewer than 100 employees. Approximately one in three companies (33.3%) employs more than 200 people. Most of these companies correspond to Small and Medium Enterprise (SME) and Mid-size Enterprise (ME).3.
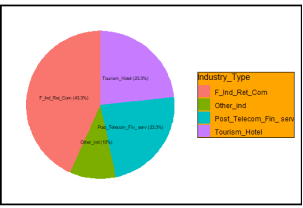
Figure 3. Distribution of companies by sector of activity.
This graph shows the distribution of companies by sector of activity. It can be seen that: Four (04) main sectors of activity are represented. It also appears that more than two (02) out of five (05) companies (43.3%) operate in the agri-food retail sector. The tourism and hospitality (Tourism_Hotel) and postal, telecommunications, and finance (Post_Telecom_Fin_Serv) sectors are also strongly represented, with rates of 23.3% while not specified industries represent 10%.
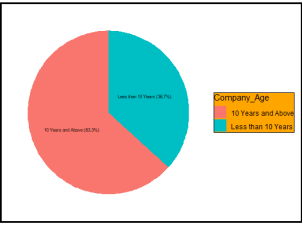
Figure 4. Distribution of companies according to their age.
This graph illustrates the distribution of companies according to their age. It shows that slightly more than 6 out of 10 companies (63.3%) have been in existence for less than 10 years, while less than 4 out of 10 (36.7%) have been established for more than 10 years.
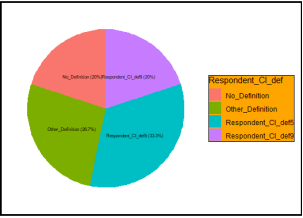
Figure 5. Respondent's CI definition / Definition of the term CI by the respondent.
The graph above illustrates the different definitions that companies give to competitive intelligence. The following trends emerge:
1) Approximately 2 in 10 companies (20%) do not have a clear definition of competitive intelligence;
2) Nearly 2 in 10 companies (20%) consider competitive intelligence to be an overall assessment of the competitive environment (Respondent_CI_def9);
3) Just over 3 out of 10 companies (33.3%) define it as a process combining the collection of information on competitors and the analysis of the entire competitive environment (Respondent_CI_def5);
4) Finally, approximately 26.7% of companies perceive competitive intelligence as a process that includes gathering information on competitors, observing and monitoring the market, and assessing the competitive environment as a whole.
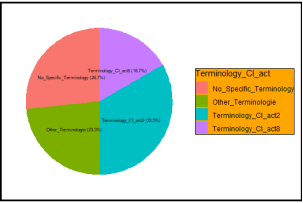
Figure 6. Terminology used for CI activities in the Company.
This graph highlights the different terminology used by companies to refer to activities related to competitive intelligence (CI). The following observations can be made:
1) Just over 3 in 10 companies, or 33.3%, use the term CI in the context of business intelligence (Terminology_CI_act2);
2) Approximately 16.7% of companies opt for the term “Economic Intelligence” (Terminology_CI_act8);
3) More than 2 out of 10 companies (26.7%) do not have any specific terminology to describe their CI activities;
4) Approximately 23.3% of companies use other terms, such as competitive intelligence, competitive awareness, market development or expansion, and marketing intelligence.
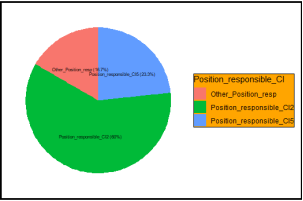
Figure 7. Title of the person responsible for the CI in the company.
This graph shows the positions held by individuals responsible for competitive intelligence activities within companies. It reveals the following findings:
1) In 6 out of 10 companies (60%), CI activities are carried out by the marketing manager (Position_responsible_CI2);
2) Just over 2 out of 10 companies, or 23.3%, entrust these activities to staff who do not hold any official position within the company (Position_responsible_CI5);
3) In 16.7% of cases, responsibility for CI falls to other profiles, such as a competitive intelligence manager, a member of the market research team, a manager responsible for processes and data related to these studies, a marketing project manager, a marketing intelligence manager, or a market and competition analyst (Other_Position_responsible).
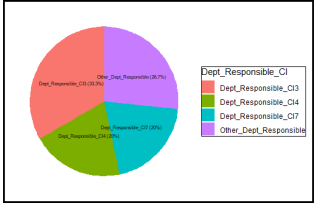
Figure 8. Department Responsible of CI.
The chart above illustrates the different departments responsible for managing CI within companies. It shows that:
1) Approximately 33.3% of companies (nearly 3 out of 10) entrust this responsibility to the Marketing and Market Intelligence department (Dept_Responsible_CI3);
2) Nearly 20% of companies (2 out of 10) rely on the Marketing-Sales department to manage CI information (Dept_Responsible_CI4);
3) Almost 20% of companies do not have a department specifically dedicated to this information (Dept_Responsible_CI7);
4) Finally, nearly 26.7% of companies (just over 2 out of 10) use other departments for CI activities (Other_Dept_Responsible), including one or more of the following: Competitive Intelligence, Marketing and Distribution, Market Development, Research and Development, or Marketing Research.
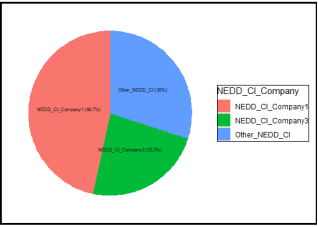
Figure 9. Distribution of companies according to the number of staff involved in CI activities.
The graph above shows the distribution of employees directly involved in CI activities within companies.
It shows that:
1) Nearly 47% of companies (just under 5 out of 10) have more than one employee fully involved in IC/VC activities (NEDD_CI_Company1);
2) Approximately 23.3% of companies (nearly 2 out of 10) do not have any staff specifically dedicated to these activities at any given time (NEDD_CI_Company1);
3) Nearly 30% of companies report having either one employee involved on an ad hoc basis, one employee involved partially or fully, or several people partially involved in CI activities (Other_NEDD_CI_Company).
Figure 10. Distribution of the CI budget among companies.
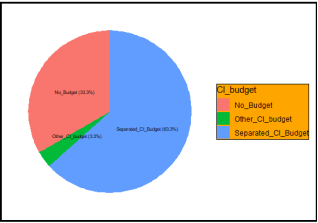
This graph shows the methods used to finance competitive intelligence activities within companies. The data reveals that more than 6 out of 10 companies (63.3%) have a specific budget dedicated to CI. Approximately 30% of companies do not allocate any budget for these activities, while 3.3% report using other forms of financing.
Figure 11. Typology of information collected by companies.
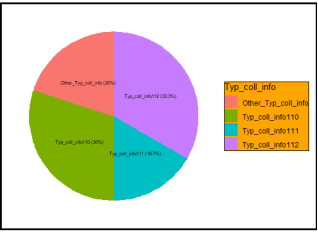
This graph highlights the types of information collected by companies as part of their competitive intelligence and market monitoring activities. Four main categories of information emerge:
1) Approximately one in three companies (33%) collects information corresponding to type typ_coll_info_112. This mainly concerns marketing and the overall market environment;
2) The second group, representing 30% of companies, collects a broader set of data including:
a) Products and services;
b) Prices and payment terms;
c) Financial data;
d) Marketing;
e) Distribution and sales;
f) Competitive strategies;
g) Suppliers;
h) Market reports;
i) As well as competitors' strengths and weaknesses.
3) The third group, representing 16% of companies, collects information on:
a) Marketing;
b) Products and services;
c) The overall market environment;
d) And strategies.
4) Finally, nearly 6% of companies collect other types of information not specified in the previous categories.
Figure 12. Sources of CI information used by companies.
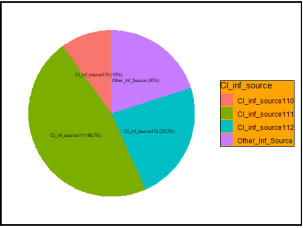
This figure shows the different sources of information used by companies. We can see that this information comes from several channels:
1) The first source concerns nearly 46.7% of companies. These companies collect their data from various sources such as the Internet, prospects, employees, official authorities, industry unions, personal networks, information providers, annual reports, and customers;
2) The second source covers around 23% of companies. They use at least one of the sources mentioned above, specifically adding industry associations;
3) The third group, which represents only 10% of companies, relies mainly on the Internet, information providers, prospects, employees, personal networks, and customers to collect their information.
Figure 13. The stages of the CI process.
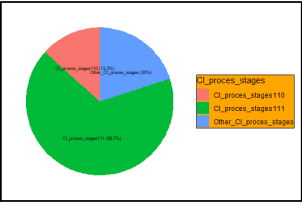
The figure shows the different stages of the process of implementing Competitive Intelligence and Market Intelligence (CI/MI) in companies. There is a clear predominance of the proces_stage_111 process, adopted by 66% of companies. This process includes the following stages: collection, processing, analysis, sorting, capture, and storage of information.
The aim of this section was to analyze the different variables and modalities of the study by presenting their numbers and associated frequencies. It enabled us to draw up a profile of the companies, identify the reasons for use, the types of data collected, the sources of information, the main stages of the CI/BM process, and the level of satisfaction of the user companies.
However, this descriptive analysis does not highlight the relationships between these variables. The following section will therefore be devoted to studying the links and interactions between these different variables.
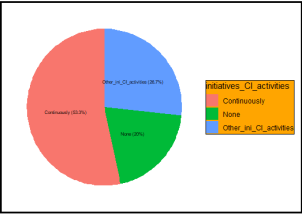
Figure 14. Structural drivers behind CI activities.
This chart illustrates the types of structural driving forces that support competitive intelligence (CI) activities within companies. The study results reveal that more than half of companies (53.3%) have ongoing driving forces, providing regular and structured support for CI activities. Approximately 26.7% of companies rely on other types of forces, which can be either planned (permanent or predefined) or ad hoc (temporary and created in response to a specific need). Finally, 20% of companies report that they have no structural driving forces to oversee or support their CI activities.
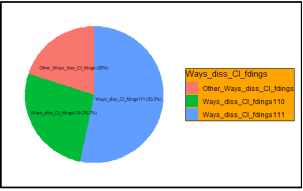
Figure 15. Means of disseminating CI results.
this graph highlights the methods used to disseminate information obtained from Competitive Intelligence and Market Intelligence (CI/MI) within companies. We can see that more than half of companies (16 out of 30) use the Ways_diss_CI_fdings111 method, which combines several channels: newsletters, emails, intranet, and conferences. Approximately 8 out of 30 companies, or just over 26%, favor the Ways_diss_CI_fdings110 method, which is based on a combination of conferences, intranet, text messages, and emails. Finally, nearly 6 out of 30 companies (approximately 23%) have their own customized dissemination methods.
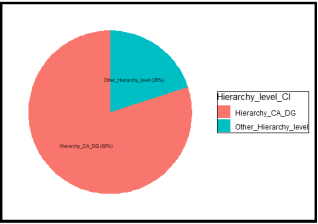
Figure 16. The levels of prioritization of competitive intelligence in companies.
This figure illustrates the hierarchical level of recipients of competitive intelligence and market intelligence (CI/MI) information within companies. It can be seen that this level varies depending on the structure. Nearly four out of five companies, or 80%, indicate that monitoring information is sent directly to the Board of Directors or the CEO. On the other hand, one in five companies transmits this information to other hierarchical levels.
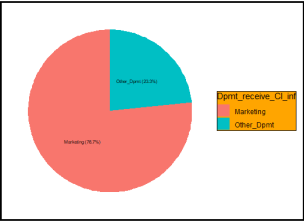
Figure 17. Departments responsible for receiving CI information within companies.
The figure above highlights the departments within companies that receive competitive intelligence CI information. The data shows that in more than 7 out of 10 companies (76.7%), this information is received by the marketing department. However, only 23.3% of companies pass it on to other departments, including research and development.
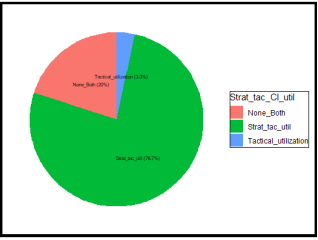
Figure 18. Strategic or tactical use of CI by companies.
This graph shows that information obtained from competitive intelligence is mainly used by companies for strategic and tactical purposes. It reveals that:
1) More than seven out of ten users (76%) use competitive intelligence for both strategic and tactical purposes;
2) Only 3% use it exclusively for tactical purposes;
3) Finally, 20% of users use it for purposes other than these two.
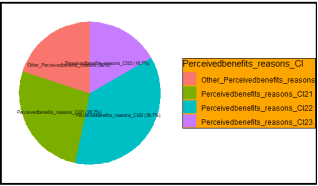
Figure 19. Perceived benefits of CI and reasons for its use.
This graph identifies four main user groups based on the perceived benefits and reasons for using Competitive Intelligence and Market Intelligence (CI). The following trends can be observed:
1) Approximately 11 out of 30 users (36.7%) belong to the Perceivedbenefits_reasons_CI22 group. These companies use CI primarily to:
a) Better understand the market;
b) Identify competitors' strengths and weaknesses (benchmarking);
c) Facilitate decision-making;
d) Reduce risks;
e) Obtain long-term strategic advantages;
f) And benefit from financial returns.
2) Nearly 8 out of 30 users (26.6%) belong to a group with motivations similar to those of the first (Perceivedbenefits_reasons_CI22), with the difference that they do not include financial benefits among their objectives;
3) The third group, representing approximately 16% of users, is associated with Perceivedbenefits_reasons_CI23. This group shares the same objectives as the first, with the exception of decision-making support, which is not among their priorities;
4) Finally, the last group brings together users with motivations and expectations that differ from those of the previous groups. They use CI for other specific reasons and expect distinct benefits from it.
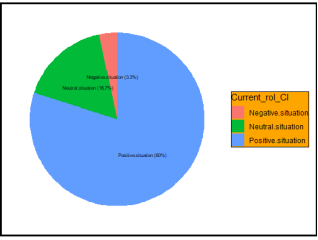
Figure 20. Presentation of the current role of CI use in companies.
This graph illustrates how companies perceive the impact of competitive intelligence on their activities. It shows that nearly four out of five companies, or 80% of the total, believe that competitive intelligence has a positive effect. Conversely, just over one in ten companies, or 16%, consider that the impact is not yet noticeable within their organization.
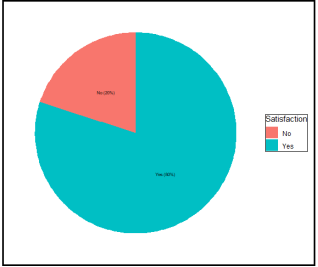
Figure 21. Company satisfaction with competitive intelligence.
In order to assess the satisfaction of potential users of competitive intelligence, a binary variable called “Satisfaction” was defined. It takes the value “1” (or “Yes”) when the impact of competitive intelligence is considered positive, and ‘0’ (or “No”) when it is not. In this context, the “Satisfaction” variable is considered the target (or dependent) variable, while the other variables are treated as independent. According to the graph, nearly eight out of ten users, or 80%, say they are satisfied with competitive intelligence.
3.3. Analysis of Dependencies Between Variables
In this section, we analyze the dependency relationships between variables. To do this, we use Chi-square tests, which allow us to assess the existence of statistical links between two variables. A p-value of less than 0.05 indicates a significant dependency between the variables tested. Conversely, if the p-value is greater than or equal to 0.05, no significant relationship is observed.
3.3.1. Verification of the Relationship Between the Variables in the Study
The influence of each variable on the current role of competitive intelligence was analyzed using the Chi-square test, a statistical test used to assess whether the observed distribution differs significantly from the expected distribution. The results presented in the graphs below reveal that several variables have a significant relationship with the role assigned to competitive intelligence. This suggests that these variables contribute significantly to the likelihood that it will have a positive or negative impact within companies.
Figure 22. Results of the chi-square test between variables.
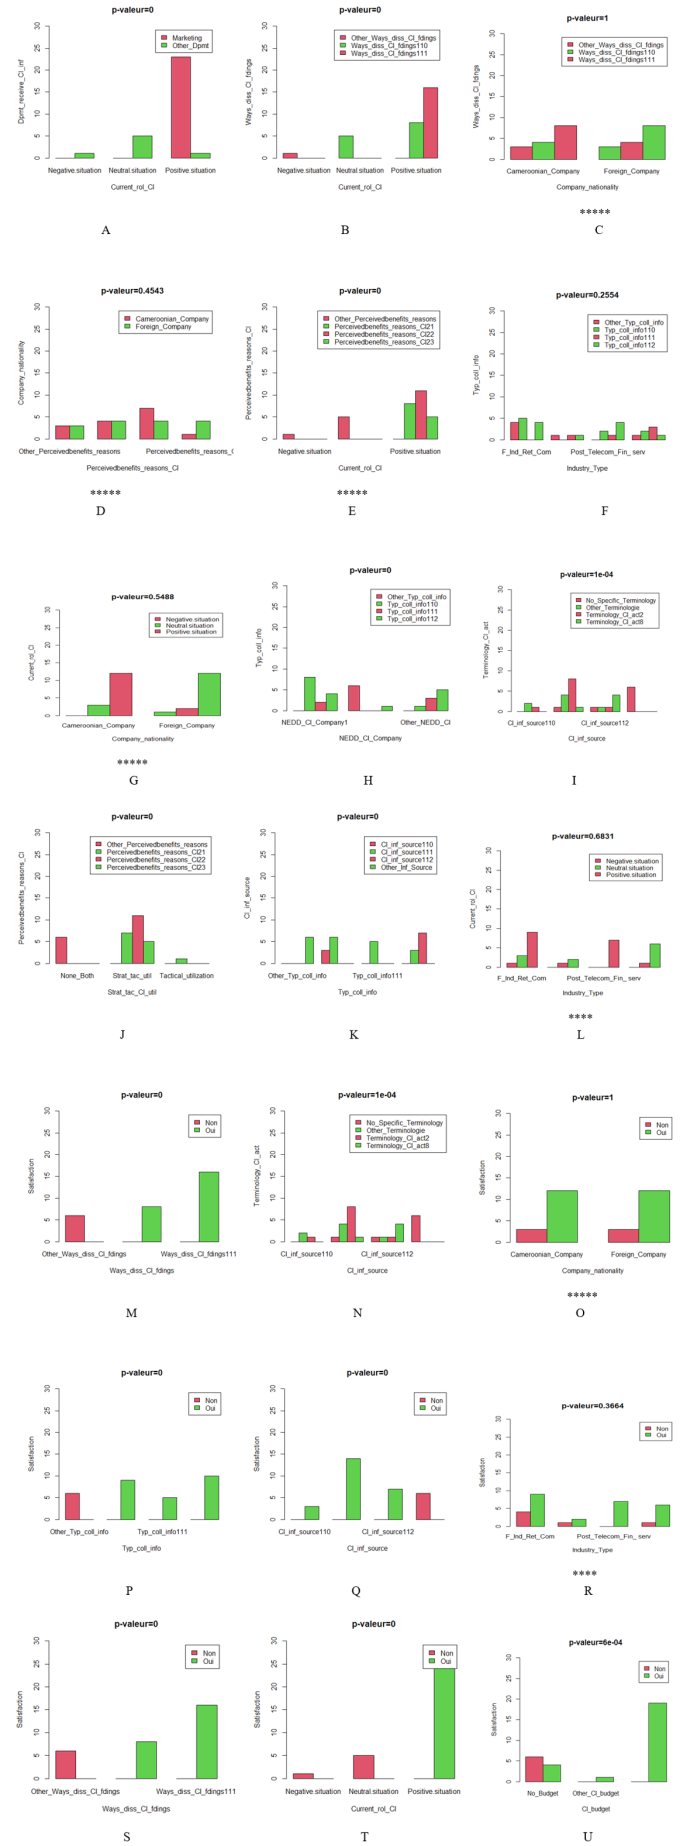
The table above highlights the relationships between certain variables in the study, analyzed in pairs using the Chi-square test. Cross-tabulations involving company nationality and industry sector show p-values greater than 0.05, indicating a weak correlation with the other variables. On the other hand, p-values below 0.05 were observed between variables related to satisfaction and the current role of CI with most of the other variables. This suggests that these elements have a significant influence on user satisfaction. Further analysis would provide a better understanding of their behavior and allow competitive intelligence strategies to be adjusted accordingly.
3.3.2. Analysis and Commentary on the Above Dependencies
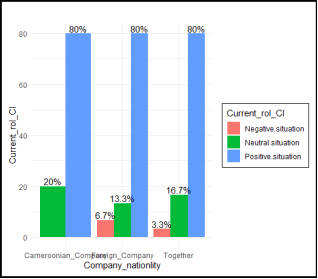
Figure 23. Analysis of the impact of CI according to company nationality.
The graph opposite illustrates the perceived impact of competitive intelligence (CI) on companies, based on their nationality. The results show that overall, 8 out of 10 CI users (80%) believe that this technology has a positive impact on their business. In Cameroon, 2 out of 10 companies (20%) take a neutral position, considering that competitive intelligence has no significant influence on their environment. Among foreign companies, 6.7% perceive a negative impact, while 13.7% remain neutral about the effect of competitive intelligence.
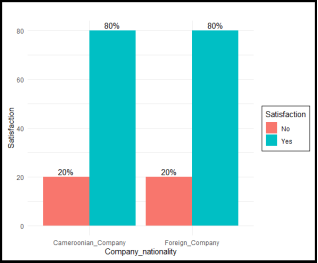
Figure 24. Analysis of CI user satisfaction by company nationality.
The graph opposite shows the level of satisfaction among CI users according to the nationality of the company. Overall, regardless of nationality, eight (08) out of ten (80%) CI users are satisfied.
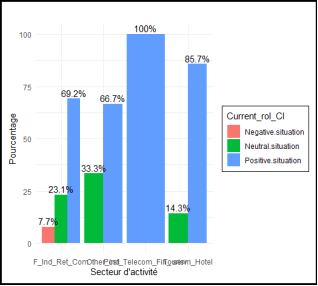
Figure 25. Breakdown of the current role of CI according to the sector of activity of companies.
The graph shows the current role of competitive intelligence (CI) according to the sector in which companies operate. It shows that:
1) Approximately 7.7% of companies operating in the agri-food and food retail sectors (F_Ind_Ret) perceive a negative impact from competitive intelligence;
2) In contrast, companies in the postal, telecommunications, and financial services sectors (Post_Telecom_Financial_serv) all report being positively impacted by competitive intelligence.
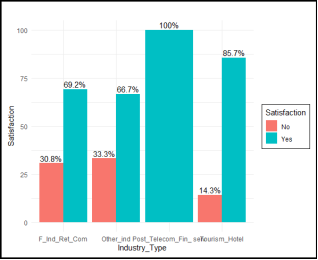
Figure 26. Analysis of CI user satisfaction by company sector.
This graph shows the level of satisfaction of companies with competitive intelligence, according to their sector of activity. It shows that:
1) Companies in the telecommunications and financial services sectors report complete satisfaction;
2) In contrast, companies in the retail, food distribution, and other services sectors report the highest levels of dissatisfaction. Approximately one in three (30%) of them respond negatively to the question about their satisfaction.
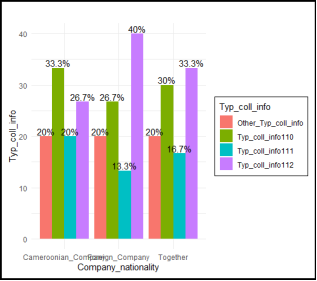
Figure 27. Breakdown of the type of information collected by nationality.
This graph illustrates the types of information collected by companies, based on their nationality. It shows that both Cameroonian and foreign companies collect various types of data related to competitive intelligence. In general:
1) 3.3% of companies collect data corresponding to Type_Collect_Info112, relating to strategies, marketing, and the global environment;
2) 33.3% collect Type_Collect_Info110 information, including products and services, prices and payment terms, market reports, marketing, distribution and sales, strategies, strengths/weaknesses, and suppliers.
It can be seen that Type_Collect_Info110 is mainly collected by Cameroonian companies, while Type_Collect_Info112 is more common among foreign companies. In addition, more than one in three Cameroonian companies also collect Type_Collecte_Info111 data, including products and services, prices, market reports, strengths and weaknesses, and financial data.
Among foreign companies, 2 out of 5 (40%) focus mainly on collecting strategic, marketing, and environmental data (Type_Collecte_Info112).
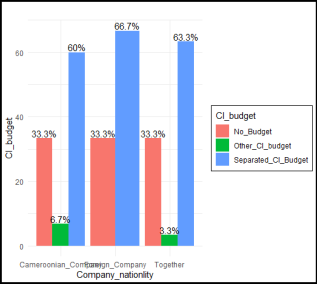
Figure 28. Breakdown of the CI budget by nationality.
The graph above shows the type of budget according to the nationality of the companies. We can see that:
1) In Cameroon, as elsewhere, around 6 out of 10 companies, or 60%, have a separate budget dedicated to CI activities;
2) Nearly three (3) out of 10 companies, or 33%, do not have a specific budget for CI activities;
3) Companies with other types of budgets are much more common in Cameroon and account for only 6.7% of companies.
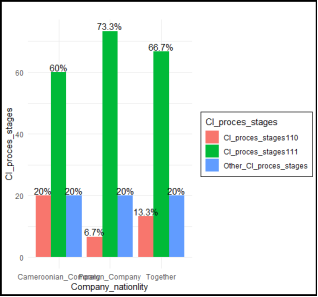
Figure 29. Stages of the CI process according to nationality.
This graph highlights the stages of the CI process by nationality. It shows that:
1) The CI_proces_stages111 process is the most widely used. It consists of collecting, processing, analyzing, sorting, capturing, and storing information. This process involves a total of six (06) companies out of (10), or 60% in Cameroon, and seven (07) companies out of 10 (73.3%) for foreign companies;
2) Two (02) companies out of (10) adopt other processes for the CI stages;
3) The CI_process_stages110 process consists of collecting, processing, sorting, capturing, and storing information. This process, which does not include the data analysis phase, concerns 20% of Cameroonian companies and 6.7% of foreign companies;
4) The CI_proces_stages111 process consists of collecting, processing, analyzing, sorting, capturing, and storing information.
Figure 30. Distribution of the current role of CI according to the department receiving CI information in companies.
This graph shows the current role of the CI according to the department that receives CI information within the company. It can be seen that all companies whose CI information is received by the Marketing department have a positive situation. Furthermore, seven (07) out of ten (10) companies, or 71% of those whose CI information is received by departments other than Marketing, consider the role of CI to be neutral.
Figure 31. Means of disseminating CI information according to company nationality.
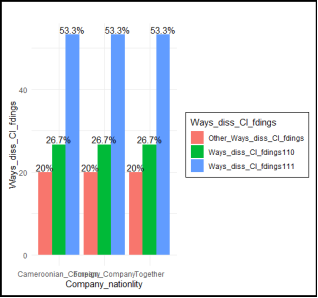
The graph shows how CI information is disseminated according to the nationality of the company. It can be seen that these methods are the same regardless of nationality:
1) More than half (53.3%) of companies use Ways_diss_CI_fding111. This method of dissemination includes email, newsletters, intranet, and conferences;
2) Companies disseminating their information via Ways_diss_CI_fding110 represent 26.7% of all companies. This method of dissemination involves SMS, email, and intranet;
3) Two (02) companies out of (10), or 20%, use methods of disseminating information other than SMS, intranet, email, newsletters, intranet, and conferences.
Figure 32. Hierarchical levels of companies by nationality.
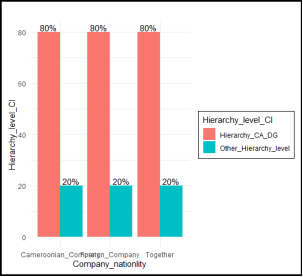
This graph illustrates the CI hierarchy levels according to company nationality. It shows that nearly four (04) out of five (05) companies, or 80%, have a hierarchy headed by the Board of Directors or the Chief Executive Officer.
Figure 33. Department/service that receives CI information in companies according to their nationality.
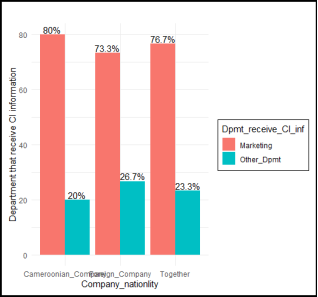
This graph highlights the departments used by companies when receiving information from the CI. It shows that this information is mainly received by the Marketing department. Overall, more than seven (07) out of ten (10) companies, or 76.9%, receive information from the CI through the Marketing department. In Cameroon, eight (08) out of ten (10) companies (80%) use this department to receive their information.
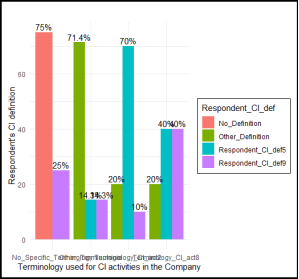
Figure 34. Definition of CI according to the terminology used for CI activities within the company.
This graph shows the link between the definition and terminology used for CI activities within the company. It shows that:
1) More than 7 out of 10 companies (75%) that do not have specific terminology also do not have an appropriate definition of CI;
2) Approximately 7 out of 10 companies (71.4%) that have other terminology also propose other definitions for CI;
3) Nearly 7 out of 10 companies (70%) with the terminology Business Intelligence (terminology_CI_act2) define CI as the collection of information on competitors and the assessment of the entire competitive environment (Respondent_Ci_def5);
4) Of the 10 companies with the terminology Analysis of information gathered and Evaluation of the entire competitive environment (terminology_CI_act8), four (40%) define CI as the evaluation of the entire competitive environment (Respondent_Ci_def9), while another four (40%) give this term the definition (Respondent_Ci_def5) of collecting information on competitors and evaluating the entire competitive environment.
The purpose of this section was to analyze the links between the study variables. The Chi-square test was used to demonstrate the existence of significant or insignificant links between the variables/modalities. The various graphs also confirmed these links. The results obtained do not allow us to measure the discriminatory power of the variables/modalities. Nor do they allow us to highlight the similarities between the variables on the one hand and the companies on the other. Discriminant analysis and multiple component analysis (MCA) will allow us to better identify these simi.
3.4. Analysis of Variable Discrimination on the Main Axes
In the context of analyzing the implementation of CI in companies, discriminant analysis was used to identify the most decisive variables. This method aims to classify variables according to their impact on the distinction between groups using CI. In other words, it identifies the characteristics that play a key role in companies' decisions to adopt CI.
3.4.1. Ranking of Variables According to Their Discriminatory Power
The table below ranks the variables according to their discriminatory power on the first two axes. The most discriminatory variables have been ranked according to their influence on the first two discriminatory dimensions. This table shows that the variables NEDD_CI_Company, perceived_benefits_reasons_CI, Current_rol_CI, Dpmt_receive_CI_inf, initiatives_CI_activities, and Respondent_CI_def are the most discriminating on the first two axes of analysis and have a significant influence on the other variables. The nationality of companies does not greatly discriminate between the other variables.
The variable Current_rol_CI, while influenced by the other variables, is strongly influenced by the number of employees directly involved in CI (NEDD_CI_Company) in the company and the perceived benefits of CI and reasons for its use (Perceivedbenefits_reasons_CI).
Table 2. Ranking of variables according to their discriminatory power.

Short name of the variable

Long name of the variable

Discrimination coefficient (%)

NEDD_CI_Company

Number of Employees Directly Involved at CI in the Company

18,8131092

Perceivedbenefits_reasons_CI

Perceived benefits of CI and reasons for its use

16,0617123

Current_rol_CI

CI actual role

8,57950772

Satisfaction

User satisfaction

8,33581542

Company_size

Company_size

7,56421347

Dpmt_receive_CI_inf

Departments that receive CI information within the company

7,22084913

Respondent_CI_def

Definition of the CI term by the respondent

6,04771508

initiatives_CI_activities

Structural drivers behind CI activities

5,70565709

Dept_Responsible_CI

Department responsible for CI

3,77642146

Ways_diss_CI_fdings

Means of disseminating CI results

2,91523901

Typ_coll_info

Type of information collected

2,32931095

Strat_tac_CI_util

Strategic or tactical use of CI

2,17211895

Hierarchy_level_CI

Hierarchical level of CI information receiver

1,97737199

Company_Age

Company age

1,7523389

CI_inf_source

CI information sources

1,66517368

Position_responsible_CI

Title of the person responsible for the CI in the company

1,54798969

CI_proces_stages

CI process stages

1,09979007

Terminology_CI_act

Terminology used for CI activities within the company

0,94160755

Industry_Type

Industry type

0,92751882

CI_budget

CI Budget

0,56653943

Company_nationality

Company_nationality

2,43E-31

This table allows hierarchical classification of variables.
3.4.2. Spatial Representation of Variables and Similarity Analysis
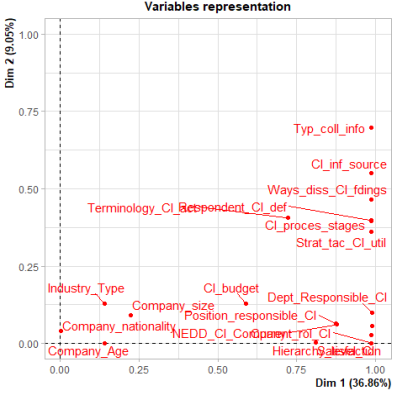
Figure 35. Spatial representation of study variables.
Spatial representation of study variables Dendrogram of variables.
The spatial representation of variables reveals two main axes (dimensions) that account for approximately 46% of the total information:
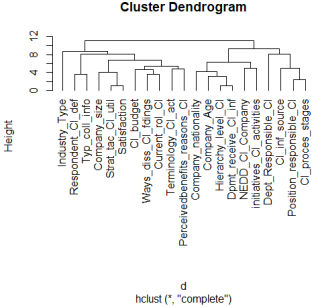
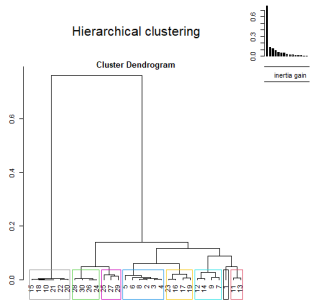
Figure 36. Dendrogram of variable.
Hierarchical classification of variables is a process in which the variables in the study are grouped according to their similarity in the data. It can help to reduce the dimensions of the study. The method for this classification consists of making a spatial representation of the variables and then grouping them using a dendrogram.
1) Variables strongly correlated with the first axis (Dim1) are well represented there. These include: Current_rol_CI, Company_Age, NEDD_CI_Company, Initiative_CI_activities, among others;
2) Similarly, variables close to the second axis (Dim2), such as CI_info_source and Typ_Coll_info, are better projected on it;
3) It can also be observed that the further a variable is from the first axis, the better it is represented on the second.
3.5. Hierarchical Classification of Qualitative Variables
The dendrogram resulting from hierarchical clustering highlights groupings of qualitative variables based on their similarity, probably calculated using Gower's distance. This approach makes it possible to:
1) Identify highly similar or redundant variables;
2) Reduce the size of the analysis by retaining, if necessary, one representative variable per group.
3.5.1. Interpretation of the Dendrogram
Each name displayed at the base of the graph corresponds to a qualitative variable (e.g., CI_info_source, Typ_coll_info, Company_nationality, etc.);
1) The height of the branches indicates the proximity between variables: the closer two variables are connected, the more similar their behavior (close distribution of modalities).
2) For example, the variables Satisfaction, Strat_tac_CI_util, and Company_size form a homogeneous group, suggesting that they convey comparable information.
This type of analysis thus contributes to better structuring an interpretation of qualitative data.
3.5.2. Analysis of Factors Influencing the Implementation of CI
(i). Analysis of Proximities Between Modalities
This section aims to visualize the proximities between the modalities of the different variables. To do this, Multiple Correspondence Analysis (MCA) is used to project these modalities onto the main axes of the analysis. The modalities that contribute significantly to the formation of each axis will be grouped together in order to analyze the contrasts and similarities between them. This approach makes it possible to better identify the similarities and differences between the modalities and to identify the key factors likely to influence the implementation of competitive intelligence within companies.
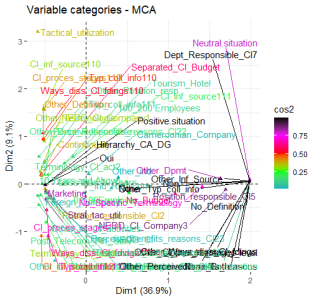
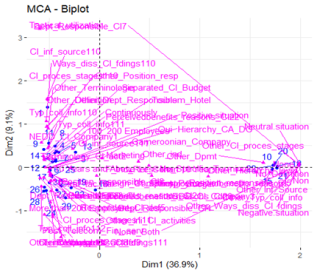
Figure 37. Representation of the scatter plot of modalities on the main axes.
(ii). Visualization of Modalities on Factor Axes
This graph represents the scatter plot of modalities from the study, projected onto the two main factor axes, which alone account for nearly 46% of the total information.
The analysis highlights a marked contrast between satisfied companies, which perceive a positive impact from competitive intelligence (CI), and those that are dissatisfied or believe that CI has no impact or a negative impact.
Modalities that are similar or close in behavior tend to cluster together, reflecting consistency in responses.
It is important to note that this graph only illustrates the distribution of modalities in the factorial space. It does not, on its own, allow us to assess the quality of their representation, their exact coordinates, or their contribution to the construction of the axes.
Further analysis will be necessary to deepen the interpretation of the modalities associated with each axis.
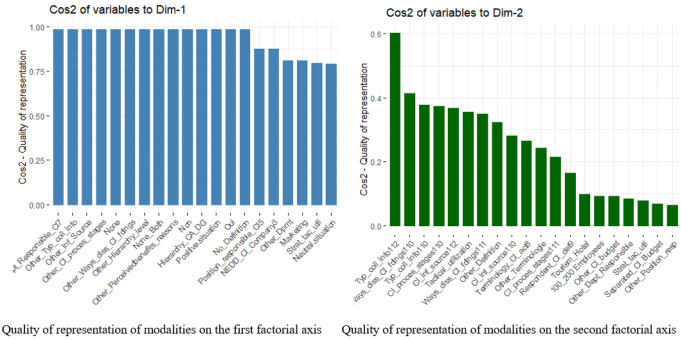
(iii). Quality of Representation of the Different Modalities on the Axes
The quality of representation of a modality on a dimension is marked by the value of its cos2 on that dimension. The higher the Cos2 and the closer it is to 1, the better the modality is represented. The table below gives the Cos2 value (rounded to the nearest hundredth) for each modality in the first five axes. The graphs show the 20 modalities best represented on the first two factorial axes.
Figure 38. The quality of representation on each of the axes.
Each axis shows variables with similar behaviors. The cos2 table allows for a better assessment of the quality of representation on each of the five axes.
Table 3. Quality of representation of modalities on the axes.

Dim 1

Dim 2

Dim 3

Dim 4

Dim 5

Cameroonian_Company

0

0,04

0,26

0,05

0,02

Foreign_Company

0

0,04

0,26

0,05

0,02

01_99Employes

0,21

0,03

0,15

0,07

0

100_200 Employees

0,04

0,09

0,06

0,13

0,01

More than 200 Employees

0,11

0,02

0,52

0,01

0,02

F_Ind_Ret_Com

0,07

0,01

0,05

0,2

0,23

Other_ind

0,02

0

0

0,25

0,04

Post_Telecom_Fin_ serv

0,1

0,06

0,45

0

0

Tourism_Hotel

0,01

0,1

0,14

0,03

0,17

10 Years and Above

0,14

0

0,26

0,04

0,03

Less than 10 Years

0,14

0

0,26

0,04

0,03

No_Definition

0,99

0

0

0

0

Other_Definition

0,1

0,32

0,09

0,01

0,13

Respondent_CI_def5

0,12

0,05

0,08

0,25

0,09

Respondent_CI_def9

0,06

0,16

0

0,47

0

No_Specific_Terminology

0,72

0

0,01

0,07

0,05

Other_Terminologie

0,08

0,24

0,04

0

0,25

Terminology_CI_act2

0,14

0

0,03

0,14

0,26

Terminology_CI_act8

0,04

0,26

0,02

0,01

0,11

Other_Position_resp

0,07

0,06

0,24

0,2

0,07

Position_responsible_CI2

0,37

0,02

0,13

0,06

0,05

Position_responsible_CI5

0,87

0

0

0,01

0

Dept_Responsible_CI3

0,15

0,03

0,01

0

0,14

Dept_Responsible_CI4

0,04

0,02

0,25

0,16

0,1

Dept_Responsible_CI7

0,99

0

0

0

0

Other_Dept_Responsible

0,09

0,08

0,08

0,13

0,01

NEDD_CI_Company1

0,27

0,06

0,29

0,04

0,1

NEDD_CI_Company3

0,87

0

0

0,01

0

Other_NEDD_CI

0,09

0,04

0,34

0,09

0,15

No_Budget

0,59

0,02

0,02

0,01

0,03

Other_CI_budget

0,01

0,09

0,1

0,11

0,04

Separated_CI_Budget

0,52

0,07

0,07

0

0,05

Other_Typ_coll_info

0,99

0

0

0

0

Typ_coll_info110

0,12

0,38

0

0,06

0,25

Typ_coll_info111

0,05

0,04

0

0,01

0,68

Typ_coll_info112

0,11

0,6

0

0,09

0,03

CI_inf_source110

0,03

0,28

0,09

0,02

0,1

CI_inf_source111

0,19

0,03

0

0,36

0,15

CI_inf_source112

0,09

0,37

0,02

0,34

0,05

Other_Inf_Source

0,99

0

0

0

0

CI_proces_stages110

0,04

0,37

0,01

0,09

0,13

CI_proces_stages111

0,48

0,21

0,02

0,06

0,06

Other_CI_proces_stages

0,99

0

0

0

0

Continuously

0,34

0,03

0,27

0,07

0

None

0,99

0

0

0

0

Other_ini_CI_activities

0,06

0,05

0,41

0,11

0

Other_Ways_diss_CI_fdings

0,99

0

0

0

0

Ways_diss_CI_fdings110

0,1

0,41

0,02

0,01

0,15

Ways_diss_CI_fdings111

0,26

0,35

0,04

0

0,12

Hierarchy_CA_DG

0,99

0

0

0

0

Other_Hierarchy_level

0,99

0

0

0

0

Marketing

0,81

0

0,04

0

0,01

Other_Dpmt

0,81

0

0,04

0

0,01

None_Both

0,99

0

0

0

0

Strat_tac_util

0,8

0,08

0

0,03

0,01

Tactical_utilization

0,01

0,35

0

0,13

0,02

Other_Perceivedbenefits_reasons

0,99

0

0

0

0

Perceivedbenefits_reasons_CI21

0,09

0,01

0,08

0,13

0,01

Perceivedbenefits_reasons_CI22

0,15

0,02

0,02

0

0,06

Perceivedbenefits_reasons_CI23

0,05

0

0,18

0,15

0,04

Negative.situation

0,13

0

0,01

0

0

Neutral.situation

0,79

0

0

0

0

Positive.situation

0,99

0

0

0

0

No

0,99

0

0

0

0

Yes

0,99

0

0

0

0

The Cos2 table shows the following information for the first factor axis:
1) The modalities No_Definition, No_Specific_Terminology, Position_responsible_CI5, No_Budget, NEDD_CI_Company3, Separated_CI_Budget, Other_Typ_coll_info, Other_Inf_Source, Other_CI_proces_stages, None, Other_Ways_diss_CI_fdings Hierarchy_CA_DG, Other_Hierarchy_level, Marketing, Other_Dpmt,
2) None_Both, Strat_tac_util, Other_Perceivedbenefits_reasons, Neutral.situation, Positive.situation, Satisfaction (Yes) and Satisfaction (No);
3) The modalities relating to the nationality of companies and the sector of activity are poorly represented (low Cos2 values) on the axes. This information confirms the weak links that were noted in the previous paragraphs;
4) Only the first axis allows for interpretation of CI user satisfaction and the current role of CI in companies;
5) The quality of representation deteriorates as we move away from the first axis.
On the second factor axis, the following modalities are better represented:
Other_Definition, Respondent_CI_def9, Other_Terminology, Terminology_CI_act8, Typ_coll_info110, CI_inf_source110, CI_inf_source112, CI_proces_stages110, CI_proces_stages111, Ways_diss_CI_fdings110, Ways_diss_CI_fdings111, and Tactical_utilization.
The following modalities are better represented in the third factor axis
Cameroonian_Company, Foreign_Company, More than 200 Employees, Post_Telecom_Fin_ serv, 10 Years and Above, Less than 10 Years, Other_Position_resp, Dept_Responsible_CI4, NEDD_CI_Company1, Other_NEDD_CI, Continuously, and Other_ini_CI_activities. The modalities on the current role of the CI are poorly represented and cannot help in the interpretation of this axis.
The evaluation of contributions will provide a better understanding of the modalities that have contributed most to the formation of each axis.
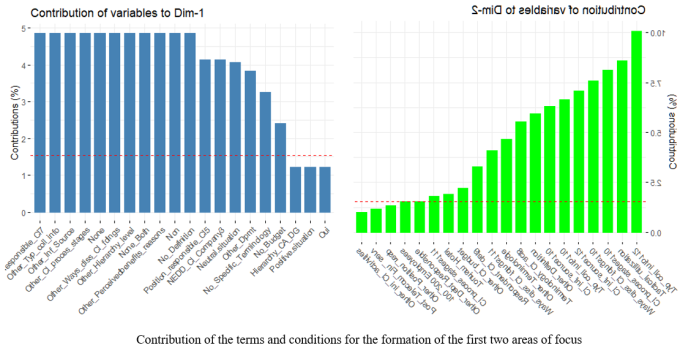
(iv). Contribution of Modalities to the Formation of Different Axes
Figure 39. Contribution of modalities to the formation of factorial axes.
The graphs above show the contribution of modalities to the axes. Kaizer's rule allows us to target the modalities that contribute significantly to the formation of each axis. According to this rule, modalities below the red bar contribute little to the formation of the axes.
Table 4. Contribution of modalities to the formation of different axes.

Dim 1

Dim 2

Dim 3

Dim 4

Dim 5

Cameroonian_Company

0

0,53

3,6

0,76

0,29

Foreign_Company

0

0,53

3,6

0,76

0,29

01_99Employes

0,73

0,41

2,38

1,23

0,02

100_200 Employees

0,14

1,54

1,02

2,82

0,22

More than 200 Employees

0,5

0,37

10,95

0,25

0,58

F_Ind_Ret_Com

0,25

0,1

0,83

3,75

4,54

Other_ind

0,09

0,04

0,01

7,44

1,3

Post_Telecom_Fin_ serv

0,48

1,18

9,36

0

0

Tourism_Hotel

0,04

1,9

3,04

0,68

4,38

10 Years and Above

0,32

0,01

2,57

0,52

0,35

Less than 10 Years

0,55

0,01

4,44

0,9

0,6

No_Definition

4,86

0,02

0,1

0,01

0

Other_Definition

0,45

5,94

1,85

0,24

3,22

Respondent_CI_def5

0,48

0,76

1,42

5,51

2,15

Respondent_CI_def9

0,29

3,28

0,08

12,19

0,04

No_Specific_Terminology

3,26

0,03

0,25

1,6

1,18

Other_Terminologie

0,38

4,66

0,75

0,11

6,7

Terminology_CI_act2

0,59

0

0,52

2,99

5,97

Terminology_CI_act8

0,22

5,52

0,4

0,2

3,12

Other_Position_resp

0,34

1,33

5,36

5,32

1,98

Position_responsible_CI2

0,92

0,17

1,46

0,84

0,74

Position_responsible_CI5

4,14

0,09

0

0,23

0,04

Dept_Responsible_CI3

0,63

0,45

0,21

0

3,23

Dept_Responsible_CI4

0,19

0,48

5,5

4,29

2,9

Dept_Responsible_CI7

4,86

0,02

0,1

0,01

0

Other_Dept_Responsible

0,42

1,55

1,57

3

0,26

NEDD_CI_Company1

0,9

0,77

4,29

0,7

1,91

NEDD_CI_Company3

4,14

0,09

0

0,23

0,04

Other_NEDD_CI

0,37

0,68

6,59

2,16

3,59

No_Budget

2,42

0,39

0,41

0,22

0,63

Other_CI_budget

0,03

2,21

2,6

3,47

1,18

Separated_CI_Budget

1,18

0,63

0,7

0,01

0,68

Other_Typ_coll_info

4,86

0,02

0,1

0,01

0

Typ_coll_info110

0,51

6,63

0,03

1,36

6

Typ_coll_info111

0,27

0,81

0,04

0,29

19,67

Typ_coll_info112

0,44

10,07

0,04

1,97

0,63

CI_inf_source110

0,17

6,32

2,22

0,67

3,16

CI_inf_source111

0,63

0,4

0

6,23

2,72

CI_inf_source112

0,43

7,07

0,36

8,36

1,31

Other_Inf_Source

4,86

0,02

0,1

0,01

0

CI_proces_stages110

0,22

8,11

0,27

2,58

3,76

CI_proces_stages111

1

1,8

0,16

0,61

0,73

Other_CI_proces_stages

4,86

0,02

0,1

0,01

0

Continuously

0,98

0,4

3,41

1,13

0

None

4,86

0,02

0,1

0,01

0

Other_ini_CI_activities

0,26

0,99

8,29

2,56

0

Other_Ways_diss_CI_fdings

4,86

0,02

0,1

0,01

0

Ways_diss_CI_fdings110

0,46

7,59

0,46

0,2

3,87

Ways_diss_CI_fdings111

0,76

4,1

0,45

0,06

1,89

Hierarchy_CA_DG

1,22

0

0,02

0

0

Other_Hierarchy_level

4,86

0,02

0,1

0,01

0

Marketing

1,17

0,02

0,24

0

0,07

Other_Dpmt

3,83

0,07

0,78

0

0,24

None_Both

4,86

0,02

0,1

0,01

0

Strat_tac_util

1,15

0,45

0,02

0,22

0,04

Tactical_utilization

0,07

8,59

0,01

4,01

0,81

Other_Perceivedbenefits_reasons

4,86

0,02

0,1

0,01

0

Perceivedbenefits_reasons_CI21

0,4

0,27

1,58

2,99

0,26

Perceivedbenefits_reasons_CI22

0,58

0,32

0,28

0,04

1,38

Perceivedbenefits_reasons_CI23

0,24

0,1

4,12

4,04

1,27

Negative.situation

0,79

0,01

0,32

0,05

0,04

Neutral.situation

4,07

0,03

0,01

0,05

0

Positive.situation

1,22

0

0,02

0

0

No

4,86

0,02

0,1

0,01

0

Yes

1,22

0

0,02

0

0

Total contribution

70,46

77,88

61,6

64,61

58,51

Modalities: No_Definition, No_Specific_Terminology, Position_responsible_CI5, NEDD_CI_Company3, No_Budget, Other_Typ_coll_info, Other_Typ_coll_info, Other_Inf_Source, Other_CI_proces_stages Other_Ways_diss_CI_fdings, Other_Hierarchy_level, Other_Dpmt, None_Both, Other_Perceivedbenefits_reasons, Neutral.situation contributed 76.46% to the formation of the first factor axis.
1) In the second area, the following factors contributed to 78% of its formation Other_Definition, Respondent_CI_def9 Other_Terminologie, Terminology_CI_act8, Typ_coll_info110, Typ_coll_info111, CI_inf_source110, CI_inf_source112, CI_proces_stages110, Ways_diss_CI_fdings110, Ways_diss_CI_fdings111, and Tactical_utilization. The Satisfaction (Yes) and Positive Situation modalities are very poorly represented and will not help in interpreting this axis.
2) In the third area, the following factors contributed to more than 61% of its formation: Cameroonian_Company, Foreign_Company, More than 200 Employees, Post_Telecom_Fin_ serv, 10 Years and Above, Less than 10 Years, Other_Position_resp, Dept_Responsible_CI4, NEDD_CI_Company1, Other_NEDD_CI, Continuously et Other_ini_CI_activities.
(v). Evaluation of Variable Coordinates on the Main Axes
Table 5. Representation of mode coordinates on the different axes.

Dim 1

Dim 2

Dim 3

Dim 4

Dim 5

Cameroonian_Company

0,03

0,2

-0,51

0,22

0,13

Foreign_Company

-0,03

-0,2

0,51

-0,22

-0,13

01_99Employes

0,52

-0,19

-0,45

-0,3

0,04

100_200 Employees

-0,26

0,43

-0,33

0,51

0,14

More than 200 Employees

-0,59

-0,25

1,31

-0,18

-0,27

F_Ind_Ret_Com

0,31

-0,1

-0,26

-0,52

-0,55

Other_ind

0,39

0,13

-0,07

1,51

0,61

Post_Telecom_Fin_ serv

-0,58

-0,45

1,21

0,01

0,02

Tourism_Hotel

-0,16

0,57

-0,69

0,3

0,74

10 Years and Above

-0,28

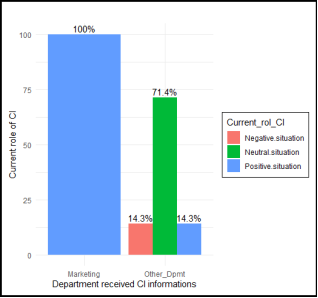
-0,02

0,39

0,16

0,13

Less than 10 Years

0,49

0,04

-0,67

-0,28

-0,22

No_Definition

1,99

0,06

0,13

0,04

-0,01

Other_Definition

-0,52

0,94

-0,5

-0,17

-0,59

Respondent_CI_def5

-0,48

-0,3

0,4

-0,71

0,43

Respondent_CI_def9

-0,49

-0,81

-0,12

1,37

0,08

No_Specific_Terminology

1,41

-0,06

-0,18

0,43

0,36

Other_Terminologie

-0,51

0,89

-0,34

0,12

-0,91

Terminology_CI_act2

-0,54

0

0,24

-0,53

0,72

Terminology_CI_act8

-0,46

-1,15

0,3

0,19

-0,74

Other_Position_resp

-0,58

0,56

1,08

0,99

-0,59

Position_responsible_CI2

-0,5

-0,11

-0,3

-0,21

0,19

Position_responsible_CI5

1,7

-0,13

-0,01

-0,17

-0,07

Dept_Responsible_CI3

-0,55

-0,23

0,15

-0,01

0,53

Dept_Responsible_CI4

-0,39

-0,31

-1

-0,81

-0,65

Dept_Responsible_CI7

1,99

0,06

0,13

0,04

-0,01

Other_Dept_Responsible

-0,5

0,48

0,46

0,59

-0,17

NEDD_CI_Company1

-0,56

0,26

0,58

-0,21

-0,34

NEDD_CI_Company3

1,7

-0,13

-0,01

-0,17

-0,07

Other_NEDD_CI

-0,45

-0,3

-0,9

0,47

0,59

No_Budget

1,08

-0,22

-0,21

-0,14

0,23

Other_CI_budget

-0,38

-1,62

-1,69

1,79

1,01

Separated_CI_Budget

-0,55

0,2

0,2

-0,02

-0,18

Other_Typ_coll_info

1,99

0,06

0,13

0,04

-0,01

Typ_coll_info110

-0,52

0,94

-0,06

-0,37

-0,76

Typ_coll_info111

-0,51

0,44

0,09

-0,23

1,85

Typ_coll_info112

-0,46

-1,1

-0,07

0,43

-0,23

CI_inf_source110

-0,52

1,59

-0,9

0,45

-0,96

CI_inf_source111

-0,47

0,19

0,02

-0,64

0,41

CI_inf_source112

-0,55

-1,1

0,24

1,05

-0,4

Other_Inf_Source

1,99

0,06

0,13

0,04

-0,01

CI_proces_stages110

-0,52

1,56

0,27

0,77

0,9

CI_proces_stages111

-0,49

-0,33

-0,09

-0,17

-0,18

Other_CI_proces_stages

1,99

0,06

0,13

0,04

-0,01

Continuously

-0,55

0,17

0,48

0,26

0

None

1,99

0,06

0,13

0,04

-0,01

Other_ini_CI_activities

-0,4

-0,39

-1,07

-0,54

0,01

Other_Ways_diss_CI_fdings

1,99

0,06

0,13

0,04

-0,01

Ways_diss_CI_fdings110

-0,53

1,06

0,25

-0,15

0,65

Ways_diss_CI_fdings111

-0,48

-0,55

-0,18

0,06

-0,32

Hierarchy_CA_DG

-0,5

-0,01

-0,03

-0,01

0

Other_Hierarchy_level

1,99

0,06

0,13

0,04

-0,01

Marketing

-0,5

-0,03

-0,11

0

0,05

Other_Dpmt

1,63

0,11

0,35

0,01

-0,17

None_Both

1,99

0,06

0,13

0,04

-0,01

Strat_tac_util

-0,49

-0,15

-0,03

-0,09

0,04

Tactical_utilization

-0,59

3,2

-0,11

1,92

-0,84

Other_Perceivedbenefits_reasons

1,99

0,06

0,13

0,04

-0,01

Perceivedbenefits_reasons_CI21

-0,49

-0,2

-0,47

0,59

0,17

Perceivedbenefits_reasons_CI22

-0,51

0,19

-0,17

-0,06

-0,33

Perceivedbenefits_reasons_CI23

-0,48

-0,16

0,95

-0,86

0,47

Negative.situation

1,96

-0,11

0,6

-0,21

-0,18

Neutral.situation

1,99

0,09

0,04

0,09

0,02

Positive.situation

-0,5

-0,01

-0,03

-0,01

0

No

1,99

0,06

0,13

0,04

-0,01

Yes

-0,5

-0,01

-0,03

-0,01

0

The table above shows the coordinates of the modalities on the different axes.
On the first axis, we see that the modalities Cameroonian company, No_Definition, No_Specific_Terminology, Position_responsible_CI5, NEDD_CI_Company3, No_Budget, Other_Typ_coll_info, Other_Typ_coll_info, Other_Inf_Source, Other_CI_proces_stages Other_Ways_diss_CI_fdings, Other_Hierarchy_level, Other_Dpmt, None_Both, Other_Perceivedbenefits_reasons, Neutral.situation, and Satisfaction (Non) are opposed to all other modalities. These are, in a sense, Cameroonian companies that are dissatisfied with competitive intelligence and tend to oppose foreign companies that view the current role of CI positively and are satisfied with its use.
For information, Cameroonian companies that are dissatisfied with the use of CI are those with the following profile:
1) No terminology for competitive intelligence;
2) No appropriate definition of the term;
3) No specific budget dedicated to CI;
4) The Marketing Intelligence Manager is the only person responsible for CI within the company;
5) Departments that receive CI information within the company are other than marketing;
6) No one is specifically involved in CI within the company at any time;
7) These companies tend to use other sources of information and collect information other than foreign companies.
As a recommendation, Cameroonian companies that are dissatisfied with CI should:
1) Review the definition of CI and the terminology used for CI activities within the company;
2) Establish a budget for CI activities;
3) Increase the number of staff monitoring CI activities and involve the marketing department in receiving CI-related information;
4) Improve their sources of information and review their means of disseminating information.
The second axis reveals that:
1) Modalities (terms) Other_Definition, Other_Terminologie, Typ_coll_info110, CI_proces_stages110, Ways_diss_CI_fdings110 and Tactical_utilization are contrary to the modalities (terms) Respondent_CI_def9 Terminology_CI_act8, Typ_coll_info111, CI_inf_source110, CI_inf_source112 and Ways_diss_CI_fdings111.
2) Despite their poor representation quality, the (modalities) terms and conditions Negative.situation Foreign_Company are contrary to Neutral.situation, Cameroonian_Company and satisfaction (No).
3) Cameroonian companies that are dissatisfied with CI and neutral about the current role of CI are very close to the terms and conditions (modalities) Other_Definition, Other_Terminologie, Typ_coll_info110, CI_proces_stages110, Ways_diss_CI_fdings110 and Tactical_utilization.
4) Foreign companies that are dissatisfied with CI and have a negative view of the current role of CI are close to the terms and conditions (modalities) Respondent_CI_def9 Terminology_CI_act8, Typ_coll_info111, CI_inf_source110, CI_inf_source112 and Ways_diss_CI_fdings111.
The second factor axis shows the profile of companies that are dissatisfied with the use of CI and remain neutral or find the current role of CI negative. These companies generally face several difficulties, including:
1) No terminology used for CI activities within the company or use terms such as Economic Intelligence (Terminology_CI_act8);
2) No suitable definition of the term CI or defining it as an assessment of the entire competitive environment;
3) Using CI solely for tactical purposes (Tactical_utilization).
The third factor axis captures the following information:
The terms and conditions Cameroonian_Company, Less than 10 Years, Dept_Responsible_CI4, Other_NEDD_CI and Other_ini_CI_activities which perfectly oppose to the Foreign_Company, More than 200 Employees, Post_Telecom_Fin_ serv, 10 Years and Above, Other_Position_resp, NEDD_CI_Company1, Continuously.
This information can be summarized as follows:
Certain foreign companies are in direct conflict with Cameroonian companies. These companies have the following profiles:
1) Foreign companies
a) Sector of activity: Postal and telecommunications or financial services;
b) Number of employees greater than 200;
c) Number of years in existence: 10 years or more;
d) Other title: the person responsible for CI in the company;
e) More than one person fully involved in CI in the company;
f) Continuity of the structural driving forces behind CI activities.
2) Cameroonian companies
a) Number of years in existence: Less than 10 years;
b) Department (service) in charge of CI: Marketing-sales;
c) Number of people fully involved in CI in the company: Other
d) Other structural driving forces behind CI activities.
The aim of this section was to identify factors that could hinder the implementation of competitive intelligence in companies, as well as similarities between groups of variables. The analysis was carried out on five dimensions. The first presented the profiles necessary for companies to be positively impacted by CI. The other dimensions showed contrasts between the variables.
In summary, analysis of the similarities between the methods identified certain factors contributing to the satisfaction or dissatisfaction of companies using competitive intelligence. It appears that dissatisfied companies generally have the following profiles:
1) No terminology for competitive intelligence;
2) No appropriate definition of the term CI;
3) No specific budget dedicated to CI;
4) The Marketing Intelligence Manager is the only person responsible for CI within the company;
5) Departments that receive CI information within the company are other than marketing;
6) No one is specifically involved in CI within the company at any time;
7) These companies tend to use other sources of information and collect information other than from foreign companies.
8) The next paragraph will establish the similarities between respondents and modalities, representing the answers to the various questions in order to target issues related to a group and propose solutions.
(vi). Analysis of Similarities Between Respondents and Survey Modalities
This section aims to group respondents according to their proximity to certain modalities. As the survey was conducted anonymously, numbers from 01 to 30 were assigned to respondents according to the order in which they appeared in the database.
Scatter plot of individuals and study modalities on the first two axes.
Figure 40. Scatter plot between modalities and respondents.
Figure 41. Classification of respondents according to their similarities.
This dendrogram represents a hierarchical classification of the 30 observations into 8 distinct groups, based on qualitative variables (such as Industry Type, Company_Age, etc.). It illustrates how individuals are grouped according to their similarities, measured by a distance (probably Gower's).
The branches indicate the degree of similarity between individuals: the lower the junction, the more similar the elements are. The colors differentiate the six homogeneous clusters identified.
It can be seen that the other groups formed by the individuals on the left of the scatter plot have a positive perception of competitive intelligence in their companies. Furthermore, individuals (companies) 22, 18, 21, 20, 10, and 15 are either neutral about the impact of CI in their companies or find this impact negative. A solution can be found by identifying their common profiles in terms of the conditions around them and then providing solutions based on the profile of the groups that have a positive feeling about competitive intelligence. Individual 01 has a particular character compared to the others. This individual uses other modalities in terms of the definition of CI, the position of the CI manager, and the department in charge of CI, and is positively impacted.
This analysis makes it possible to:
1) Detect typical profiles;
2) Identify unexpected similarities;
3) And simplify the study of data by grouping it by segments rather than individually.
In summary, the dendrogram structures qualitative data to facilitate its reading, interpretation, and use.
4. Discussion
In this section, the wide propensities within Cameroonian companies’ Competitive Intelligence activities and the similarities as well as the differences between the companies surveyed are going to be pinpoint.
This study main purpose was to provide an opening insight regarding Competitive Intelligence practices within the companies operating into the Cameroonian business environment. Qualitative method based on questionnaire is the research method utilized.
Developed countries counting USA, Japan, France, Germany, Great Britain etc. are the ones where Competitive Intelligence is most adopted and used by companies and in the mentioned countries, Competitive intelligence is already recognized as a business practice that achieve competitive advantage . The practice of Competitive Intelligence in developed countries shall not be the same as it experienced in Cameroon. The true is that, Competitive Intelligence in Cameroon is new, an underdeveloped business discipline and still needs time to fully develop.
The predominant interpretation on Competitive Intelligence among companies present in Cameroun necessitates further developments. Researchers should in future closely focus into the mutual understanding of Competitive intelligence amongst managers of companies operating in Cameroon business environment. They may further examine the reasons for principally centering on data gathering when defining Competitive Intelligence as findings stated that Competitive Intelligence has many names and flavors. Future research may focus on the distinction of the level of the use of Competitive intelligence term in both Cameroonian official languages (French and English).
The findings of this study related to organizational set-up corroborate some preceding study findings. for example identified a broad range of different Competitive Intelligence set-ups within the surveyed companies that are ranging from fully separate Competitive Intelligence departments to part-time practitioners incorporated into the marketing department. Conversely, specific budgets are allowed to CI by most of the companies. It’s fundamentally established that few companies operating in the Cameroonian business environment had a formal Competitive Intelligence set-up as identified informal Competitive Intelligence set-up. This situation is not surprising as a tiny marginal of companies employ fully dedicated Competitive Intelligence practitioners. As there is no broad accepted CI definition , terminology is also different from company to another even though the term CI is the most ordinary used. Competitive Intelligence activities are predominantly carried out by marketing and market research staff on occasional or part-time basis. The explanation may be found into the fact that Competitive Intelligence in Cameroon is strongly associated with gathering information on competitors. This result follows findings revealing that principally marketing and market research personnel are devoted to Competitive Intelligence activities when there is no dedicated Competitive Intelligence responsible. There is a rather negative picture drawn from the findings concerning human resources devoted to Competitive Intelligence purposes. The number of personnel dedicated to Competitive Intelligence in the companies surveyed is at a minimum level. These findings clearly demonstrate the low investment in human resources allocated to Competitive Intelligence field within the companies. Results are contradictory to the findings from some previous studies reporting considerable ratio of companies fully dedicated at least one person to Competitive Intelligence. Very few companies amongst the surveyed has distinct Competitive Intelligence unit, which confirms some other studies research findings on the hand and it is in contrast with who do not detect any Competitive Intelligence best practice in terms of the subordination of the Competitive Intelligence activities or apropos of the decentralized or centralized Competitive Intelligence units.
Company characteristics (employee number, turnover, size, type, nationality etc.) are influencing factors regarding the Competitive Intelligence set-up in the companies surveyed as company nationality at some levels really impacts CI practice. The majority of foreign companies recognize CI positive impacts while local companies adopt a neutral position . The comparison of the findings concerning small and medium sized enterprises (SMEs) and results from large companies , significant variances concerning the Competitive Intelligence organization and the accomplishment of Competitive Intelligence practices depending on the company size can be observed. There is no harmony concerning the type of data companies are collected during their Competitive Intelligence practices on a country-level. In China and Japan for example, companies’ main interest is to collect general industry trends and the technological developments of competitors whilst in Austria , companies mainly focus on the collection of data concerning products and services, prices and conditions, and financial data of competitors. This study results follow the same divergence in collecting data as in Cameroon; while some companies principally collect information about marketing and global market other focusing on collection of data concerning a broader set of data amongst them financial data, market trends, competitive strategies. Internet, prospects, employees, officials, costumers are the main types of information sources used during the Competitive Intelligence process while Internet, emails, intranets, conferences represent channels by which informations are mostly disseminated in Cameroon as in Austria . Process stage includes six stages that are collection, processing, analysis, sorting, capture, and storage of information. These results comfort some previous studies revealing the non-existence of a worldwide process model . To clarify and bring more insights to Competitive Intelligence situation according to Organizations deploying themselves in Cameroon business environment, further researches may investigate whether Competitive Intelligence is regarded as part of market research respectively marketing not a distinct company practice. Future researches can evaluate the success of the companies where a separate Competitive Intelligence department is installed in terms of sophistication and better functioning Competitive Intelligence approach. Researchers might further center on particular industries through the examination of all Competitive Intelligence related topics and investigate the predominant Competitive Intelligence sophistication in the respective industry. Further research might be helpful if focusing on the type of information that should be selected according to the influence of company characteristics such as the company origin. Quantitative research should additionally necessitate full regards in terms for example of CI measurements.
5. Conclusion
The main objective of this study was to collect opinions of managers of companies operating in Cameroon regarding the overall utility of Competitive Intelligence (CI). To accomplish this objective, we first explored whether and how CI is practiced into companies operating in Cameroon, compared this functioning and opinions between foreign and local companies as well as classified most impacting variables. The method focused on conducting a descriptive analysis of the variables, studying the links between the variables and classifying them according to their discriminatory power, and analyzing the similarities between the variables in order to highlight the factors that could influence implementation of CI. This analysis has made it possible to assess the current role of competitive intelligence in companies, specifically in Cameroon. The illustration that emerges there are zones of consensus about what constitutes CI, its processes, its tools, its dissemination and its appreciation. It’s further acknowledged that CI is practiced in all types of organizations with varied results despite its apparent newness. Most of the present literature except doesn’t give insights on CI practices in countries where it is still relatively inexperienced. By addressing this scarcity, this study brings insights into CI practices in a developing sub-Saharan country named Cameroon. We surprisingly discover that all the companies studied has considerable/appreciate knowledge on CI though this knowledge seems to be at different levels from each company to another (or between/ among companies). This situation can find roots on the existence of CI Cameroonian association. Hence, the study comfort previous study positions revealing that there is neither universal CI definition nor rigorous terminology . Control variables (age, size, …) have minor effect on CI, while company nationality really impacts CI company’s practices. All in all, most of the companies on the observation claim to be satisfied with benefits. The results of this study further show that the variables do not have the same impact regarding the benefits of competitive intelligence. Empirical insights of the qualitative studies confirmed both the existence of various CI benefits and company managers satisfaction, encapsulates outcomes and benefits, and the role of CI within the organization. Competitive intelligence is clearly established as a more complete tool related to the study of business environment where wide information regarding company’s competitors is collected and analyzed. The study contribution to literature is highlighted and should be helpful for future researchers. The study could be a template for company managers, academics, professionals, and students in getting knowledge about what is done in Cameroon in terms of CI implementation, differences with other more CI sophisticated countries and the potential that lies in this company practice and get specific tools, techniques and strategies that help to initiate the rights actions and changes in terms of CI structure, CI resources and CI processes. The remaining interrogation should be to examine whether Competitive Intelligence is considered as part of market research and or marketing activities or if it can be simply considered as a distinct company practice that normally fits better within market research and or marketing department in cases where no Competitive Intelligence person or department is devoted.
Abbreviations

CI

Competitive Intelligence

SCIP

Society of Strategic and Competitive Intelligence Professionals

USA

United States of America

Acknowledgments
Sincere gratitude to mister DONGMO SOUMELOU for his assistance during data analyses.
Author Contributions
Dieudonné Justin Lekini: Conceptualization, Investigation, Methodology, Supervision, Writing – original draft
Aimé Bertrand Bidja: Data curation, Software, Visualization
Fred Eka: Formal Analysis, Validation, Writing – review & editing
Data Availability Statement
We are disappointed to do not share the link as companies insisted to keep their informations strictly confidential.
Conflicts of Interest
The authors declare no conflicts of interest.
References
[1] Walters, B. A., Jiang, J. J. & Klien, G. (2003). Strategic information and strategic decision making: The EIS/CEO interface in smaller manufacturing companies. Information and Management, 40(6), 487-495.
[2] Mboweni, T. T. (2000). Global competitiveness: Is South Africa ready? Address by the Governor of the South African Reserve Bank at the Black Management Forum Conference 2000, Gauteng.
[3] Weiss, A. & Naylor, E. (2010). Competitive Intelligence: How independent information professionals, American Society for Information Science and Technology 37(1), 30-34.
[4] Haataja, J. (2011). Social media as a source of competitive intelligence in a pharmaceutical corporation, published master’s thesis, Degree Programme in Industrial Engineering and Management, School of Science, Aalto University, Helsinki.
[5] Calof, J. & Wright S. (2008). Competitive intelligence: A practitioner, academic and inter-disciplinary perspective. European Journal of Marketing 42(7/8): 717-730.
[6] De Pelsmacker, P., Muller M. L., Viviers W., Saayman A., Cuyvers L. & Jegers M. (2005). Competitive intelligence practices of South African and Belgian exporters. Marketing Intelligence & Planning 23: 606-20.
[7] Søilen, K. S. (2015). A place for intelligence studies as a scientific discipline. Journal of Intelligence Studies in Business, 5(3), 35-46.
[8] Muller, M. L. (2006). “Parts of competitive intelligence: competitor intelligence”, South African Journal of Information Management 8(1), Art. 209, 5 pages.
[9] Fleisher, C. S. & Wright, S., 2009, ‘Examining differences in competitive intelligence practice: China, Japan, and the West’, Thunderbird International Business Review 51(3), 249–261.
[10] Roitner, A. (2008). “Competitive intelligence in Austria: An empirical study”, Master’s dissertation, University of Vienna.
[11] Heppes, D. & Du Toit, A. (2009). Level of maturity of the competitive intelligence function: Case study of a retail bank in South Africa, Aslib Proceedings: New Information Perspectives 61(1), 48-66.
[12] Fitzpatrick, W. M. & Burke D. R. (2003). “Competitive Intelligence, corporate security and the virtual organization”, ACR, Vol: 11, No: 1.
[13] Attaway M. C. (1999). "Competitive Intelligence", Internal Auditor.
[14] Rouach, D. & Santi, P. (2001). Competitive intelligence adds value: Five intelligence attitudes. European Management Journal 19(1): 552-559.
[15] Nasri, W. (2011) “Competitive intelligence in Tunisian companies”, Journal of Enterprise Information Management 24(1), 53-67.
[16] Bartes, F. (2014). Defining a Basis for the New Concept of Competitive Intelligence. Acta Universitatis Agriculturae et Silviculturae Mendelianae Brunensis 62: 1233-42.
[17] Cucui, A. P. G. (2009). “A framework for enhancing competitive intelligence capabilities using decision support system based on web mining techniques”, International Journal of Computers, Communications and Control 4(4), 326-334.
[18] Du Toit, A. & Muller, M. L. (2005). Training competitive intelligence analysts via the Web: The University of Johannesburg experience. Journal of Education for Library and Information Science 46: 320-32.
[19] Brody, R. (2008). “Issues in defining competitive intelligence: An exploration”, Journal of Competitive Intelligence and Management 4(3), 3-16.
[20] Stankeviciute, J., Oržekauskas, P. & Jucevicius, R. (2004). “Competitive intelligence in Lithuania”, Journal of Competitive Intelligence and Management, Vol. 2(4), pp. 32-41.
[21] Winklhofer, H. & Diamantopoulos, A. (1996). “First insights into export sales forecasting practice: a qualitative study”, International Marketing Review, Vol. 13(4), pp. 52-81.
[22] Wilson, A. (2003). “Marketing Research: An integrated approach”, (Prentice Hall).
[23] Viviers, W., Saayman, A. & Muller, M. L. (2005). “Enhancing a competitive intelligence culture in South Africa”, International Journal of Social Economics, Vol. 32(7), pp. 576-589.
[24] Michaeli, R. (2004). “Competitive intelligence in Germany”, Journal of Competitive Intelligence and Management, Vol. 2(4), pp. 1-6.
[25] Badr, A. (2003). “The role of competitive intelligence in formulating marketing strategy”, PhD thesis, Leicester Business School, De Montfort University, Leicester.
[26] Gulliford, J. (1998). “The challenge of competitor intelligence”, Management Services, Jan. 1998, Vol. 42(1) pp. 20-22.
[27] Calof J. & Smith J. (2010). The integrative domain of foresight and competitive intelligence and its Impacts on R&D management. R&D Management Issue; 40/1.
[28] Colakoglu, T. (2011). The problematic of competitive intelligence: How to evaluate & develop competitive intelligence? Procedia-Social and Behavioral Sciences 24(1), 1615-1623.
[29] Kahaner, L. (1998). “Competitive intelligence: How to gather, analyze, and use information to move your business to the top”, New York: Simon & Schuster.
[30] Pellissier, R. & Nenzhelele, T. E. (2013). Towards a universal competitive intelligence process model. SA Journal of Information Management 15(2), Ar.#567, P7.
[31] Prescott, J. (1999). “The evolution of competitive intelligence - designing a process for action”, Proposal Management - The Professional Journal of the Association of Proposal Management Professionals (APMP), Spring 1999, pp. 37-52.
[32] Venter, P. & Tustin, D. (2009). ‘The availability and use of competitive and business intelligence in South African business organizations’’, Southern African Business Review 13(2), 88-117.
[33] Zanasi, A. (1998). “Competitive Intelligence through data mining public sources”, Competitive Intelligence Review, Vol. 9(1), pp. 44-54.
[34] Tao, Q. & Prescott, J. (2000). “China: Competitive intelligence practices in an emerging market environment”, Competitive Intelligence Review, Vol. 11(4), pp. 65- 78.
[35] Wright, S. & Calof, J. L. (2006). “The quest for competitive, business and marketing intelligence: a country comparison of current practices”, European Journal of Marketing, Vol. 40(5/6), pp. 453-465.
[36] Wright, S., Eid, E. R. & Fleisher, C. S., 2009, ‘Competitive intelligence in practice: Empirical evidence from the UK retail banking sector’, Journal of Marketing Management 25(9/10), 941–964.
[37] Teo, T. & Choo, W. Y. (2001). Assessing the impact of using the Internet for competitive intelligence. Information & Management 39: 67-83.
[38] Jaworski, B., Macinnis, D. & Kohli, A. (2002). “Generating competitive intelligence in organizations”, Journal of Market - Focused Management, Vol. 5(4), pp. 279-307.
[39] Bao, C., Qingjiu T. & Luhong D. (1998). The developing Chinese competitive intelligence profession. Competitive Intelligence Review 9: 42-47.
[40] Hunya, G. (2000). International competitiveness and impacts of FDI in CEECs, wiiw Research Report, No. 268, The Vienna Institute for International Economic Studies.
[41] Pogodina, T. V., Muzhzhavleva, T. V. & Udaltsova, N. L. (2020). Strategic management of the competitiveness of industrial companies in an unstable economy. Entrepreneurship and Sustainability Issues, 7(3), 1555-1564.
[42] Wood, E. (2001). “Marketing information systems in tourism and hospitality small- and medium-sized enterprises: A study of internet use for market intelligence”, International Journal of Tourism Research, Vol. 3, pp. 283-299.
[43] Tarraf, P. & Molz, R. (2006). “Competitive intelligence at small enterprises”, S. A. M. Advanced Management Journal, Autumn 2006, Vol. 71(4), pp. 24-34.
[44] Hannula, M. & Pirttimaki, V. (2003). “Business Intelligence: Empirical Study on the Top 50 Finnish Companies”, Journal of American Academy of Business, Mar. 2003, Vol. 2(2), pp. 593-599.
[45] Sugasawa, Y. (2004). “The current state of competitive intelligence activities and competitive awareness in Japanese businesses”, Journal of Competitive Intelligence and Management, Winter 2004, Vol. 2(4), pp. 7-31.
[46] Viviers W., Muller M. L & Du Toit A. (2005). Competitive Intelligence: An instrument to Enhance South Africa’s Competitiveness. SAJEMS NS no2.
[47] Pellissier, R. & Nenzhelele, T. E., 2013, ‘Towards a universal definition of competitive intelligence’, SA Journal of Information Management 15(2), Art. #559, 7 pages.
[48] McGonagle, J. J. & Vella, C. M., 2012, Proactive Intelligence, Springer-Verlag, London.
Cite This Article
  • APA Style

    Lekini, D. J., Bidja, A. B., Eka, F. (2026). Perceived Role of Competitive Intelligence for the Organization: Empirical Evidence from Cameroonian Business Environment. International Journal of Business and Economics Research, 15(5), 104-138. https://doi.org/10.11648/j.ijber.20261505.12

    Copy | Download

    ACS Style

    Lekini, D. J.; Bidja, A. B.; Eka, F. Perceived Role of Competitive Intelligence for the Organization: Empirical Evidence from Cameroonian Business Environment. Int. J. Bus. Econ. Res. 2026, 15(5), 104-138. doi: 10.11648/j.ijber.20261505.12

    Copy | Download

    AMA Style

    Lekini DJ, Bidja AB, Eka F. Perceived Role of Competitive Intelligence for the Organization: Empirical Evidence from Cameroonian Business Environment. Int J Bus Econ Res. 2026;15(5):104-138. doi: 10.11648/j.ijber.20261505.12

    Copy | Download

  • @article{10.11648/j.ijber.20261505.12,
      author = {Dieudonné Justin Lekini and Aimé Bertrand Bidja and Fred Eka},
      title = {Perceived Role of Competitive Intelligence for the Organization: Empirical Evidence from Cameroonian Business Environment},
      journal = {International Journal of Business and Economics Research},
      volume = {15},
      number = {5},
      pages = {104-138},
      doi = {10.11648/j.ijber.20261505.12},
      url = {https://doi.org/10.11648/j.ijber.20261505.12},
      eprint = {https://article.sciencepublishinggroup.com/pdf/10.11648.j.ijber.20261505.12},
      abstract = {Businessmen, for the success of their companies, multiply strategies, techniques and tools in order to control and tackle their competitors and build strategic value. The most suitable tool to realize these ambitions is Competitive intelligence. The main objective of this study is to collect opinions of managers of companies operating in Cameroon regarding the overall utility of Competitive Intelligence (CI). To accomplish this objective, we first explored whether and how CI is practiced into companies operating in Cameroon, compared this functioning and opinions between foreign and local companies as well as classified most impacting variables. This study is inherently qualitative. The study is done by conducting explorative research on CI; therefore, questionnaire has been submitted to CI companies ‘managers in Cameroon. R software was used as it seems more convenient for statistical computing, data analysis, and graphics. Surprisingly, companies functioning in Cameroon globally use Competitive Intelligence to ensure the success of their activities. While looking at the Cameroonian practitioners’ familiarity with CI term, the organizational setup (e.g., departments responsible for CI, number of CI employees, CI budget, etc.) and the CI process flow (e.g., CI process stages, dissemination of CI, etc.), it was discovered that CI in Cameroon is appeared in a relatively unsophisticated scheme partially due to its newness. Results outline the positive effect of CI for companies and the global satisfaction of company’s managers as it contributes to the best understanding of the market, identification of the strengths and weaknesses of competitors, facilitation of decision-making, reduction of risks, long-term strategic advantages, etc.},
     year = {2026}
    }
    

    Copy | Download

  • TY  - JOUR
    T1  - Perceived Role of Competitive Intelligence for the Organization: Empirical Evidence from Cameroonian Business Environment
    AU  - Dieudonné Justin Lekini
    AU  - Aimé Bertrand Bidja
    AU  - Fred Eka
    Y1  - 2026/09/30
    PY  - 2026
    N1  - https://doi.org/10.11648/j.ijber.20261505.12
    DO  - 10.11648/j.ijber.20261505.12
    T2  - International Journal of Business and Economics Research
    JF  - International Journal of Business and Economics Research
    JO  - International Journal of Business and Economics Research
    SP  - 104
    EP  - 138
    PB  - Science Publishing Group
    SN  - 2328-756X
    UR  - https://doi.org/10.11648/j.ijber.20261505.12
    AB  - Businessmen, for the success of their companies, multiply strategies, techniques and tools in order to control and tackle their competitors and build strategic value. The most suitable tool to realize these ambitions is Competitive intelligence. The main objective of this study is to collect opinions of managers of companies operating in Cameroon regarding the overall utility of Competitive Intelligence (CI). To accomplish this objective, we first explored whether and how CI is practiced into companies operating in Cameroon, compared this functioning and opinions between foreign and local companies as well as classified most impacting variables. This study is inherently qualitative. The study is done by conducting explorative research on CI; therefore, questionnaire has been submitted to CI companies ‘managers in Cameroon. R software was used as it seems more convenient for statistical computing, data analysis, and graphics. Surprisingly, companies functioning in Cameroon globally use Competitive Intelligence to ensure the success of their activities. While looking at the Cameroonian practitioners’ familiarity with CI term, the organizational setup (e.g., departments responsible for CI, number of CI employees, CI budget, etc.) and the CI process flow (e.g., CI process stages, dissemination of CI, etc.), it was discovered that CI in Cameroon is appeared in a relatively unsophisticated scheme partially due to its newness. Results outline the positive effect of CI for companies and the global satisfaction of company’s managers as it contributes to the best understanding of the market, identification of the strengths and weaknesses of competitors, facilitation of decision-making, reduction of risks, long-term strategic advantages, etc.
    VL  - 15
    IS  - 5
    ER  - 

    Copy | Download

Author Information
  • Department of International Economics, International Relations Institute of Cameroon, Yaoundé, Cameroon

    Biography: Dieudonné Justin Lekini is Senior Lecturer and Researcher at International Relations Institute of Cameroon (IRIC), Department of International Economics belonging to University of Yaoundé II-Soa. Award of China-Cameroon cooperation PhD Scholarship 2014-2019, he his holder of PhD in Business Management specialized in International Marketing obtained at University of International Business and Economics (UIBE) Beijing-China in 2019. With six years of experience, he is visiting Professor for several private universities. With proven experience in teaching, research, and practice of negotiation techniques, international marketing, fundamental marketing, internationalization strategy, banking marketing, strategic marketing, marketing management, digital marketing, market research, and the supervision and mentoring of student research and writing projects, he has participated to the teaching program review, and international colloquium at University of Dschang, Faculty of Economics and Management. He delivered some speeches during seminars and conferences in Cameroon. He has participated in few international research collaboration projects in recent years.

    Research Fields: Consumer behavior, Service, International exchanges, Innovation, Entrepreneurship, Business intelligence, Business Management, Business eth-ics, digital marketing

  • Department of Management and Transformation of the Organizations and Societies, Advanced School of Economics and Business, Garoua, Cameroon

    Biography: Aimé Bertrand Bidja is a Cameroonian academic and researcher in Business Administration and Management Sciences. He currently serves as Senior Lecturer in The Department of Management and transformation of societies and organizations at the Advances School of Economics and Business (ASAB), of the University of Garoua, Cameroon, where he contributes to teaching and research in management, entrepreneurship, and economic development. He pursued higher education in China where he got PhD in Business Administration at University of International Business and Economics (UIBE), Beijing. His academic background combines international relations, strategic management, and business administration. His current major work focuses on SME performance, strategic management, supply chain management, public-sector management, entrepreneurship, and local economic development, with particular attention to Cameroon’s agro-industrial and public institutions. Dr. Bidja is actively involved in supervising graduate research, conducting studies on organizational performance, food security institutions, and the “Made in Cameroon” industrialization.

    Research Fields: Strategic Management, Business Administration, Supply Chain and Operations Management, Corporate Social Responsibility (CSR) and Sustainability, Ag-ribusiness and Rural Development, Project Management, International Business and China-Africa Economic Coopera-tion, Innovation and Digital Entrepreneurship, International Business and China-Africa Economic Cooperation

  • Department of International Economics, International Relations Institute of Cameroon, Yaoundé, Cameroon

    Biography: Fred Eka is a lecturer in International Economics Department at the Cameroon Institute of International Research, University of Yaoundé 2. He obtained PhD in Economics Sciences at the University of Pau (FRANCE) in 2018, and his master’s degree in International Exchange, Exchange Economist at the University of Tours in 2013. Recognized for his exceptional contributions, Dr. EKA Fred was appointed as Assistant Studies Officer No. 1 at the Directorate of Higher Education Development at the Ministry of Higher Education of Cameroon in 2023. He has participated in several international research collaboration projects over the past years. He currently sits on the editorial boards of numerous publications and has been invited as a speaker, technical committee member, to national and international conferences.

    Research Fields: Financial macroeconomics, Development mac-roeconomics and microeconomics, Economic integration, International trade, Local and rural development

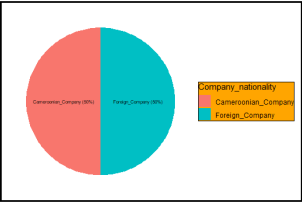
  • Abstract
  • Keywords
  • Document Sections

    1. 1. Introduction
    2. 2. Methodology
    3. 3. Results (Findings)
    4. 4. Discussion
    5. 5. Conclusion
    Show Full Outline
  • Abbreviations
  • Acknowledgments
  • Author Contributions
  • Data Availability Statement
  • Conflicts of Interest
  • References
  • Cite This Article
  • Author Information