Abstract
Gender inequality remains a persistent structural challenge globally and across Africa, despite sustained policy commitments at national, regional, and continental levels. This study employed a retrospective Interrupted Time Series Analysis (ITSA) to assess trends in gender equality outcomes before and after the adoption of Agenda 2063 in 2013, the African Union’s long-term development framework for Africa’s transformation. Using World Economic Forum Gender Gap Index (GGI) data from 2006 to 2025, segmented regression models were applied to five African countries selected across regions based on the magnitude of change in gender equality over time. The intervention point was defined as 2013, coinciding with the formal adoption of Agenda 2063. Results indicate a general upward trajectory in gender equality across all the countries prior to the intervention with significance observed in Burkina Faso (b1 = 0.0086, t=4.314, p = 0.0005, 95% CI: 0.004 – 0.013) and Egypt (b1 = 0.0031, t=2.501, p = 0.0236, 95% CI: 0.001 – 0.006). Post-intervention effects, however, varied substantially. In Chad, there was evidence of immediate increase in closed gender gap (b2 = 0.0302, t = 2.982, p = 0.0088, 95% CI: 0.009 – 0.052) while Ethiopia and Namibia exhibited positive long-term gains in gender equality relative to counterfactual trends, though non-significant at α = 0.05. Sustained post-intervention reduction was observed in Burkina Faso and Egypt, with significance only in Burkina Faso (b3 = -0.0071, t = -3.316, p = 0.004, 95% CI: -0.012 – -0.003). Counterfactual analysis suggested that, by 2025, Agenda 2063 may have contributed to improvements in the Gender Gap Index ranging from 5.9% to 8.7% in Ethiopia and Namibia. On the other hand, counterfactuals for Burkina Faso, Chad and Egypt depicted better performance by between 0.17% and 11.9%, with the best performance observed in Burkina Faso, which is unusual and could be attributed to other external factors. The models for all the countries were significant (p < 0.05) and fitted well (R2 >0.81). These findings provide empirical evidence that continental policy frameworks can contribute to improved gender equality outcomes, though effects are heterogeneous, context-dependent and gradual. The study underscores the importance of sustained implementation, national-level policy alignment, and complementary institutional reforms to translate high-level commitments into tangible gender equality gains.
Keywords
ARIMA Modeling, Segmented Regression Analysis, Gender Inequality in Africa, Interrupted Time Series Analysis,
Agenda 2063, Sub-Saharan Africa, Gender Gap Index, Policy Impact Evaluation
1. Introduction
Time series analysis is a class of quantitative methods used to examine patterns, trends, and relationships in data collected sequentially over time. Among these methods, Interrupted Time Series Analysis (ITSA) - also referred to as intervention analysis - has emerged as one of the most robust quasi-experimental designs for evaluating the causal effects of policy interventions in observational settings. ITSA estimates whether an intervention produces statistically significant changes in the level (immediate effect) or trend (long-term effect) of an outcome variable by comparing observations before and after the intervention point.
Originally formalized by Box and Tiao (1975)
, ITSA was developed as a formal framework to assess policy interventions in observational time series data. Since its introduction, the method has been widely applied across disciplines, including sociology, economics, political science, marketing, and public health. Sociological applications include the evaluation of workplace safety interventions (Krause
et al., 1999)
| [7] | Krause, T. R., Seymour, K. J., & Sloat, K. C. M. (1999). Long-term evaluation of a behavior-based method for improving safety performance: a meta-analysis of 73 interrupted time-series replications. Safety Science, 32(1), 1-18.
https://doi.org/10.1016/s0925-7535(99)00007-7 |
[7]
, while economists have used ITSA to assess the effects of macroeconomic policies on inflation and consumer behavior (Mohammed & Abdul-Aziz, 2001)
| [10] | Mohammed, H., & Abdul-Aziz, A. R. (2001). Modelling the Ghanaian Inflation Rates Using Interrupted Time Series Analysis Approach. |
[10]
. In political science, ITSA has been applied to examine the impacts of policy reforms on gender-based violence and sexual offences (Letourneau
et al., 2010)
| [8] | Letourneau, E. J., Levenson, J. S., Bandyopadhyay, D., Sinha, D., & Armstrong, K. S. (2010). Evaluating the effectiveness of sex offender registration and notification policies for reducing sexual violence against women: Final report for National Institute of Justice. MUSC, Medical University of South Carolina. |
[8]
.
More recently, ITSA has become a standard cost-effective approach in health systems research for evaluating policy reforms and public health interventions, including the effects of Coronavirus disease (COVID-19) response policies on health service delivery (Doubova
et al., 2022)
| [3] | Doubova, S. V., Arsenault, C., Contreras-Sanchez, S. E., Borrayo-Sanchez, G., & Leslie, H. H. (2022). The road to recovery: an interrupted time series analysis of policy intervention to restore essential health services in Mexico during the COVID-19 pandemic. Journal of global health, 12, 05033. https://doi.org/10.7189/jogh.12.05033 |
[3]
. Across these applications, ITSA is valued for its ability to generate credible causal inference in contexts where randomized controlled trials are infeasible.
Methodologically, ITSA requires sufficient observations before and after the intervention to reliably estimate changes in trend and level. Penfold and Zhang (2013)
recommend a minimum of eight time points on either side of the intervention, although later studies suggest that meaningful inference may still be possible with fewer observations, with the only limitation of reduced statistical power (Ye, 2022)
| [20] | Ye, L. (2022). A practitioner’s guide to interrupted time series. |
[20]
.
The literature review revealed three important gaps that this study sought to address. First, there was extensive research within the health sector that lacked a gender-focused perspective, particularly in the African context. For instance, Drzymalski
et al. (2021)
| [4] | Drzymalski, D. M., Guo, J. C., Qi, X. Q., Tsen, L. C., Sun, Y., Ouanes, J. P. P.,... & Hu, L. Q. (2021). The effect of the no pain labor & delivery-global health initiative on cesarean delivery and neonatal outcomes in china: an interrupted time-series analysis. Anesthesia & Analgesia, 132(3), 698-706.
https://doi.org/10.1213/ane.0000000000004805 |
[4]
examined the effects of a pain-relieving medication on cesarean births in China but gave limited attention to gender-related dimensions, such as male and female differences in outcomes or implications for health systems and administration. This highlighted a broader tendency to overlook gendered analysis within sector-specific studies.
Second, much of the existing research on gender equality was conducted outside Africa. Nguyen
et al. (2020)
| [11] | Nguyen, T. T., Darnell, A., Weissman, A., Frongillo, E. A., Mathisen, R., Lapping, K., Withers, M. (2020). Social, economic, and political events affect gender equity in China, Nepal, and Nicaragua: a matched, interrupted time-series study. Global health action, 13, 1712147.
https://doi.org/10.1080/16549716.2020.1712147 |
[11]
, for example, used data from the World Economic Forum’s Gender Gap Index but focused only on two Asian countries and one American country. Their study adopted a retrospective approach to identify interventions and disruptions, combining purposive sampling with matched interrupted time series (ITS) analysis. While methodologically relevant, such studies limited the contextual understanding of gender dynamics within Africa.
A third gap relates to the use of imbalanced datasets in time series analyses, where the pre-intervention period is substantially longer than the post-intervention period. Li et al. (2023)
| [9] | Li, Y., Liu, X., Li, X., Xue, C., Zhang, B., & Wang, Y. (2023). Interruption time series analysis using autoregressive integrated moving average model: evaluating the impact of COVID-19 on the epidemic trend of gonorrhea in China. BMC Public Health, 23(1), 2073.
https://doi.org/10.1186/s12889-023-16953-5 |
[9]
, for instance, used a 17-year dataset in which approximately 76% of observations fell within the pre-intervention phase, a pattern also observed in Zhou et al. (2023)
| [22] | Zhou, Q., Hu, J., Hu, W., Li, H., & Lin, G. Z. (2023). Interrupted time series analysis using the ARIMA model of the impact of COVID-19 on the incidence rate of notifiable communicable diseases in China. BMC Infectious Diseases, 23(1), 375.
https://doi.org/10.1186/s12879-023-08229-5 |
[22]
. This imbalance can weaken the robustness and interpretability of findings, particularly when assessing intervention effects over time.
This study addressed these gaps by introducing the African Union’s Agenda 2063 as the central intervention, focusing explicitly on gender gap modelling within the African context. It also employed a more balanced dataset, comprising seven years of pre-intervention data and twelve years of post-intervention data, to improve analytical reliability.
Methodologically, the study applied segmented regression-based interrupted time series analysis (ITSA) to assess whether the introduction of Agenda 2063 influenced gender equality trends across five countries representing different African regions. This approach potentially contributes empirical evidence on the effectiveness of continental policy frameworks in shaping long-term gender outcomes. However, while segmented regression captures changes in level and trend, it does not explicitly account for autocorrelation, which is acknowledged as a methodological limitation (Turner
et al., 2021)
| [19] | Turner, S. L., Karahalios, A., Forbes, A. B., Taljaard, M., Grimshaw, J. M., & McKenzie, J. E. (2021). Comparison of six statistical methods for interrupted time series studies: empirical evaluation of 190 published series. BMC Medical Research Methodology, 21, 1–19.
https://doi.org/10.1186/s12874-021-01306-w |
[19]
.
2. Literature Review
Interrupted time series analysis has been widely employed to assess intervention effects across social, economic, and health domains. Drzymalski
et al. (2021)
| [4] | Drzymalski, D. M., Guo, J. C., Qi, X. Q., Tsen, L. C., Sun, Y., Ouanes, J. P. P.,... & Hu, L. Q. (2021). The effect of the no pain labor & delivery-global health initiative on cesarean delivery and neonatal outcomes in china: an interrupted time-series analysis. Anesthesia & Analgesia, 132(3), 698-706.
https://doi.org/10.1213/ane.0000000000004805 |
[4]
used segmented logistic regression to evaluate an educational intervention aimed at reducing unnecessary caesarean deliveries in China. Using monthly data over a two-year period, the study demonstrated significant reductions in caesarean delivery rates and neonatal intensive care unit admissions following the intervention.
Nguyen
et al. (2020)
| [11] | Nguyen, T. T., Darnell, A., Weissman, A., Frongillo, E. A., Mathisen, R., Lapping, K., Withers, M. (2020). Social, economic, and political events affect gender equity in China, Nepal, and Nicaragua: a matched, interrupted time-series study. Global health action, 13, 1712147.
https://doi.org/10.1080/16549716.2020.1712147 |
[11]
applied ITSA to examine how major political, social, and economic events influenced gender equity trends in Nepal, Nicaragua, and China. Using World Economic Forum Gender Gap Index data from 2006 to 2017, the authors identified significant post-intervention improvements in Nepal and Nicaragua linked to political empowerment, while China experienced a decline associated with setbacks in education, health, and economic participation.
In a high-income country context, Puyat and Kazanjian (2020)
| [16] | Puyat, J. H., & Kazanjian, A. (2020). Physician incentives and sex/gender differences in depression care: an interrupted time series analysis. Health Equity.
https://doi.org/10.1089/heq.2019.0034 |
[16]
investigated whether physician financial incentives reduced gender disparities in depression care in Canada. Despite policy implementation, gender differences persisted, highlighting that structural inequalities may be resistant to single-policy interventions.
Taljaard
et al. (2014)
| [18] | Taljaard, M., McKenzie, J. E., Ramsay, C. R., & Grimshaw, J. M. (2014). The use of segmented regression in analysing interrupted time series studies: an example in pre-hospital ambulance care. Implementation Science, 9, 1–4.
https://doi.org/10.1186/1748-5908-9-77 |
[18]
evaluated a joint quality improvement initiative in emergency medical services using ITSA and found mixed results, reinforcing the importance of robust methodological design in intervention evaluation.
Beyond ITSA, time series regression models have also been applied to study the macroeconomic consequences of gender inequality. Pervaiz
et al. (2011)
| [14] | Pervaiz, Z., Chani, M. I., Jan, S. A., & Chaudhary, A. R. (2011). Gender inequality and economic growth: a time series analysis for Pakistan. |
[14]
, using annual data from Pakistan, found that gender inequality exerted a statistically significant negative effect on economic growth, underscoring the broader developmental implications of gender disparities.
Despite the growing body of ITSA literature, empirical studies assessing continent-wide gender policy frameworks, particularly in Africa, remain limited. This study addressed this gap by evaluating Agenda 2063 as a natural policy intervention using a rigorous time series framework.
3. Materials and Methods
3.1. Data Retrieval
Secondary data were obtained from the World Economic Forum’s Gender Gap Index (GGI) reports for the period 2006–2025, yielding 20 observations per country. This relatively small sample size may have reduced statistical power, although interrupted time series (ITS) analysis can still be effective with fewer data points (Ye, 2022)
| [20] | Ye, L. (2022). A practitioner’s guide to interrupted time series. |
[20]
. Supporting this, Qin et al. (2019)
| [17] | Qin, L., Shanks, K., Phillips, G. A., & Bernard, D. (2019). The impact of lengths of time series on the accuracy of the ARIMA forecasting. International Research in Higher Education, 4(3), 58-68. https://doi.org/10.5430/irhe.v4n3p58 |
[17]
found that at least ten time points are sufficient for reliable forecasting, provided the model adequately fits prior data. However, longer time series introduce the risk of parameter instability due to structural changes that may affect the variable of interest (Yousuf & Ng, 2021)
.
The World Economic Forum (WEF) determined the GGI, by averaging four sub-indices: health, politics, economy, and education. Index values range from 0 (inequality) to 1 (parity), based on indicators from United Nations Development Programme (UNDP), United Nations Educational, Scientific and Cultural Organization (UNESCO), International Labour Organization (ILO), Inter-Parliamentary Union, and others (Hausmann
et al., 2006)
| [6] | Hausmann, R., Tyson, L. D., & Zahidi, S. (2006). The Global Gender Gap Report 2006.‖ World Economic Forum, Geneva Switzerland. |
[6]
. Reports were accessed via the World Economic Forum repository and compiled into Microsoft Excel. The 20-year observation window satisfied minimum ITSA requirements for estimating pre- and post-intervention trends (Penfold & Zhang, 2013)
.
3.2. Selection of Study Countries
Countries were selected through a multi-stage process. First, those with incomplete data were excluded, which may have limited the extent to which findings reflect broader continental trends. To address this, counterfactual estimates were generated to assess trends in gender gap index in the absence of policy interventions. In addition, model fit was evaluated using R2 to ensure the robustness and reliability of the analytical results.
Second, absolute changes in GGI between 2006 and 2025 were calculated. Finally, due to the heterogeneous nature of the African region – culturally, economically and in policy adoption, one country with the largest deviation in GGI was selected from each of the five African regions as per the African Union’s classification. As a result, Burkina Faso, Chad, Egypt, Ethiopia, and Namibia were chosen for modelling. These countries were selected as illustrative case studies to enable cross-regional comparison and reflect continental diversity in gender dynamics and policy implementation. The selection was guided by data availability and the magnitude of deviations in gender equality. While this approach limits generalizability, it strengthens in-depth analysis of temporal changes using ITSA methods, ultimately supporting more meaningful comparisons across regions.
3.3. Data Processing
Data quality checks included assessment for missing values, outliers, and internal consistency. GGI values were recalculated to ensure accuracy and consistency across years. The cleaned dataset was exported to R in Comma-Separated Values (CSV) format for analysis. The absence of a 2020 GGI report resulted in a uniform missing observation across all countries. These values were imputed by fitting Autoregressive Integrated Moving Average (ARIMA) models to each country's pre-2020 observations using automated R’s algorithm
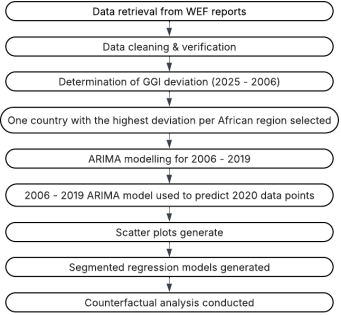
auto.arima (). Stationarity was assessed using the Augmented Dickey–Fuller (ADF) test. Leveraging pre-2020 observations, ARIMA models were fitted using an automated selection procedure based on the Akaike Information Criterion (AIC). Model adequacy was evaluated through residual diagnostics, specifically, Ljung–Box tests, to assess whether residuals approximated white noise. Forecast uncertainty was incorporated using 95% prediction intervals. The models were then used to predict the values for the year 2020 for every country. Finally, Scatter plots were used to identify potential outliers in the complete dataset. The data processing steps from data retrieval to analysis are illustrated in
Figure 1.
Figure 1. Process of data analysis.
3.4. The Intervention: Agenda 2063
Agenda 2063 is the African Union’s strategic framework for inclusive, people-driven, and sustainable development over the period 2013–2063. It consolidates and reinforces existing global and regional gender commitments, including Convention on the Elimination of All Forms of Discrimination against Women (CEDAW), the Beijing Platform for Action, the Maputo Protocol, and sub-regional gender frameworks.
Adopted in May 2013, Agenda 2063 marks a continent-wide policy milestone aimed at accelerating gender equality and women’s empowerment across all seven aspirations of Africa’s development agenda. In this study, 2013 is defined as the intervention point, with pre-2013 observations constituting the pre-intervention period and post-2013 observations forming the post-intervention period.
3.5. Data Analysis
Prior to data analysis, missing data for 2020 were first imputed using ARIMA and following a standard model-building procedure. Stationarity of the time series was first assessed using the Augmented Dickey–Fuller (ADF) test, which indicated that all series were non-stationary (p > 0.05). R’s automated algorithm auto.arima () applied a first order differencing and estimated the best models, which selected optimal specifications based on information the Akaike Information Criterion (AIC).
The selected models were predominantly ARIMA (0, 1, 0) for Burkina Faso, Chad, Ethiopia, and Namibia, and ARIMA (1, 1, 0) for Egypt, indicating limited autoregressive structure in the data. Model adequacy was evaluated through residual diagnostics. Ljung–Box tests produced non-significant results (p > 0.05) across all countries, suggesting that residuals approximated white noise and that the fitted models were appropriate.
Robustness of the imputation was assessed through sensitivity analyses comparing results obtained with and without the imputed observations. The main conclusions remained consistent, indicating that the imputation did not materially affect the overall findings.
Once the missing data for 2020 were imputed, data analysis was conducted in three stages, which are also outlined in
Figure 1. First, scatter plots were examined to obtain a general view of the data distribution for each of the five countries. These scatter plots also assisted in identifying any potential outliers within the dataset. The next stage involved generating segmented regression models for each country, as specified in Equation (
1).
Where, GGI is the gender gap index, b0 is the intercept, b1 is the baseline trend, T is the time variable in years taken from the start of the study, b2 is the level change in the dependent variable immediately after the intervention, I is an indicator variable representing 0 for observations before the intervention or 1 for those after, b3 is an estimate of the change in trend of the outcome after the intervention compared to before, L is a continuous variable which represents the time that has lapsed after the intervention has been implemented (L = 0 before the intervention) and e is the error term.
The Durbin–Watson (DW) test indicated significant positive autocorrelation in the residuals across all country-specific models (DW < 1.6, p < 0.05), suggesting violation of the independence assumption. Positive autocorrelation does not bias coefficient estimates but can lead to underestimated standard errors and inflated statistical significance (Pang
et al., 2026)
| [12] | Pang, J., Chen, H., & Valente, M. J. (2026). Evaluation of statistical methods in R for estimating intervention effects using segmented linear regression in the AB interrupted time series design. BMC Medical Research Methodology, 26(1), 42.
https://doi.org/10.1186/s12874-026-02771-x |
[12]
. As a result, the reported p-values should be interpreted with caution. While the direction and magnitude of the estimated effects remain informative, future analyses could improve inference by explicitly modelling autocorrelation (e.g., using generalized least squares or autoregressive error structures).
The final step is to determine the counterfactuals, which is essentially what could have happened to the response variable GGI if the intervention had not been implemented. This means that I=0 and L=0, hence Equation 1 reduces to Equation (
2). This ensures that at every time point, it is possible to calculate the additionality of the Agenda 2063 (intervention) to the GGI.
4. Results and Discussion
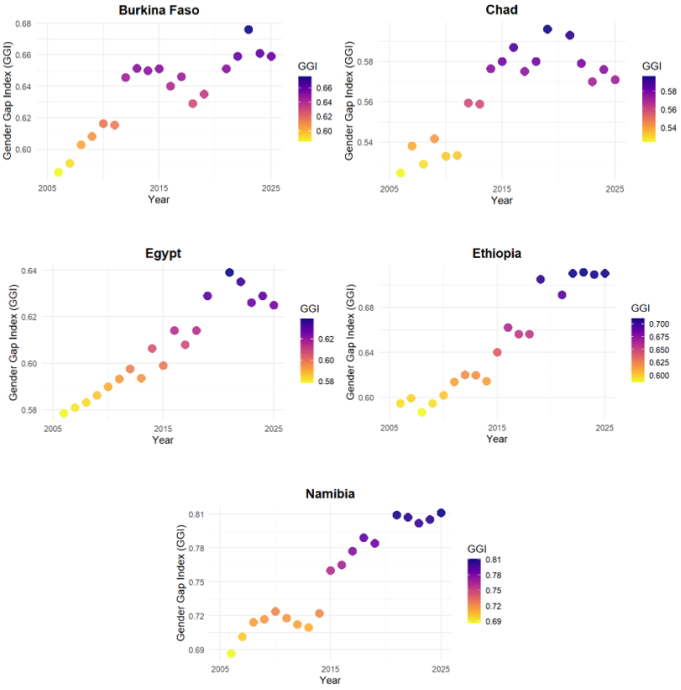
Each country contributed 20 annual observations, comprising seven pre-intervention and 12 post-intervention time points. Visual inspection of scatter plots (
Figure 2) revealed no outliers and a general upward trend in gender equality across countries from 2006 onward. Most of the countries - particularly Burkina Faso, Ethiopia and Namibia exhibited visible changes in trajectory around the 2013 intervention point.
Figure 2. Visual representation of Gender Gap Index (2006 – 2024).
4.1. Segmented Regression Results
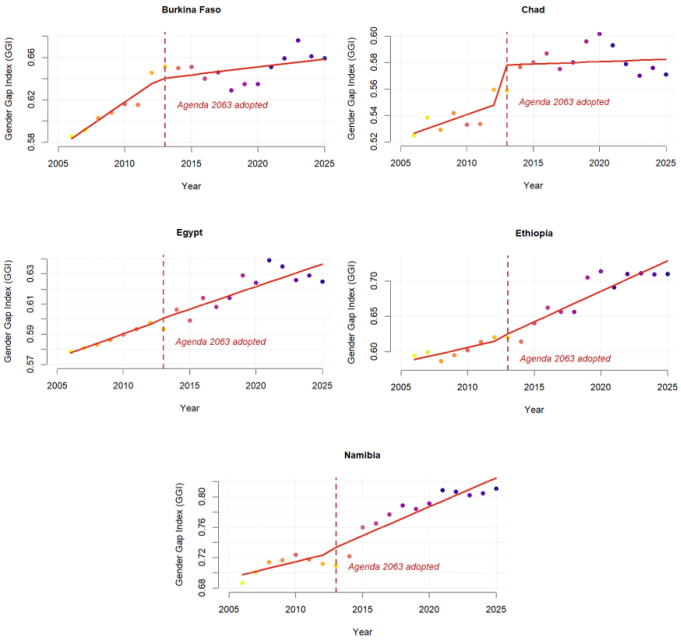
Intervention plots were generated to illustrate the trend behaviour of the intervention effect for each of the five counties. As shown in
Figure 3, GGI response to the intervention varied by country. In Burkina Faso and Chad, the segmented regression trend line showed an immediate and sustained gradual increase in closed GGI, a pattern that was slightly visible in Egypt. On the other hand, Ethiopia and Namibia depicted an immediate and sustained increase in GGI following the intervention. Further, the trend line further shows that the model seems to have detected an initial change in trend in the year 2012. The observed changes in trend were then determined if significant by generating segmented regression model estimates for each country – see Equation (
1).
Figure 3. Visualization of data segments by country (2006 - 2024).
Across countries, pre-intervention trends were positive, indicating gradual improvements in gender equality prior to Agenda 2063. Statistically significant pre-intervention trends were observed in Burkina Faso (b1 = 0.0086, t=4.314, p = 0.0005, 95% CI: 0.004 – 0.013) and Egypt (b1 = 0.0031, t=2.501, p = 0.0236, 95% CI: 0.001 – 0.006). This implies that annually, closed gender gap increased by 0.0086 in Burkina Faso and by 0.0031 in Egypt prior to the intervention.
Immediate post-intervention effects were limited, with only Chad displaying a statistically significant increase in closed GGI by 0.03 (b
2 = 0.0302, t = 2.982, p = 0.0088, 95% CI: 0.009 – 0.052). This means that immediately after the introduction of the intervention, there was a sudden increase in the value of the closed gender gap. Long-term post-intervention trends were positive in four of the five countries, though not statistically significant, suggesting gradual rather than abrupt intervention effects. Sustained post-intervention reduction in closed GGI was observed in Burkina Faso (b
3 = -0.0071, t = -3.316, p = 0.004, 95% CI: -0.012 – -0.003). Chad and Egypt also had negative but non-significant sustained post-intervention effects. On the other hand, Ethiopia and Namibia depicted positive sustained post-intervention effect, despite being non-statistically significant. Model fit was strong across all specifications, with adjusted R
2 values ranging from 0.78 to 0.91, indicating that segmented regression model explained a substantial proportion of observed variation in GGI – see
Table 1. Additional information is presented in Supplementary
Table 1.
Table 1. Segmented regression model coefficients and their significance per country.
Country | Coefficient | Estimate | Std. Error | t-value | p-value | 95% CI | |
Burkina Faso | Intercept (b0) | -16.7615 | 4.027 | -4.162 | 0.0007* | -25.298 | -8.225 |
Time (b1) | 0.0086 | 0.002 | 4.314 | 0.0005* | 0.004 | 0.013 |
Indicator (b2) | 0.0038 | 0.010 | 0.396 | 0.697 | -0.016 | 0.024 |
Time Lapsed (b3) | -0.0071 | 0.002 | -3.316 | 0.004* | -0.012 | -0.003 |
Chad | Intercept (b0) | -6.5662 | 4.265 | -1.540 | 0.1432 | -15.607 | 2.475 |
Time (b1) | 0.0035 | 0.002 | 1.666 | 0.1153 | -0.001 | 0.008 |
Indicator (b2) | 0.0302 | 0.010 | 2.982 | 0.0088* | 0.009 | 0.052 |
Time Lapsed (b3) | -0.0032 | 0.002 | -1.395 | 0.1822 | -0.008 | 0.002 |
Egypt | Intercept (b0) | -5.7628 | 2.539 | -2.270 | 0.0374* | -11.144 | -0.381 |
Time (b1) | 0.0031 | 0.001 | 2.501 | 0.0236* | 0.001 | 0.006 |
Indicator (b2) | 0.0011 | 0.006 | 0.182 | 0.8581 | -0.012 | 0.014 |
Time Lapsed (b3) | -0.0002 | 0.001 | -0.122 | 0.9042 | -0.003 | 0.003 |
Ethiopia | Intercept (b0) | -8.0587 | 4.272 | -1.529 | 0.146 | -19.235 | 3.117 |
Time (b1) | 0.0043 | 0.003 | 1.643 | 0.120 | -0.001 | 0.010 |
Indicator (b2) | 0.0019 | 0.013 | 0.154 | 0.879 | -0.025 | 0.028 |
Time Lapsed (b3) | 0.0043 | 0.003 | 1.530 | 0.145 | -0.002 | 0.010 |
Namibia | Intercept (b0) | -7.8854 | 4.9742 | -1.585 | 0.132 | -19.235 | 3.117 |
Time (b1) | 0.0043 | 0.0025 | 1.728 | 0.103 | -0.001 | 0.010 |
Indicator (b2) | 0.0029 | 0.0118 | 0.251 | 0.805 | -0.025 | 0.028 |
Time Lapsed (b3) | 0.0033 | 0.0027 | 1.254 | 0.228 | -0.002 | 0.010 |
4.2. Counterfactual Analysis
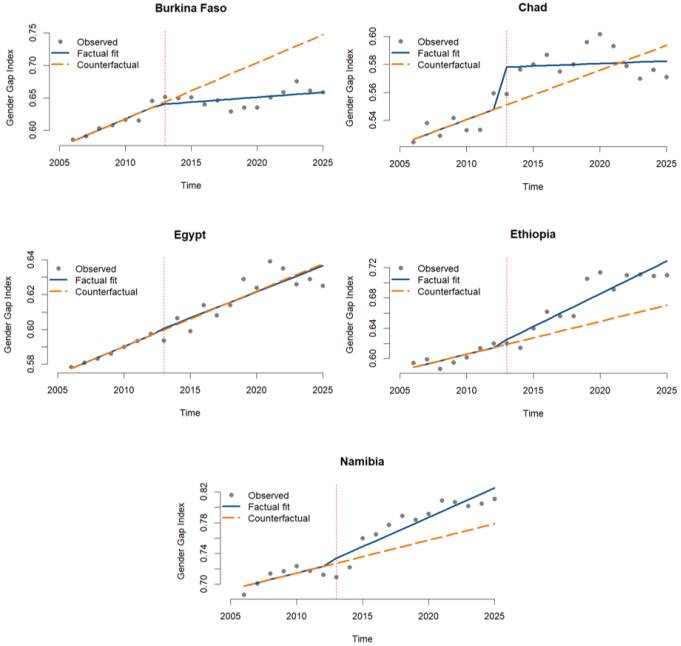
Counterfactuals representing a “business-as-usual” scenario without Agenda 2063 were generated by setting intervention parameters (indicator and time lapsed) to zero, resulting in a model shown in Equation 2. The model was then used to produce predictions with and without the intervention, yielding factual and counterfactual values, which were visualized in
Figure 4. This approach assumes that all other factors influencing gender outcomes remain constant over time. However, the model does not account for contemporaneous events such as political instability, economic shocks, or the COVID-19 pandemic, which may also have influenced observed trends. As a result, the estimated counterfactuals may partially attribute changes to the intervention that were driven by external factors.
In Ethiopia and Namibia, the visuals clearly show better performance of the factual fit compared to counterfactual while Burkina Faso counterfactual shows better results than the factual fit. The pattern is however not clearly distinguishable in Chad and Egypt.
Figure 4. Visualization of factual-counterfactual effect.
A further analysis compared the factual and counterfactual estimates at time T = 2025, the last year with complete observed data. The results showed that only Ethiopia and Namibia exhibited positive intervention effects, with observed GGI values exceeding the counterfactual estimates by 8.7% and 5.9%, respectively. This suggests that Agenda 2063 may have reinforced existing reform trajectories in countries with supportive institutional and policy environments. In contrast, the counterfactual estimates exceeded the observed values in Burkina Faso, Chad, and Egypt, implying that the observed GGI values were lower than would have been expected in the absence of the intervention by between 0.2% and 11.9%. These findings suggest that other contextual or confounding factors may have constrained gender equality progress in these countries, potentially offsetting the intended effects of Agenda 2063. Given the presence of residual autocorrelation, the reported point estimates should be interpreted with caution, as uncertainty may be underestimated.
Table 2 presents the factual and counterfactual comparisons.
Table 2. Factual, Counterfactual and the Intervention Effect at T=2025.
Country | Actual | Predicted Factual (f) | Predicted Counterfactual (c) | Intervention Effect (IE = f-c) | % Effect (%E=(IE*100%)/c) |
Burkina Faso | 0.659 | 0.6585 | 0.7476 | -0.0891 | -11.92% |
Chad | 0.571 | 0.5824 | 0.5936 | -0.0112 | -1.89% |
Egypt | 0.625 | 0.6365 | 0.6376 | -0.0011 | -0.17% |
Ethiopia | 0.71 | 0.7285 | 0.6705 | 0.0580 | 8.65% |
Namibia | 0.811 | 0.8250 | 0.7787 | 0.0463 | 5.95% |
4.3. Discussion
The findings from the segmented regression and counterfactual analysis suggest that Agenda 2063 can be associated with gradual but meaningful improvements in gender equality across most of the selected countries. The absence of strong immediate level changes, combined with positive post-intervention trends, indicated that continental policy frameworks such as Agenda 2063 were unlikely to produce abrupt shifts in gender outcomes. Instead, their influence appears to operate through longer-term institutional alignment, policy reforms, and sustained national implementation efforts. This pattern is consistent with the structural nature of gender inequality, which typically responds slowly to policy interventions.
The heterogeneous country results highlight the importance of national context in shaping the effectiveness of continental commitments. Ethiopia and Namibia recorded the largest positive deviations from their counterfactual trajectories, suggesting that Agenda 2063 may have reinforced existing reform momentum in countries with relatively strong policy uptake or complementary gender-focused initiatives. In these settings, national development plans, legal reforms, and investments in women’s economic and political participation may have amplified the framework’s intended effects. Namibia, for instance, published a report on the progress of implementing Agenda 2063, outlining gender-inclusive and affirmative action approaches inspired by the framework (Government of Namibia, 2021)
| [5] | Government of Namibia. (2021). Namibia Agenda 2063 Report. |
[5]
. Similarly, Ethiopia integrated the strategy with Sustainable Development Goals (SDGs), aligned it with national priorities, tracked and reported progress on the national monitoring system as outlined in its 2020 report (Planning & Development Commission, 2020)
| [15] | Planning & Development Commission. (2020). Ethiopia: Progress Report on the First Ten Year Implementation Plan of African Union Development Agenda (Agenda 2063). |
[15]
. Agenda 2063 may have contributed marginal additional gains by strengthening existing trajectories rather than initiating entirely new ones. This aligns with the framework’s design, which consolidates and accelerates prior regional and global gender commitments rather than introducing standalone mechanisms.
Counterfactuals in Burkina Faso (-11.92%) depicted better performance than the factual, more than ten times that of Egypt (-0.17) and six times that of Chad (-1.89%). These findings suggest that continental frameworks alone are insufficient where domestic political, economic, or security challenges constrain implementation capacity. In fragile or resource-constrained environments, competing national priorities, governance limitations, or external shocks may offset potential gains in gender equality. The negative counterfactual effect observed in Burkina Faso, Egypt and Chad underscores the sensitivity of gender outcomes to broader socio-political conditions beyond policy commitments.
A comparison of 2006 and 2025 GGI data published by the World Economic Forum revealed a uniform pattern in GGI values where all the five countries showed increase in GGI. However, global rankings did not necessarily increase. In Burkina Faso, Chad and Egypt, their positions were shifted downwards by at least 16 countries. On the other hand, Ethiopia and Namibia ranked better than 25 and 30 countries respectively. These patterns were similar to the findings obtained from this study. The findings were also consistent with the past documented research which established structural challenges hindering specific countries. Burkina Faso’s 2014 political transition and subsequent security deterioration, and Egypt’s post-2013 political restructuring and economic reforms have all been associated in the literature with disruptions to social sector performance and uneven gender outcomes. Similarly, Chad’s highest rates (61%) of child marriage, gender-based violence, and intensified attacks by armed groups can be attributed to its declined performance (Cordova-Pozo
et al., 2023)
| [2] | Cordova-Pozo, K. L., Anishettar, S. S., Kumar, M., & Chokhandre, P. K. (2023). Trends in child marriage, sexual violence, early sexual intercourse and the challenges for policy interventions to meet the sustainable development goals. International journal for equity in health, 22(1), 250.
https://doi.org/10.1186/s12939-023-02060-9 |
[2]
.
Table 3. Comparison of 2006 and 2025 WEF GGI global rankings.
| GGI value | GGI Rank |
Country | 2006 | 2025 | 2006 | 2025 |
Burkina Faso | 0.5850 | 0.6590 | 104 | 120 |
Chad | 0.5246 | 0.5710 | 113 | 146 |
Egypt | 0.5785 | 0.6250 | 109 | 139 |
Ethiopia | 0.5950 | 0.7100 | 100 | 75 |
Namibia | 0.6864 | 0.8110 | 38 | 8 |
Methodologically, the high adjusted R2 values indicate strong model fit, suggesting that segmented regression adequately captured temporal variation in the Gender Gap Index. However, the absence of explicit controls for autocorrelation and country-specific shocks remains a limitation and may affect the precision of estimated effects. Additionally, the aggregate nature of the GGI may mask differential impacts across its sub-components, such as political empowerment, economic participation and country-specific dynamics.
The results provide empirical support for the role of continental policy frameworks in shaping long-term gender outcomes, while emphasizing that their effectiveness depends heavily on national policy alignment, institutional capacity, and sustained political commitment. The findings reinforce the importance of translating high-level commitments into context-specific implementation strategies to achieve meaningful and equitable progress in gender equality.
5. Conclusion
This study provides empirical evidence that Agenda 2063 may have contributed to measurable improvements in gender equality outcomes in Africa, though impacts vary significantly across countries. While immediate effects were not uniform, longer-term gains in Ethiopia and Namibia suggest that continental policy frameworks can shape gender outcomes through gradual institutional and policy alignment.
The heterogeneous results underscore the importance of national implementation capacity, complementary policies, and political commitment in translating high-level frameworks into tangible outcomes. Future research should incorporate controls for country-specific shocks, explore sub-index dynamics within the Gender Gap Index, apply models that explicitly address autocorrelation and assess the impact of other external factors to changes in trend.
The findings reinforce the value of Interrupted Time Series Analysis as a powerful tool for evaluating large-scale policy interventions in development and gender research.
Abbreviations
ADF | Augmented Dickey–Fuller |
AIC | Akaike Information Criterion |
ARIMA | Autoregressive Integrated Moving Average |
CEDAW | Convention on the Elimination of All Forms of Discrimination Against Women |
COVID | Coronavirus Disease |
CSV | Comma-Separated Values |
DW | Durbin–Watson test |
GGI | Gender Gap Index |
ILO | International Labour Organization |
ITS | Interrupted Time Series |
ITSA | Interrupted Time Series Analysis |
SDGs | Sustainable Development Goals |
UNDP | United Nations Development Programme |
UNESCO | United Nations Educational, Scientific and Cultural Organization |
WEF | World Economic Forum |
Author Contributions
Leonard Kipkirui: Data curation, Formal Analysis, Visualization, Writing – original draft
Adolphus Wagala: Conceptualization, Methodology, Supervision, Validation
Reuben Cheruiyot Lang’at: Conceptualization, Methodology, Supervision, Validation
Conflicts of Interest
The authors declare no conflicts of interest.
Appendix
Table A1. Segmented regression model coefficients, model fitness & 95% CI.
Country | Coefficient | Estimate | Std. Error | t-value | p-value | 95% CI |
Burkina Faso | Intercept (b0) | -16.7615 | 4.027 | -4.162 | 0.0007* | -25.298 | -8.225 |
Time (b1) | 0.0086 | 0.002 | 4.314 | 0.0005* | 0.004 | 0.013 |
Indicator (b2) | 0.0038 | 0.010 | 0.396 | 0.697 | -0.016 | 0.024 |
Time Lapsed (b3) | -0.0071 | 0.002 | -3.316 | 0.004* | -0.012 | -0.003 |
R2 | 0.846 |
Adjusted R2 | 0.8171 |
F-Statistic | F = 29.29, (3, 16), P<0.00001 |
Chad | Intercept (b0) | -6.5662 | 4.265 | -1.540 | 0.1432 | -15.607 | 2.475 |
Time (b1) | 0.0035 | 0.002 | 1.666 | 0.1153 | -0.001 | 0.008 |
Indicator (b2) | 0.0302 | 0.010 | 2.982 | 0.0088* | 0.009 | 0.052 |
Time Lapsed (b3) | -0.0032 | 0.002 | -1.395 | 0.1822 | -0.008 | 0.002 |
R2 | 0.8149 |
Adjusted R2 | 0.7801 |
F-Statistic | F = 23.47, (3, 16), P<0.0001 |
Egypt | Intercept (b0) | -5.7628 | 2.539 | -2.270 | 0.0374* | -11.144 | -0.381 |
Time (b1) | 0.0031 | 0.001 | 2.501 | 0.0236* | 0.001 | 0.006 |
Indicator (b2) | 0.0011 | 0.006 | 0.182 | 0.8581 | -0.012 | 0.014 |
Time Lapsed (b3) | -0.0002 | 0.001 | -0.122 | 0.9042 | -0.003 | 0.003 |
R2 | 0.9000 |
Adjusted R2 | 0.8813 |
F-Statistic | F = 48, (3, 16), P<0.0001 |
Ethiopia | Intercept (b0) | -8.0587 | 4.272 | -1.529 | 0.146 | -19.235 | 3.117 |
Time (b1) | 0.0043 | 0.003 | 1.643 | 0.120 | -0.001 | 0.010 |
Indicator (b2) | 0.0019 | 0.013 | 0.154 | 0.879 | -0.025 | 0.028 |
Time Lapsed (b3) | 0.0043 | 0.003 | 1.530 | 0.145 | -0.002 | 0.010 |
R2 | 0.9281 |
Adjusted R2 | 0.9146 |
F-Statistic | F = 68.82, (3, 16), P < 0.0001 |
Namibia | Intercept (b0) | -7.8854 | 4.9742 | -1.585 | 0.132 | -19.235 | 3.117 |
Time (b1) | 0.0043 | 0.0025 | 1.728 | 0.103 | -0.001 | 0.010 |
Indicator (b2) | 0.0029 | 0.0118 | 0.251 | 0.805 | -0.025 | 0.028 |
Time Lapsed (b3) | 0.0033 | 0.0027 | 1.254 | 0.228 | -0.002 | 0.010 |
R2 | 0.9227 |
Adjusted R2 | 0.9082 |
F-Statistic | F = 63.65, (3, 16), P < 0.0001 |
References
| [1] |
Box, G. E., & Tiao, G. C. (1975). Intervention analysis with applications to economic and environmental problems. Journal of the American Statistical association, 70(349), 70-79.
https://doi.org/10.1080/01621459.1975.10480264
|
| [2] |
Cordova-Pozo, K. L., Anishettar, S. S., Kumar, M., & Chokhandre, P. K. (2023). Trends in child marriage, sexual violence, early sexual intercourse and the challenges for policy interventions to meet the sustainable development goals. International journal for equity in health, 22(1), 250.
https://doi.org/10.1186/s12939-023-02060-9
|
| [3] |
Doubova, S. V., Arsenault, C., Contreras-Sanchez, S. E., Borrayo-Sanchez, G., & Leslie, H. H. (2022). The road to recovery: an interrupted time series analysis of policy intervention to restore essential health services in Mexico during the COVID-19 pandemic. Journal of global health, 12, 05033.
https://doi.org/10.7189/jogh.12.05033
|
| [4] |
Drzymalski, D. M., Guo, J. C., Qi, X. Q., Tsen, L. C., Sun, Y., Ouanes, J. P. P.,... & Hu, L. Q. (2021). The effect of the no pain labor & delivery-global health initiative on cesarean delivery and neonatal outcomes in china: an interrupted time-series analysis. Anesthesia & Analgesia, 132(3), 698-706.
https://doi.org/10.1213/ane.0000000000004805
|
| [5] |
Government of Namibia. (2021). Namibia Agenda 2063 Report.
|
| [6] |
Hausmann, R., Tyson, L. D., & Zahidi, S. (2006). The Global Gender Gap Report 2006.‖ World Economic Forum, Geneva Switzerland.
|
| [7] |
Krause, T. R., Seymour, K. J., & Sloat, K. C. M. (1999). Long-term evaluation of a behavior-based method for improving safety performance: a meta-analysis of 73 interrupted time-series replications. Safety Science, 32(1), 1-18.
https://doi.org/10.1016/s0925-7535(99)00007-7
|
| [8] |
Letourneau, E. J., Levenson, J. S., Bandyopadhyay, D., Sinha, D., & Armstrong, K. S. (2010). Evaluating the effectiveness of sex offender registration and notification policies for reducing sexual violence against women: Final report for National Institute of Justice. MUSC, Medical University of South Carolina.
|
| [9] |
Li, Y., Liu, X., Li, X., Xue, C., Zhang, B., & Wang, Y. (2023). Interruption time series analysis using autoregressive integrated moving average model: evaluating the impact of COVID-19 on the epidemic trend of gonorrhea in China. BMC Public Health, 23(1), 2073.
https://doi.org/10.1186/s12889-023-16953-5
|
| [10] |
Mohammed, H., & Abdul-Aziz, A. R. (2001). Modelling the Ghanaian Inflation Rates Using Interrupted Time Series Analysis Approach.
|
| [11] |
Nguyen, T. T., Darnell, A., Weissman, A., Frongillo, E. A., Mathisen, R., Lapping, K., Withers, M. (2020). Social, economic, and political events affect gender equity in China, Nepal, and Nicaragua: a matched, interrupted time-series study. Global health action, 13, 1712147.
https://doi.org/10.1080/16549716.2020.1712147
|
| [12] |
Pang, J., Chen, H., & Valente, M. J. (2026). Evaluation of statistical methods in R for estimating intervention effects using segmented linear regression in the AB interrupted time series design. BMC Medical Research Methodology, 26(1), 42.
https://doi.org/10.1186/s12874-026-02771-x
|
| [13] |
Penfold, R. B., & Zhang, F. (2013). Use of interrupted time series analysis in evaluating health care quality improvements. Academic pediatrics, 13, S38–S44.
https://doi.org/10.1016/j.acap.2013.08.002
|
| [14] |
Pervaiz, Z., Chani, M. I., Jan, S. A., & Chaudhary, A. R. (2011). Gender inequality and economic growth: a time series analysis for Pakistan.
|
| [15] |
Planning & Development Commission. (2020). Ethiopia: Progress Report on the First Ten Year Implementation Plan of African Union Development Agenda (Agenda 2063).
|
| [16] |
Puyat, J. H., & Kazanjian, A. (2020). Physician incentives and sex/gender differences in depression care: an interrupted time series analysis. Health Equity.
https://doi.org/10.1089/heq.2019.0034
|
| [17] |
Qin, L., Shanks, K., Phillips, G. A., & Bernard, D. (2019). The impact of lengths of time series on the accuracy of the ARIMA forecasting. International Research in Higher Education, 4(3), 58-68.
https://doi.org/10.5430/irhe.v4n3p58
|
| [18] |
Taljaard, M., McKenzie, J. E., Ramsay, C. R., & Grimshaw, J. M. (2014). The use of segmented regression in analysing interrupted time series studies: an example in pre-hospital ambulance care. Implementation Science, 9, 1–4.
https://doi.org/10.1186/1748-5908-9-77
|
| [19] |
Turner, S. L., Karahalios, A., Forbes, A. B., Taljaard, M., Grimshaw, J. M., & McKenzie, J. E. (2021). Comparison of six statistical methods for interrupted time series studies: empirical evaluation of 190 published series. BMC Medical Research Methodology, 21, 1–19.
https://doi.org/10.1186/s12874-021-01306-w
|
| [20] |
Ye, L. (2022). A practitioner’s guide to interrupted time series.
|
| [21] |
Yousuf, K., & Ng, S. (2021). Boosting high dimensional predictive regressions with time varying parameters. Journal of Econometrics, 224(1), 60-87.
https://doi.org/10.1016/j.jeconom.2020.08.003
|
| [22] |
Zhou, Q., Hu, J., Hu, W., Li, H., & Lin, G. Z. (2023). Interrupted time series analysis using the ARIMA model of the impact of COVID-19 on the incidence rate of notifiable communicable diseases in China. BMC Infectious Diseases, 23(1), 375.
https://doi.org/10.1186/s12879-023-08229-5
|
Cite This Article
-
APA Style
Kipkirui, L., Wagala, A., Lang’at, R. C. (2026). Interrupted Time Series Modelling of Gender Gap Index in Africa. International Journal of Data Science and Analysis, 12(4), 85-96. https://doi.org/10.11648/j.ijdsa.20261204.13
 Copy
|
Copy
|
 Download
ACS Style
Kipkirui, L.; Wagala, A.; Lang’at, R. C. Interrupted Time Series Modelling of Gender Gap Index in Africa. Int. J. Data Sci. Anal. 2026, 12(4), 85-96. doi: 10.11648/j.ijdsa.20261204.13
Copy
|
Download
AMA Style
Kipkirui L, Wagala A, Lang’at RC. Interrupted Time Series Modelling of Gender Gap Index in Africa. Int J Data Sci Anal. 2026;12(4):85-96. doi: 10.11648/j.ijdsa.20261204.13
Copy
|
Download
-
@article{10.11648/j.ijdsa.20261204.13,
  author = {Leonard Kipkirui and Adolphus Wagala and Reuben Cheruiyot Lang’at},
  title = {Interrupted Time Series Modelling of Gender Gap Index in Africa},
  journal = {International Journal of Data Science and Analysis},
  volume = {12},
  number = {4},
  pages = {85-96},
  doi = {10.11648/j.ijdsa.20261204.13},
  url = {https://doi.org/10.11648/j.ijdsa.20261204.13},
  eprint = {https://article.sciencepublishinggroup.com/pdf/10.11648.j.ijdsa.20261204.13},
  abstract = {Gender inequality remains a persistent structural challenge globally and across Africa, despite sustained policy commitments at national, regional, and continental levels. This study employed a retrospective Interrupted Time Series Analysis (ITSA) to assess trends in gender equality outcomes before and after the adoption of Agenda 2063 in 2013, the African Union’s long-term development framework for Africa’s transformation. Using World Economic Forum Gender Gap Index (GGI) data from 2006 to 2025, segmented regression models were applied to five African countries selected across regions based on the magnitude of change in gender equality over time. The intervention point was defined as 2013, coinciding with the formal adoption of Agenda 2063. Results indicate a general upward trajectory in gender equality across all the countries prior to the intervention with significance observed in Burkina Faso (b1 = 0.0086, t=4.314, p = 0.0005, 95% CI: 0.004 – 0.013) and Egypt (b1 = 0.0031, t=2.501, p = 0.0236, 95% CI: 0.001 – 0.006). Post-intervention effects, however, varied substantially. In Chad, there was evidence of immediate increase in closed gender gap (b2 = 0.0302, t = 2.982, p = 0.0088, 95% CI: 0.009 – 0.052) while Ethiopia and Namibia exhibited positive long-term gains in gender equality relative to counterfactual trends, though non-significant at α = 0.05. Sustained post-intervention reduction was observed in Burkina Faso and Egypt, with significance only in Burkina Faso (b3 = -0.0071, t = -3.316, p = 0.004, 95% CI: -0.012 – -0.003). Counterfactual analysis suggested that, by 2025, Agenda 2063 may have contributed to improvements in the Gender Gap Index ranging from 5.9% to 8.7% in Ethiopia and Namibia. On the other hand, counterfactuals for Burkina Faso, Chad and Egypt depicted better performance by between 0.17% and 11.9%, with the best performance observed in Burkina Faso, which is unusual and could be attributed to other external factors. The models for all the countries were significant (p 2 >0.81). These findings provide empirical evidence that continental policy frameworks can contribute to improved gender equality outcomes, though effects are heterogeneous, context-dependent and gradual. The study underscores the importance of sustained implementation, national-level policy alignment, and complementary institutional reforms to translate high-level commitments into tangible gender equality gains.},
 year = {2026}
}
Copy
|
Download
-
TY  - JOUR
T1  - Interrupted Time Series Modelling of Gender Gap Index in Africa
AU  - Leonard Kipkirui
AU  - Adolphus Wagala
AU  - Reuben Cheruiyot Lang’at
Y1  - 2026/08/27
PY  - 2026
N1  - https://doi.org/10.11648/j.ijdsa.20261204.13
DO  - 10.11648/j.ijdsa.20261204.13
T2  - International Journal of Data Science and Analysis
JF  - International Journal of Data Science and Analysis
JO  - International Journal of Data Science and Analysis
SP  - 85
EP  - 96
PB  - Science Publishing Group
SN  - 2575-1891
UR  - https://doi.org/10.11648/j.ijdsa.20261204.13
AB  - Gender inequality remains a persistent structural challenge globally and across Africa, despite sustained policy commitments at national, regional, and continental levels. This study employed a retrospective Interrupted Time Series Analysis (ITSA) to assess trends in gender equality outcomes before and after the adoption of Agenda 2063 in 2013, the African Union’s long-term development framework for Africa’s transformation. Using World Economic Forum Gender Gap Index (GGI) data from 2006 to 2025, segmented regression models were applied to five African countries selected across regions based on the magnitude of change in gender equality over time. The intervention point was defined as 2013, coinciding with the formal adoption of Agenda 2063. Results indicate a general upward trajectory in gender equality across all the countries prior to the intervention with significance observed in Burkina Faso (b1 = 0.0086, t=4.314, p = 0.0005, 95% CI: 0.004 – 0.013) and Egypt (b1 = 0.0031, t=2.501, p = 0.0236, 95% CI: 0.001 – 0.006). Post-intervention effects, however, varied substantially. In Chad, there was evidence of immediate increase in closed gender gap (b2 = 0.0302, t = 2.982, p = 0.0088, 95% CI: 0.009 – 0.052) while Ethiopia and Namibia exhibited positive long-term gains in gender equality relative to counterfactual trends, though non-significant at α = 0.05. Sustained post-intervention reduction was observed in Burkina Faso and Egypt, with significance only in Burkina Faso (b3 = -0.0071, t = -3.316, p = 0.004, 95% CI: -0.012 – -0.003). Counterfactual analysis suggested that, by 2025, Agenda 2063 may have contributed to improvements in the Gender Gap Index ranging from 5.9% to 8.7% in Ethiopia and Namibia. On the other hand, counterfactuals for Burkina Faso, Chad and Egypt depicted better performance by between 0.17% and 11.9%, with the best performance observed in Burkina Faso, which is unusual and could be attributed to other external factors. The models for all the countries were significant (p 2 >0.81). These findings provide empirical evidence that continental policy frameworks can contribute to improved gender equality outcomes, though effects are heterogeneous, context-dependent and gradual. The study underscores the importance of sustained implementation, national-level policy alignment, and complementary institutional reforms to translate high-level commitments into tangible gender equality gains.
VL  - 12
IS  - 4
ER  -
Copy
|
Download





 Share This Article
 Twitter
 Linked In
 Facebook