Research Article | | Peer-Reviewed

A Synthesis/Sorption Approach in the Remediation of Mixed Vat Dye Aqueous Solution Using Biosynthesized Copper Nanoparticles

Received: 3 September 2024     Accepted: 18 April 2025     Published: 19 September 2025
Views:       Downloads:
Abstract

Adsorption processes for the remediation of wastewater have been in literature for decades, it is conventional to make use of instruments such as; Centrifuge, Oven, water-bath shaker and others, during the synthesis of nanoparticle as an adsorbent. The above-mentioned instruments make the process costlier and cumbersome. Combining the synthesis and the adsorption processes into a single chamber proffer a locally practicable, cost effective and highly efficient methodology. The remediation of simulated mixed vat-dye wastewater during the formation of copper nanoparticles (Cu NPs) is presented in this work; abundance of flavonoids, saponin, terpenoids and catechins phytochemicals were noticed in the extracts which serves as the reducing agent, the sorption optimization results show that Chrysophyllum albidum aqueous extract effected a 100% dye removal at optimum pH of 9 (alkaline medium) while, Mimusops Coriacea aqueous extract had a 92.9% dye removal ability at the optimum pH of 5 (acidic medium). the reaction optimum time stands at 48 hours. Characterization of the sludge i.e., dye particles and copper nanoparticles revealed from the calculated X-ray diffraction (XRD) average crystal sizes of 5.89nm and 17.23nm for Mimusops Coriacea and Chrysophyllum albidum respectively. The FTIR shows presence of O-H, N-H, conjugation of C═O and C═C bands. The research presented the biosynthesized Cu NPs with aqueous extract Chrysophyllum albidum as reducing agent to be more efficient in degrading the dye mixture compared to Mimusops Coriacea aqueous extract. The study achieved a less laborious and a cost-effective method of remediating dye wastewater through the use of biosynthesized nanoparticle, which makes the process environment friendly.

Published in International Journal of Ecotoxicology and Ecobiology (Volume 10, Issue 3)
DOI 10.11648/j.ijee.20251003.15
Page(s) 71-89
Creative Commons

This is an Open Access article, distributed under the terms of the Creative Commons Attribution 4.0 International License (http://creativecommons.org/licenses/by/4.0/), which permits unrestricted use, distribution and reproduction in any medium or format, provided the original work is properly cited.

Copyright

Copyright © The Author(s), 2025. Published by Science Publishing Group

Keywords

Water Remediation, Simulated Dye Effluent, Aqueous Extract, Nanotechnology, Sorption

1. Introduction
The number six of the Sustainable Development Goals (SDGs) as adopted by all United Nations Member States in 2015 has been premised on achieving access to safe and affordable drinking water for all by the year 2030 . Tiseo noted that ‘86% of the world’s urban population had access to safely managed drinking water services while, 60% of the rural population have such access’ in accordance with 2020 water source statistics. Access to safe water by most rural communities can be speedily achieved through locally modified approaches.
Dyeing activity, which is an important finishing process of textile industries has been one of the many ways in which water bodies are being polluted through the release of the process’s effluents . ‘Dye effluents degrade the aesthetic quality of bodies of water by increasing biochemical and chemical oxygen demand, impairing photosynthesis which negatively affects plant growth disrupting food chain. These dyes which are mostly recalcitrant in nature, through bioaccumulation stimulate toxicity, mutagenicity, and carcinogenicity to animal lives . Our study focuses on the mixture of two common vat dyes under the trade names; blue R. S. and blue R. S. N B. A. S. F., vat dye gained popularity in cotton dyeing due to its excellent fastness, unending brightness and versatility .
Nanotechnology proffers a mean of purifying polluted water through adsorption process, the conventional approach around adsorption is to first prepare the nanomaterial before being applied for remediation, Rafique et al., prepared copper nanoparticles from copper sulphate pentahydrate with fish scale extract, this mixture required a non-stopping shaking and heating for 1 hr., followed by filtration, centrifugation, washing of the precipitate and drying after which, the stored biosynthesized copper nanoparticles had to be stirred with orange-26 dye solution using hot plate magnetic stirrer for 90 minutes. Also, Rajeshkumar et al., prepared copper nanoparticles through incubation of copper sulphate solution with leave extract in a shaker for 48 hours at room temperature for catalytic degradation of methyl red and eosin dye solutions.
This study presents a novel approach of remediating wastewater i.e., vat dye solution, by cutting off the use of instruments such as (i) the water bath shaker which agitate the solid adsorbent with the adsorbate for effective adsorption (ii) the centrifuge for the separation of synthesized nanoparticles from its mother liquor, (iii) the oven to dry the synthesised nanoparticles before being used in adsorption process. The mentioned unit operations above make the purification process expensive, restrictive (not locally practicable) and prone to contamination due to longer procedural steps.
This study considers the bottom-up approach of synthesizing nanoparticles and then incorporate the sorption purifying process, this makes it a-two processes in one container methodology i.e., a single approach of synthesis/application.
The reductive ability of the aqueous leaves extract of African Star Apple - Chrysophyllum albidum (Family: Sapotaceae) and Mimusops coriacea’s Apple - Mimusops Coriacea (Family: Sapotaceae) were examined through their phytochemical screenings.
The effect of pH, initial concentration and time were carried out for the optimization of the sorption process.
The aim of this research work is to remediate the mixed dye solution through the biosynthesis process of copper nanoparticle using aqueous leaves extract of African Star Apple Chrysophyllum albidum (Family: Sapotaceae) in comparison to Monkey’s Apple Mimusops Coriacea (Family: Sapotaceae) as reducing agents.
2. Materials and Methods
2.1. Plant Collection
Fresh healthy leaves of African Star Apple, Chrysophyllum albidum (Family: Sapotaceae) and Monkey’s Apple, Mimusops Coriacea (Family: Sapotaceae) were obtained from Ajayi Crowther Univeristy Community, Oyo State, Nigeria.
2.2. Reagents and Equipment Used
Basic chemical reagents used are Copper sulphate pentahydrate, CuSO4.5H2O, NaOH, H2SO4, distilled water, Blue RSN dye (Vat blue 4), Blue RS dye (Vat blue 4b).
Standard apparatus and instruments needed for this study are: Boiling tubes, Cotton wool, White Mesh cloth, 11 μm filter paper, Oven, weighing balance, pH meter, Visible spectrophotometer (GS-V11), XRD (Rigaku D/Max-lllC X-ray diffractometer), FTIR (Nicolet iS10 FT-IR Spectrophotometer) and other general apparatus used in a chemical laboratory.
All reagents were of analytical grade from Aldrich chemical limited, USA.
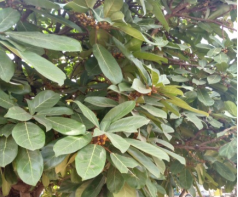
Figure 1. Chrysophyllum albidum plant tree.
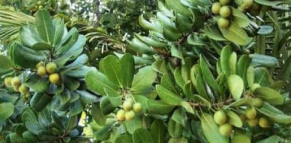
Figure 2. Mimusops coriacea plant tree.
2.3. Preparation of Standard Solutions
A 0.05 M Copper sulphate pentahydrate - CuSO4. 5H2O (M Wt. 249.68 g/mol) was prepared by dissolving 12.48 g of the salt in 1 L of distilled water using volumetric flask. A 2 g/L of mixed dye was prepared as follows; 1 g of Blue RSN dye in 0.5 L of distilled water and 1 g of Blue RS dye in 0.5 L of distilled water. Other working concentrations were prepared by serial dilution of the prepared standard solutions.
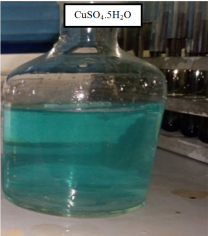
Figure 3. Copper standard solutions.
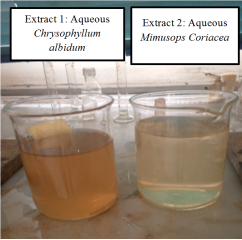
Figure 4. Extract of 1 and 2.
2.4. Preparation of Plants Extract
The preparation of the leaves extract follows the method employed by Oyetola ‘for each of the leaves, a 6.71 g⁄mL leaves concentration was prepared by soaking the washed leaves weighing 1000 g of the leaves in 149mL of distilled water at room temperature i.e., 28°C, left for five (5) days after which, a clean meshed cloth was used to separate the filtrate from the residue and 11 μm Whatmann filter paper was use to re-filter the filtrate. The leaves extracts were labeled according to the Table 1 and kept at 4°C until further use’.
Table 1. Plant extract label.

Plant leaves

Sample label

Chrysophyllum albidum

1

Mimusops coriacea

2

2.5. Phytochemical Screening of the Plant Extract
Standard procedures were employed to test for the presence of phytochemicals with regard to Oyetola work;
Saponins: 5mL of each leave extracts were mixed with 20cm3 of distilled water and then agitated in a graduated cylinder for 15 minutes. Formation of foam indicates the presence of Saponins.
Phenols: leaves extracts were mixed with 2cm3 of 2% FeCl3 solution. A black colour indicates the presence of phenols.
Flavonoids: 5 drops of 20% sodium hydroxide solution were added each leaves extract. A change to yellow colour which on addition of acid changed to colourless solution shows the presence of flavonoids.
Anthraquinones: This was done by adding few drops of 2% hydrochloric acid to each leaves extract. Appearance of red colour indicates presence of anthraquinones.
Anthocyanins: 2mL of extract was added to 2mL of 2 M HCl and Ammonia. The appearance of pink-red which turns to blue-violet indicates the presence of anthocyanins.
Coumarins: 4cm3 of 10% NaOH was added to 2cm3 of extract and the formation of yellow colour indicates the presence of coumarins.
Emodins: To 3mL of the extract, 3mL of NH4OH and 5mL of Benzene was added. Appearance of red colour indicates the presence of emodins.
Terpenoid: To 2mL of the plant extract, 2mL of acetic anhydride and 2mL of concentrated H2SO4 were added. The formation of blue green ring indicates the presence of terpenoids.
Steroids: 1mL of the plant extract was dissolved in 10mL of chloroform and equal volume of concentrated Sulphuric acid was added by sides of the test tube. The upper layer turns red and Sulphuric acid layer showed yellow with green fluorescence. This indicated the presence of steroids in each of the plant leaves aqueous extracts.
2.6. Biosynthesis/Sorption Process
Figure 5 presents a pictorial diagram of the one-pot synthesis/sorption process; it starts with the mixing of the copper nanoparticles’ precursors i.e. 0.05mol/dm3 copper salt and 6.71g⁄mL plant extract. The volume ratio of the biosynthesis process is 1:1 for plant extract: copper salt respectively, these mixtures were poured into the substance to be remediated i.e. mixed dye solution.
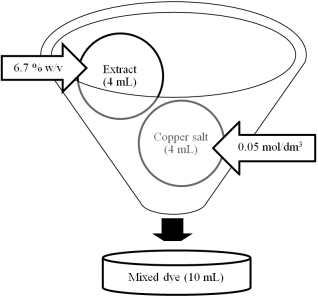
Figure 5. An overall framework of the biosynthesis and sorption process pictorially.
The forming and formed nanoparticles interact with the dye molecules to form sludge at the bottom of the reaction container (boiling tube), these residues were oven dried and sent for FTIR, and XRD characterizations while, the supernatant were decanted off and their absorbance values were read with visible spectrophotometer.
2.6.1. Effect of Initial Mixed Dye Concentrations on Sorption Capacity
A 10mL of varying concentrations of the dyes (2.00 x 100, 1.00 x 100, 5.00 x 10⁻¹, 2.50 x 10⁻¹, 1.25 x 10⁻¹, 6.25 x 10⁻², 3.13 x 10⁻² and 1.56 x 10⁻² g/L) were contacted with 10mL of Copper nanoparticles precursors (5mL of 6.71 g⁄mL extract and 5mL of 0.05 mold m3 copper salt). The contents were reacted inside of boiling tubes at room temperature (28°C) using cotton wool as a cover to keep it from atmospheric interference for a period of 48 hrs. The un-adsorbed dye was determined with Visible spectrophotometer (General scientific) at the predetermined wavelength of 600nm. The absorbance values gotten were converted to concentration term using the plotted calibration curve. The percentatge removal which is a crucial signal of adsorption capacity of the copper nanoparticle for the removal of mixed vat-blue-4 dye was calculated as follows:
percentage removed= Ci-CfCi x 100
Where, Ci and Cf are the initial and final concentrations of the dye (g/L).
2.6.2. Effect of pH on Sorption Capacity of the Process
A 10mL of 2.00 x 100 g/L was contacted with 10mL of Copper nanoparticles precursors (5mL of 6.71 g⁄mL extract and 5mL of 0.05 mold m3 copper salt). For each extract, seven boiling tubes with the above volume ratio content were made, with careful addition of 2M H2SO4 and 2M NaOH, different pH of 1, 3, 5, 7, 9, 11 were prepared at room temperature (28°C) using cotton wool as a cover to keep the content from atmospheric interference for a period of 48 hrs. The supernatant absorbance was determined using Visible spectrophotometer (General scientific) at the predetermined wavelength of 600nm. The absorbance values gotten were converted to concentration term using the plotted calibration curve. The percentatge removal which is a crucial signal of adsorption capacity of the copper nanoparticle for the removal of mixed vat-blue-4 dye was calculated as follows:
percentage removed= Ci-CfCi x 100
Where, Ci and Cf are the initial and final concentrations of the dye (g/L).
2.6.3. Effect of Contact Time
A 10mL of varying concentrations of the dyes (2.00 x 100, 1.00 x 100, 5.00 x 10⁻¹, 2.50 x 10⁻¹, 1.25 x 10⁻¹, 6.25 x 10⁻², 3.13 x 10⁻² and 1.56 x 10⁻² g/L) were contacted with 10mL of Copper nanoparticles precursors (5mL of 6.71 g⁄mL extract and 5mL of 0.05 mold m3 copper salt). The contents were left to react inside of boiling tubes at room temperature (28°C) using cotton wool as a cover to keep it from atmospheric interference. At exactly 12 hrs of the start of the process, a small portion of the supernatant was carefully taken inside of the Visible spectrophotometer (General scientific) cuvette to measure its absorbance, same were done at 24 hrs and 48 hrs. The absorbance values gotten were converted to concentration term using the plotted calibration curve. The percentatge removal which is a crucial signal of adsorption capacity of the copper nanoparticle for the removal of mixed vat-blue-4 dye was calculated as follows:
percentage removed= Ci-CfCi x 100
Where, Ci and Cf are the initial and final concentrations of the dye (g/L).
2.7. Instrumental Characterizations
The residue i.e. copper nanoparticle and dye were characterized using Fourier Transform Infra Red (FTIR), and X ray Diffractometer (XRD) for functional group presence and particle’s morphology.
Visible Spectrophotometer: GS-V11 spectrophotometer was employed to measure the absorbance of the supernatant, the absorbance values were used to determine the concentration of dye left in the initial dye solution after being reacted with the formed nanoparticles, and this follows the principle of beer lambert law which states that absorbance is directly proportional to the concentration of dilute solution. The lambda max of the mixed dye was gotten to be 600nm through Visible scanning of its dilute sample at different wavelength (400nm – 800nm ± 5nm). The lambda max is the sensitive wavelength of the dye solution where minute trace of the dye can be picked by the Instrument.
Fourier Transform Infrared Spectrophotometer: Fourier transform infrared spectroscopy (FT-IR) analysis was performed in all samples isolated to have a prompt result regarding the bio mineral. A few crystals were mixed with KBr (Merck for spectroscopy) and pulverized in an agate mortar to form a homogenous powder from which, under a pressure of 7 tons, the appropriate pellet was prepared. All spectra were recorded from 4000 to 400cm-1 using the Perkin Elmer 3000 MX spectrometer. Scans were 32 per spectrum with a resolution of 4cm-1. The IR spectra were analysed using the spectroscopic software Win-IR Pro Version 3.0 with a peak sensitivity of 2cm-1.
X-Ray Diffractometer: Powder Diffraction Methods is useful for Qualitative analysis (Phase Identification), Quantitative analysis (Lattice parameter determination & Phase fraction analysis) etc. The XRD analysis is based on passing X-ray beam through a clay sample. The X-ray identifies the structural layers which is dependent on the d-spacing of the clay minerals. The d-spacing is the exact spacing of the staking of the crystal lattices which indicates the arrangement of the atoms in a mineral. The X-ray on passing through the samples gives peaks that is typical of each type of diffracted along a group of planes and the way they are diffracted is characteristics of the arrangement of the atoms within the mineral.
Powdered samples were pelletized and sieved to 0.074mm. These were later taken in an aluminum alloy grid (35mm x 50mm) on a flat glass plate and covered with a paper. Wearing hand gloves, the samples were compacted by gently pressing them with the hand.
Each sample was run through the Rigaku D/Max-lllC X-ray diffractometer developed by the Rigaku Int. Corp. Tokyo, Japan and set to produce diffractions at scanning rate of 2 0/min in the 2 to 500 at room temperature with a CuKa radiation set at 40 kV and 20 mA. The diffraction data (d value and relative intensity) obtained was compared to that of the standard data of minerals from the mineral powder diffraction file, ICDD which contained and includes the standard data of more than 3000 minerals.
The interpretation of the diffractograms was done by using the reference conversion table to 20 to d-values for the Fek alpha radiation to the JCPDC manual (1972).
The average crystalline size of synthesized nanoparticles was calculated by using the Scherer formula as shown in Eq.
D= 0.94 x λβcosθ
Where, D is the average crystalline size, λ is wavelength in angstrom (i.e. 0.1541nm), β is the FWHM (full width at half maximum) in radian and θ is the diffraction angle in degree. The value of d (the interplanar spacing between the atoms) is calculated using Bragg’s Law: 2dsinθ = n λ, Wavelength λ = 1.5418 Å for Cu Ka, n= 1.
d=n x λ2sinθ
3. Results and Discussion
3.1. Phytochemical Screening
The results of the phytochemical screening for the aqueous plant leaves extract of Chrysophyllum albidum and Mimusops coriacea are presented in Table 2.
Table 2. Phytochemical screening of the aqueous leaves extract.

Extract Test

Chrysophyllum albidum

Mimusops coriacea

Alkaloids

+

-

Polyphenols

++

++

Tannins

++

++

Saponin

++

+++

Flavonoids

+

+++

Catechins

++

+++

Terpenoids

++

+++

Anthocyanins

-

-

Coumarins

+

-

Polysterol

-

-

NB: +++ = abundance; ++ = strongly present; + = present; - = absent
The presence of Alkaloids, Polyphenols, Saponins, Flavonoids in the Chrysophyllum albidum is in agreement with Okoli and Okere work though a different result was presented with regard tannin which was absent in Okoli and Okere phytochemical screening result. Others phytochemical present are Catechins, Terpenoids and Coumarins while, Anthocyanins and Polysterol are absent.
The phytochemical analysis on the aqueous extract of Mimusops coriacea shows the presence of Polyphenols and Tannins which is in tandem to the work of Saraswathi et al., on ethanolic extract of Mimusops coriacea but a different result was noticed with regard to alkaloids, as this work presents an absence of alkaloids, which was present in ethanolic extract of the plant leave by Saraswathi et al., , other phytochemical present are Saponin, Flavonoids, Catechins, Terpenoids while Anthocyanins, Coumarins and Polysterol are absent in the aqueous extract of the plant leaves. It was generally observed that flavonoids, saponin, terpenoids and catechins have higher concentration in Mimusops coriacea than Chrysophyllum albidum.
3.2. Sorption Optimization Study
3.2.1. Effect of Initial Mixed Dye Concentration
The effect of initial dye concentration in the sorption process is presented in Table 3.
Table 3. Effect of Initial mixed dye concentration (Chrysophyllum albidum).

Sample label

Initial Concentration (g/L)

Actual Concentration (g/L)

Final Concentration (g/L)

Percentage Removal%

A

2.00 x 100

1.00 x 100

0.00

100

B

1.00 x 100

5.00 x 10⁻¹

0.021732

95.7

C

5.00 x 10⁻¹

2.50 x 10⁻¹

0.017668

93.0

D

2.50 x 10⁻¹

1.25 x 10⁻¹

0.019102

84.8

E

1.25 x 10⁻¹

6.25 x 10⁻²

0.017907

71.4

F

6.25 x 10⁻²

3.13 x 10⁻²

0.020537

34.3

G

3.13 x 10⁻²

1.56 x 10⁻²

0.020298

-30.0

H

1.56 x 10⁻²

7.81 x 10⁻³

0.01982

-153.7

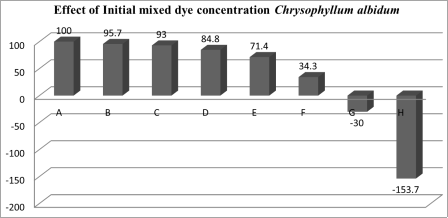
Figure 6. Bar chart showing the effect of initial mixed dye concentration after sorption process.
The effect of initial dye concentration in the sorption process is presented in Figure 6.
The result shows that the sorption process is favourably at higher concentration and not favourably at concentrations below 3.13 x 10⁻² g/L with respect to the mixture ratio 5mL: 5mL of the nanoparticle precursors of 6.71 g⁄mL extract: 0.05 moldm-3 copper salt respectively, it was observed that the reaction mixture forms brownish coloured suspension of the extract. Optimally, at a concentration of 1.00 x 100 g/L with respect to the mixture ratio 5mL: 5mL of the nanoparticle precursors of 6.71 g⁄mL extract: 0.05 moldm-3 copper salt respectively, the process is most efficient which resulted in the percentage removal of 100%.
The effect of initial dye concentration in the sorption process is presented in Table 4.
Table 4. Effect of Initial mixed dye concentration (Mimusops Coriacea).

Sample label

Initial Concentration (g/L)

Actual Concentration (g/L)

Final Concentration (g/L)

Percentage Removal%

A

2.00 x 100

1.00 x 100

0.71461

92.9

B

1.00 x 100

5.00 x 10⁻¹

0.055443

89.0

C

5.00 x 10⁻¹

2.50 x 10⁻¹

0.21254

91.5

D

2.50 x 10⁻¹

1.25 x 10⁻¹

0.019581

84.4

E

1.25 x 10⁻¹

6.25 x 10⁻²

0.019342

69.1

F

6.25 x 10⁻²

3.13 x 10⁻²

0.020089

35.9

G

3.13 x 10⁻²

1.56 x 10⁻²

0.01983

-26.9

H

1.56 x 10⁻²

7.81 x 10⁻³

0.01982

-153.7

The effect of initial dye concentration in the sorption process is presented in Figure 7.
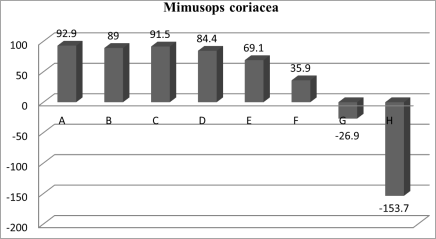
Figure 7. Bar chart showing the effect of initial mixed dye concentration after sorption process.
The result shows that the sorption process is favourably at higher concentration and not favourably at concentrations below 3.13 x 10⁻²g/L with respect to the mixture ratio 5mL: 5mL of the nanoparticle precursors of 6.71g⁄mL extract: 0.05 moldm-3 copper salt respectively, it was observed that the reaction mixture forms brownish coloured suspension of the extract. Optimally, at a concentration of 1.00 x 100 g/L with respect to the mixture ratio 5mL: 5mL of the nanoparticle precursors of 6.71 g⁄mL extract: 0.05 moldm-3 copper salt respectively, the process is most efficient which resulted in the percentage removal of 92.9%.
3.2.2. Effect of pH
The effect of varying pH in the sorption process is presented in Table 5.
Table 5. Effect of pH (Chrysophyllum albidum).

pH

Initial Concentration (g/L)

Actual Concentration (g/L)

Final Concentration (g/L)

Percentage Removal (%)

1

2.00 x 100

1.00 x 100

0.5185

48.2

3

2.00 x 100

1.00 x 100

0.6870

31.3

5

2.00 x 100

1.00 x 100

0.0215

97.9

7

2.00 x 100

1.00 x 100

0.0117

98.9

9

2.00 x 100

1.00 x 100

0.0100

99.0

11

2.00 x 100

1.00 x 100

0.0693

93.1

The effect of varying pH in the sorption process is presented in Figure 8.
The result shows that the sorption process was greatly influenced by the presence of hydrogen ion concentration. Basic medium tends to favor, at a fixed concentration of 1.00 x 100 g/L of the mixed dye combined with the mixture ratio 5mL: 5mL of the nanoparticle precursors of 6.71 g⁄mL extract: 0.05 moldm-3 copper salt respectively, it was observed that the sorption process optimum pH stands at 9 which resulted in the percentage removal of 99.0%.
The effect of varying pH in the sorption process is presented in Table 6.
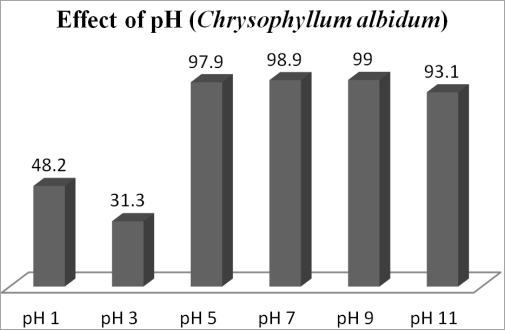
Figure 8. Bar chart showing the effect of pH on the sorption process.
Table 6. Effect of pH (Mimusops Coriacea).

pH

Initial Concentration (g/L)

Actual Concentration (g/L)

Final Concentration (g/L)

Percentage Removal%

1

2.00 x 100

1.00 x 100

0.2209

11.7

3

2.00 x 100

1.00 x 100

0.2462

1.60

5

2.00 x 100

1.00 x 100

0.0186

92.6

7

2.00 x 100

1.00 x 100

0.0918

63.3

9

2.00 x 100

1.00 x 100

0.0483

80.7

11

2.00 x 100

1.00 x 100

0.2453

1.90

The effect of varying pH in the sorption process is presented in Figure 9.
The result shows that the sorption process was greatly influenced by the presence of hydrogen ion concentration. Acidic medium tends to favor, at a fixed concentration of 1.00 x 100 g/L of the mixed dye combined with the mixture ratio 5mL: 5mL of the nanoparticle precursors of 6.71 g⁄mL extract: 0.05 moldm-3 copper salt respectively, it was observed that the sorption process optimum pH stands at 9 which resulted in the percentage removal of 92.6%.
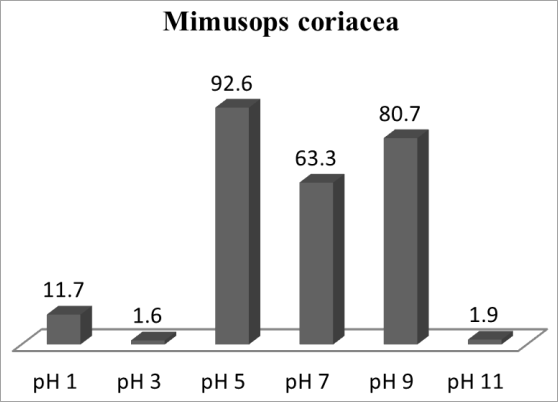
Figure 9. Bar chart showing the effect of pH on the sorption process.
3.2.3. Effect of Contact Time
The effect in time duration on the sorption process is presented in Table 7.
Table 7. Effect of Time (Chrysophyllum albidum).

Sample

Time

Initial Concentration (g/L)

Actual Concentration (g/L)

Final Concentration (g/L)

Percentage Removal%

A

At 12 hours

2.00 x 100

1.00 x 100

0.182155

81.8

A

At 24 hours

2.00 x 100

1.00 x 100

0.061181

93.9

A

At 48 hours

2.00 x 100

1.00 x 100

0

100

B

At 12 hours

1.00 x 100

5.00 x 10⁻¹

0.068831

86.3

B

At 24 hours

1.00 x 100

5.00 x 10⁻¹

0.032969

93.5

B

At 48 hours

1.00 x 100

5.00 x 10⁻¹

0.021732

95.7

C

At 12 hours

5.00 x 10⁻¹

2.50 x 10⁻¹

0.029144

88.4

C

At 24 hours

5.00 x 10⁻¹

2.50 x 10⁻¹

0.018863

92.5

C

At 48 hours

5.00 x 10⁻¹

2.50 x 10⁻¹

0.017668

93

D

At 12 hours

2.50 x 10⁻¹

1.25 x 10⁻¹

0.028666

77.1

D

At 24 hours

2.50 x 10⁻¹

1.25 x 10⁻¹

0.019102

84.8

D

At 48 hours

2.50 x 10⁻¹

1.25 x 10⁻¹

0.018385

85.3

E

At 12 hours

1.25 x 10⁻¹

6.25 x 10⁻²

0.017907

71.4

E

At 24 hours

1.25 x 10⁻¹

6.25 x 10⁻²

0.017668

71.8

E

At 48 hours

1.25 x 10⁻¹

6.25 x 10⁻²

0.010017

84.0

F

At 12 hours

6.25 x 10⁻²

3.13 x 10⁻²

0.020537

34.3

F

At 24 hours

6.25 x 10⁻²

3.13 x 10⁻²

0.018863

39.7

F

At 48 hours

6.25 x 10⁻²

3.13 x 10⁻²

0.010257

67.2

G

At 12 hours

3.13 x 10⁻²

1.56 x 10⁻²

0.010017

35.9

G

At 24 hours

3.13 x 10⁻²

1.56 x 10⁻²

0.015994

-2.4

G

At 48 hours

3.13 x 10⁻²

1.56 x 10⁻²

0.020298

-30

H

At 12 hours

1.56 x 10⁻²

7.81 x 10⁻³

0.010017

-28.3

H

At 24 hours

1.56 x 10⁻²

7.81 x 10⁻³

0.015755

-101.7

H

At 48 hours

1.56 x 10⁻²

7.81 x 10⁻³

0.01982

-153.7

The effect in time duration on the sorption process is presented in Figure 10.
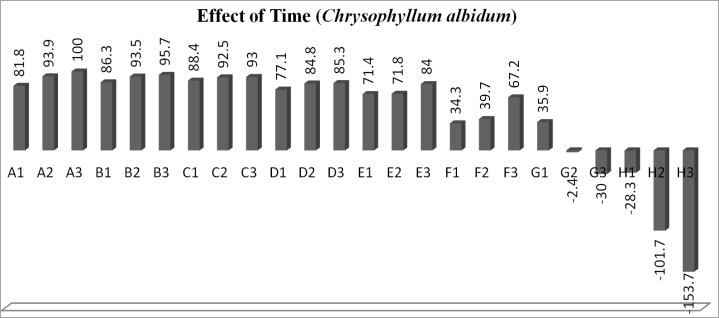
Figure 10. Bar chart showing the effect of contact time on the sorption process.
It is expected that the sorption process percentage removal should increase with time as the process is a one pot synthesis/sorption approach where the forming and formed nanoparticles interacted with the dye molecules, so at the time of 12 hours which is assumed that the biosynthesis process is yet to be concluded the percentage removal were generally lower to the value gotten at 24 hours and it was observed that the nanoparticles has been fully formed and interacted with the mixed dye molecules at time 48 hours, it was seen in most of the result on effect of time, the closeness of percentage removal between 24 hours and 48 hours compared to those between 12 hours and 24 hours. The result shows that the synthesis/sorption process is completed at 48 hours at the fixed concentration of 1.00 x 100g/L of the mixed dye combined with the mixture ratio 5mL: 5mL of the nanoparticle precursors of 6.71g⁄mL extract: 0.05 mold m-3 copper salt respectively, the process is most efficient which resulted in the percentage removal of 100%.
The effect in time duration on the sorption process is presented in table 8.
Table 8. Effect of Time (Mimusops Coriacea).

Sample

Time

Initial Concentration (g/L)

Final Concentration (g/L)

Percentage Removal%

A

At 12 hours

1.00 x 100

0.71461

92.9

A

At 24 hours

1.00 x 100

0.055443

94.5

A

At 48 hours

1.00 x 100

0.029622

97.1

B

At 12 hours

5.00 x 10⁻¹

0.055443

89.0

B

At 24 hours

5.00 x 10⁻¹

0.036077

92.8

B

At 48 hours

5.00 x 10⁻¹

0.01284

95.1

C

At 12 hours

2.50 x 10⁻¹

0.021254

91.5

C

At 24 hours

2.50 x 10⁻¹

0.020537

91.8

C

At 48 hours

2.50 x 10⁻¹

0.010017

96

D

At 12 hours

1.25 x 10⁻¹

0.020059

84

D

At 24 hours

1.25 x 10⁻¹

0.019581

84.4

D

At 48 hours

1.25 x 10⁻¹

0.010017

92

E

At 12 hours

6.25 x 10⁻²

0.019581

68.7

E

At 24 hours

6.25 x 10⁻²

0.019342

69.1

E

At 48 hours

6.25 x 10⁻²

0.010017

84.0

F

At 12 hours

3.13 x 10⁻²

0.020089

35.9

F

At 24 hours

3.13 x 10⁻²

0.016712

46.6

F

At 48 hours

3.13 x 10⁻²

0.010257

67.2

G

At 12 hours

1.56 x 10⁻²

0.010496

32.9

G

At 24 hours

1.56 x 10⁻²

0.016712

-7

G

At 48 hours

1.56 x 10⁻²

0.01983

-26.9

H

At 12 hours

7.81 x 10⁻³

0.010496

-34.4

H

At 24 hours

7.81 x 10⁻³

0.016473

-110.9

H

At 48 hours

7.81 x 10⁻³

0.01982

-153.7

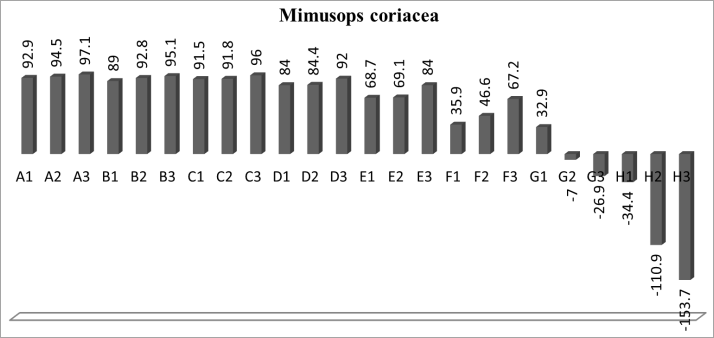
Figure 11. Bar chart showing the effect of contact time on the sorption process.
The effect in time duration on the sorption process is presented in figure 11.
It is expected that the sorption process percentage removal should increase with time as the process is a one pot synthesis/sorption approach where the forming and formed nanoparticles interacted with the dye molecules, so at the time of 12 hours which is assumed that the biosynthesis process is yet to be concluded the percentage removal were generally lower to the value gotten at 24 hours and it was observed that the nanoparticles has been fully formed and interacted with the mixed dye molecules at time 48 hours, it was seen in most of the result on effect of time, the closeness of percentage removal between 24 hours and 48 hours compared to those between 12 hours and 24 hours. The result shows that the synthesis/sorption process is completed at 48 hours at the fixed concentration of 1.00 x 100 g/L of the mixed dye combined with the mixture ratio 5mL: 5mL of the nanoparticle precursors of 6.71 g⁄mL extract: 0.05 moldm-3 copper salt respectively, the process is most efficient which resulted in the percentage removal of 97.1%.
3.3. Fourier Transform Infra-Red (FTIR) Characterization
The FTIR spectrum of the sludge formed after degradation of the mixed dye with copper nanoparticles using Chrysophyllum albidum is presented in Figure 12.
3.3.1. FTIR Spectrum of the Residue from Cu NPs (Chrysophyllum albidum)/Mixed Dye
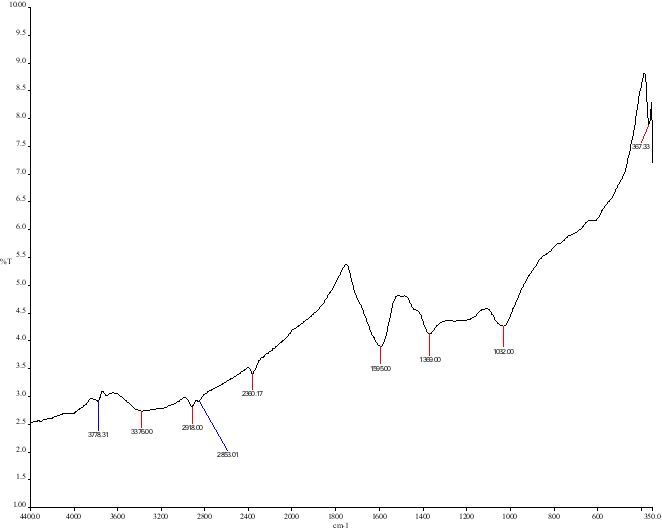
Figure 12. FTIR spectrum of the residue gotten from Cu NPs (Chrysophyllum albidum)/Mixed dye.
The summary of the FTIR spectrum on the sludge formed after degradation of the mixed dye with copper nanoparticles using Chrysophyllum albidum is presented in Table 9.
Table 9. Prominent peaks and their interpretations in Chrysophyllum albidum mediated residue.

Band (cm-1)

Position of some characteristics absorption

Discussion

3778.31

Free O-H stretch

It can be from moisture content and most of the phytochemicals contain O-H

3376.00

Intramolecular hydrogen bonding in O-H, Polyphenol OH, N-H

Indanthrene has two NH group in its structure, being confirmed by the band, water molecule is being picked up and polyphenol presence is confirmed in the extract

2918.00

C-H stretch

Organic structure being confirmed

2360.17

C=C conjugation

Anthraquinone being the Chromophore presence in vat dye is being confirmed

1595.00

Aromatic ring

Presence of ring structure attributed to the vat and extract compounds

1369.00

C-H defiance in CH3, C-O of primary alcohol

Hydrocarbon of the organic compounds.

1032.00

C-O-C ester, C-N, Silica SiO2

Silica is an inclusion of impurities

3.3.2. FTIR Spectrum of the Residue from Cu NPs (Mimusops coriacea)/Mixed Dye
The FTIR spectrum of the sludge formed after degradation of the mixed dye with copper nanoparticles using Mimusops coriacea is presented in Figure 13.
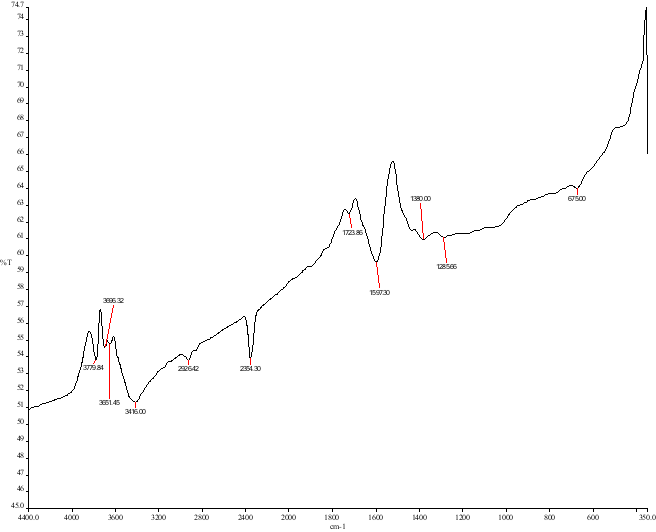
Figure 13. FTIR spectrum of the residue gotten from Cu NPs (Mimusops coriacea)/Mixed dye.
The summary of the FTIR spectrum on the sludge formed after degradation of the mixed dye with copper nanoparticles using Mimusops coriacea is presented in Table 10.
Table 10. Prominent peaks and their interpretations in Mimusops coriacea mediated residue.

Band (cm-1)

Position of some characteristics absorption

Discussion

3779.84

Free O-H group

It can be from moisture content and most of the phytochemicals contain O-H

3416.00

N-H stretch, OH of polyphenol, intermolecular O-H

Indanthrene has two NH group in its structure, being confirmed by the band, water molecule is being picked up and polyphenol presence is confirmed in the extract

2926.42

C-H stretch

Hydrocarbon component of the molecules

2354.30

C=C conjugation

Anthraquinone being the Chromophore presence in vat dye is being confirmed

1723.86

C=O conjugation

The carbonyl in the anthraquinone is being confirmed

1597.30

Aromatic ring

Presence of ring structure attributed to the vat and extract compounds

It is noticed generally that the characteristics peaks for metal-oxide at around 540cm-1 were not very pronounced as expected, this may be due to greater proportion of dye in the residue.
3.4. X-ray Diffraction
The XRD spectrum of the formed sludge after degradation of the mixed dye with copper nanoparticles using Chrysophyllum albidum is presented in Figure 14.
3.4.1. XRD Spectrum of the Residue from Cu NPs (Chrysophyllum albidum)/Mixed Dye
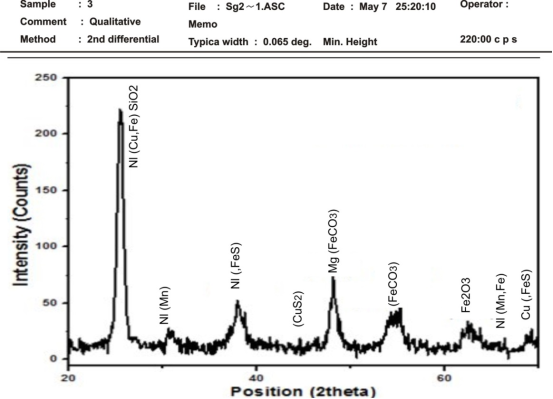
Figure 14. XRD spectrum of the residue gotten from Cu NPs (Chrysophyllum albidum)/Mixed dye.
The peaks are for the following detected compounds: Ni (Cu, Fe) SiO2, Ni (Mn), Ni (FeS), (CuS2), Mg (FeCO3), (FeCO3), Fe2O3, Ni(Mn, Fe) and Cu (FeS).
The summary and calculation of relevant data to determine the crystal size from the XRD spectrum on the sludge formed after degradation of the mixed dye with copper nanoparticles using Chrysophyllum albidum is presented in Table 11 using Scherer’s equation.
Table 11. Calculated crystal size of the dried residue of Chrysophyllum albidum extract mediated nanoparticle using Scherer’s equation.

Θ

Cos θ

βcosθ

0.94 x λ

D= 0.94 x λβcosθ

26.5

13.3

0.973

0.051

0.1449

2.84nm

31.5

15.8

0.962

0.017

0.1449

8.52nm

38.0

19.0

0.946

0.049

0.1449

2.96nm

45.0

22.5

0.924

0.003

0.1449

48.30nm

48.0

24.0

0.914

0.035

0.1449

4.14nm

54.0

27.0

0.891

0.050

0.1449

2.90nm

62.5

31.3

0.855

0.027

0.1449

5.37nm

66.0

33.0

0.839

0.002

0.1449

72.45nm

68.5

34.3

0.826

0.019

0.1449

7.62nm

The result presented particle sizes between 2.84nm and 72.45nm, having average particle size of 17.23nm.
Poorly defined sharp peaks (broadening) suggested that the crystalline quality is low due to influence of the dye on the synthesised copper nanoparticles.
The summary and calculation of relevant data to determine the crystal interplanar spacing from the XRD spectrum on the sludge formed after degradation of the mixed dye with copper nanoparticles using Chrysophyllum albidum is presented in Table 12 using Bragg’s equation.
Table 12. Calculated Interplanar spacing of the dried residue of Chrysophyllum albidum extract mediated nanoparticle using Bragg’s equation.

θ

Sin θ

2sinθ

n x λ

d=n x λ2sinθ

26.5

13.3

0.2301

0.4602

0.1542

0.34nm

31.5

15.8

0.2723

0.5446

0.1542

0.28nm

38.0

19.0

0.3256

0.6512

0.1542

0.24nm

45.0

22.5

0.3827

0.7654

0.1542

0.20nm

48.0

24.0

0.4067

0.8134

0.1542

0.19nm

54.0

27.0

0.4540

0.9080

0.1542

0.17nm

62.5

31.3

0.5195

1.0390

0.1542

0.15nm

66.0

33.0

0.5446

1.0892

0.1542

0.14nm

68.5

34.3

0.5635

1.1270

0.1542

0.14nm

The interplanar size is a direct function of the developing pores and shape of crystals, the results present a range of 0.14 and 0.34nm.
3.4.2. XRD Spectrum of the Residue from Cu NPs (Mimusops coriacea)/Mixed Dye
The XRD spectrum of the formed sludge after degradation of the mixed dye with copper nanoparticles using Mimusops coriacea is presented in Figure 15.
The peaks are for the following detected compounds: Fe2O3, Mg (FeCO3), (CuS2), Ni (FeS2), Ni(Cu, Fe)SiO2, Cu (FeS), (FeCO3), Ni (FeS) and Ni (Mn, Fe).
The summary and calculation of relevant data to determine the crystal size from the XRD spectrum on the sludge formed after degradation of the mixed dye with copper nanoparticles using Mimusops coriacea is presented in table 13 using Scherer’s equation.
Table 13. Calculated crystal size of the dried residue of Mimusops coriacea extract mediated nanoparticle using Scherer’s equation.

θ

Cos θ

βcosθ

0.94 x λ

D= 0.94 x λβcosθ

26.0

13.0

0.974

0.051

0.1449

2.84nm

31.0

15.5

0.964

0.017

0.1449

8.52nm

38.0

19.0

0.946

0.033

0.1449

4.39nm

47.5

23.8

0.915

0.024

0.1449

6.04nm

55.0

27.5

0.887

0.046

0.1449

3.15nm

63.5

31.8

0.850

0.031

0.1449

4.67nm

69.5

34.8

0.821

0.017

0.1449

8.52nm

72.0

36.0

0.809

0.014

0.1449

10.35nm

76.0

38.0

0.788

0.032

0.1449

4.53nm

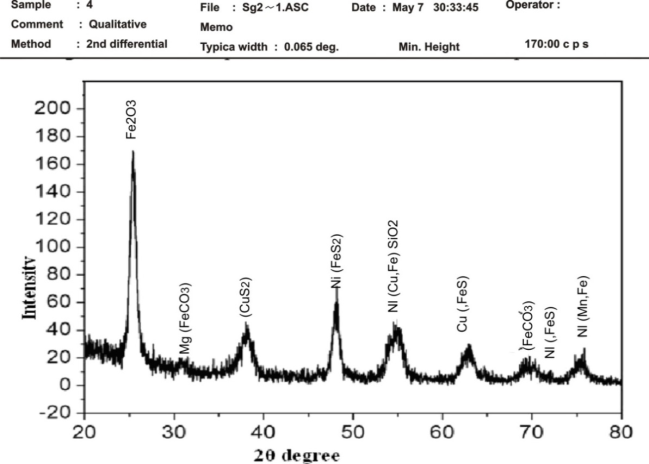
Figure 15. XRD spectrum of the residue gotten from Cu NPs (Mimusops coriacea)/Mixed dye.
The result presented particle sizes between 2.84nm and 10.35nm, having average particle size of 5.89nm. The average particle size value is lesser than apple star mediated nanoparticle, which implies a higher surface area.
Poorly defined sharp peaks (broadening) suggested that the crystalline quality is low due to influence of the dye on the synthesised copper nanoparticles.
The summary and calculation of relevant data to determine the crystal interplanar spacing from the XRD spectrum on the sludge formed after degradation of the mixed dye with copper nanoparticles using Mimusops coriacea is presented in table 14 using Bragg’s equation.
Table 14. Calculated Interplanar spacing of the dried residue of Mimusops coriacea extract mediated nanoparticle using Bragg’s equation.

θ

Sin θ

2sinθ

n x λ

d=n x λ2sinθ

26.0

13.0

0.2250

0.45

0.1542

0.34nm

31.0

15.5

0.2672

0.53

0.1542

0.29nm

38.0

19.0

0.3256

0.65

0.1542

0.24nm

47.5

23.8

0.4036

0.81

0.1542

0.19nm

55.0

27.5

0.4618

0.92

0.1542

0.17nm

63.5

31.8

0.5270

1.05

0.1542

0.15nm

69.5

34.8

0.5707

1.14

0.1542

0.14nm

72.0

36.0

0.5878

1.18

0.1542

0.13nm

76.0

38.0

0.6157

1.23

0.1542

0.13nm

The interplanar size is a direct function of the developing pores and shape of crystals, the results present a range of 0.13 and 0.34nm.
4. Conclusion
It can be concluded that optimum values of initial dye concentration, pH and contact time were established for the adherance of vat-blue-4 dye molecules onto copper nanoparticles sites. Chrysophyllum albidum gave a better sorption performance of 100% against Mimusops coriacea of 92.9% at the actual concentration of 1.00 x 100 g/L, also, the optimum pH for Chrysophyllum albidum and Mimusops coriacea stand at 9 and 5 respectively. While their best time for completion of the reaction is 48 hours, though, a literal sense of rate through the average of their percentage removal at the first instance of 12 hours for sample A to G shows that Mimusops coriacea effectiveness stands at 70.7% while Chrysophyllum albidum stands at 57.7.
X ray Diffraction pattern gave information on translational symmetry for size of the unit cell from Peak Positions and identifies the structural layers which is dependent on the d-spacing of the minerals, the d-spacing is the exact spacing of the staking of the crystal lattices which indicates the arrangement of the atoms in the residue, it was revealed the synthesised particles fell within the range of 1-100 nanometer with that of Mimusops coriacea 5.89nm which gave a better result than Chrysophyllum albidum at average size 17.23nm also, the interplanar spacing average for both Chrysophyllum albidum and Mimusops coriacea looks similar i.e. 0.21nm and 0.20nm respectively. The abundance of flavonoids, saponin, terpenoids and catechins contributed to the perceived small sizes of the formed nanoparticles.
The FTIR shows presence of O-H, N-H, conjugation of C═O and C═C bands confirming the residue a mixture of dye and extract’s phytochemicals as major constituents.
It is concluded that a pot synthesis and sorption processes has been achieved giving way to a less costly, locally applicable and an environmentally friendly means of remediating dye (vat dye) polluted water.
Abbreviations

BASF

Baden Aniline & Soda Factory

ICDD

International Center for Diffraction Data)

JCPDC

Joint Committee on Powder Diffraction Standards

XRD

X-ray Diffractometer

FT-IR

Fourier Transform Infra Red

Cu NPs

Copper Nanoparticles

Conflicts of Interest
The authors declare no conflicts of interest.
Appendix
Appendix I: Calibration Curve of the Mixed Dye
Plotting Calibration curve of the mixed Vat blue 4 dye at 600nm.
Table A1. Concentration vs. Absorbance of the dilute mixed vat-blue-4 dye.

Concentration (g/L)

Absorbance

0.028

0.101

0.056

0.205

0.110

0.395

0.220

0.813

0.330

1.398

0.440

1.789

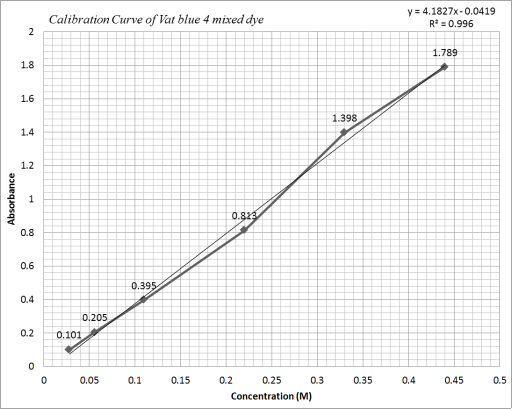
Figure A1. Calibration plot of Concentration vs. Absorbance of the mixed vat-blue-4 dye.
Appendix II: Pictures of the Biosynthesis/Sorption Process
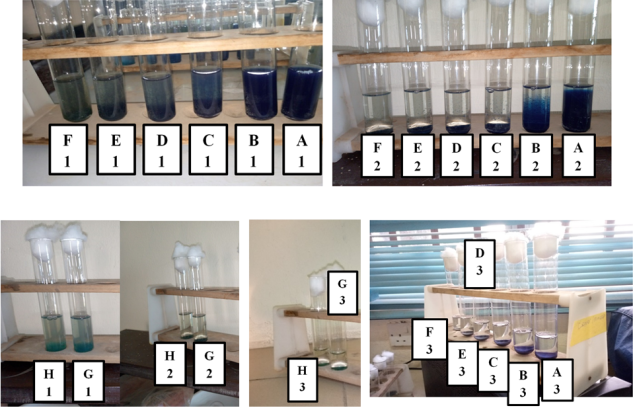
Figure A2. Pictures showing the remediation of the mixed dye at varying concentration at the 48th’s hour.
NB: 1: 10 minutes of the reaction, 2: 2 hours and 3: 48 hours
A: 1.00 x 100 g/L, B: 5.00 x 10⁻¹ g/L, C: 2.50 x 10⁻¹ g/L, D: 1.25 x 10⁻¹, E: 6.25 x 10⁻², F: 3.13 x 10⁻², G: 1.56 x 10⁻², H: 7.81 x 10⁻³
Appendix III: Bar Chart of Tested Phytochemicals in the African Start Apple Aqueous Extract
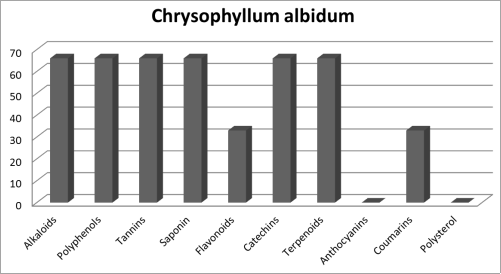
Figure A3. Illustrative bar chart of the ten tested phytochemicals in Chrysophyllum albidum extract.
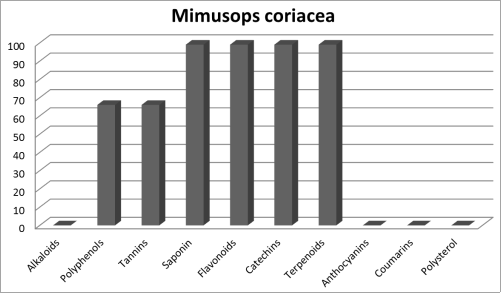
Figure A4. Illustrative bar chart of the ten tested phytochemicals in Mimusops coriacea extract.
References
[1] United Nations, Department of Economic and Social Affairs. Sustainable Development. Ensure availability and sustainable management of water and sanitation for all – Goal 6.
[2] Tiseo I. (2023) Global urban and rural drinking water coverage 2020. Energy and Environment, water & wastewater. Statista
[3] Isai K., Anil V. and Shankar S., (2019) Photocatalytic degradation of methylene blue using ZnO and 2%Fe–ZnO semiconductor nanomaterials synthesized by sol–gel method: a comparative study. Springer Nature Switzerland. 1: 1247 |
[4] Al-Tohamy R., Sameh S. A., Fanghua L., Kamal M., Yehia A. G. Mahmood, Tamer E., Haixin J., Yinyi F., Jianzhong S. (2022) A critical review on the treatment of dye-containing wastewater: Ecotoxicology and health concerns of Textile dyes and possible remediation approaches for environmental safety. Ecotoxicology and Environmental Safety. 231: 113160.
[5] Veeraco colourants pvt ltd (2022) all about vat dyes. Veeraco.com/blog/all about vat dyes, accessed on September 9, 2023. Indian.
[6] Rafique M. A, Kiran S., Ashraf A., Mukhtar N., Rizwan S., Ashraf M. (2022) Effective removal of direct orange 26 dye using copper nanoparticles synthesized from tilapia fish scale. Global NEST journal. 24(2) 311-317.
[7] Rajeshkumar S., M. Vanaja, and Arunachalam K. (2021) Degradation of Toxic Dye Using Phytomediated Copper Nanoparticles and Its Free-Radical Scavenging Potential and Antimicrobial Activity against Environmental Pathogens. Hindawi Bioinorganic Chemistry and Applications. 2021 (1222908): 1-10.
[8] Oyetola E. O. (2023) Comparative Studies of Biosynthesized Zinc Oxide Nanoparticles. Nanochem Res, 8(1): 31-39.
[9] Okoli J. B. and Okere S. O. (2010) Antimicrobial activity of the phytochemical constituents of chrysophyllum albidum (African star apple) plant. Journal of research of the national institute of standards and technology. 8(1): 301-311.
[10] Saraswathi S., Raghavender M. P, Devihalli C. M., Raveesha K. A. (2008) Antifungal activity of a known medicinal plant mimusops elengi L. against grain moulds. Journal of Agricultural Technology. 4(1): 151-165.
Cite This Article
  • APA Style

    Oyetola, E. O., Nwosu, F. O., Obasi, A. E. (2025). A Synthesis/Sorption Approach in the Remediation of Mixed Vat Dye Aqueous Solution Using Biosynthesized Copper Nanoparticles. International Journal of Ecotoxicology and Ecobiology, 10(3), 71-89. https://doi.org/10.11648/j.ijee.20251003.15

    Copy | Download

    ACS Style

    Oyetola, E. O.; Nwosu, F. O.; Obasi, A. E. A Synthesis/Sorption Approach in the Remediation of Mixed Vat Dye Aqueous Solution Using Biosynthesized Copper Nanoparticles. Int. J. Ecotoxicol. Ecobiol. 2025, 10(3), 71-89. doi: 10.11648/j.ijee.20251003.15

    Copy | Download

    AMA Style

    Oyetola EO, Nwosu FO, Obasi AE. A Synthesis/Sorption Approach in the Remediation of Mixed Vat Dye Aqueous Solution Using Biosynthesized Copper Nanoparticles. Int J Ecotoxicol Ecobiol. 2025;10(3):71-89. doi: 10.11648/j.ijee.20251003.15

    Copy | Download

  • @article{10.11648/j.ijee.20251003.15,
      author = {Emmanuel Oladeji Oyetola and Friday Onyekwere Nwosu and Amarachi Esther Obasi},
      title = {A Synthesis/Sorption Approach in the Remediation of Mixed Vat Dye Aqueous Solution Using Biosynthesized Copper Nanoparticles
    },
      journal = {International Journal of Ecotoxicology and Ecobiology},
      volume = {10},
      number = {3},
      pages = {71-89},
      doi = {10.11648/j.ijee.20251003.15},
      url = {https://doi.org/10.11648/j.ijee.20251003.15},
      eprint = {https://article.sciencepublishinggroup.com/pdf/10.11648.j.ijee.20251003.15},
      abstract = {Adsorption processes for the remediation of wastewater have been in literature for decades, it is conventional to make use of instruments such as; Centrifuge, Oven, water-bath shaker and others, during the synthesis of nanoparticle as an adsorbent. The above-mentioned instruments make the process costlier and cumbersome. Combining the synthesis and the adsorption processes into a single chamber proffer a locally practicable, cost effective and highly efficient methodology. The remediation of simulated mixed vat-dye wastewater during the formation of copper nanoparticles (Cu NPs) is presented in this work; abundance of flavonoids, saponin, terpenoids and catechins phytochemicals were noticed in the extracts which serves as the reducing agent, the sorption optimization results show that Chrysophyllum albidum aqueous extract effected a 100% dye removal at optimum pH of 9 (alkaline medium) while, Mimusops Coriacea aqueous extract had a 92.9% dye removal ability at the optimum pH of 5 (acidic medium). the reaction optimum time stands at 48 hours. Characterization of the sludge i.e., dye particles and copper nanoparticles revealed from the calculated X-ray diffraction (XRD) average crystal sizes of 5.89nm and 17.23nm for Mimusops Coriacea and Chrysophyllum albidum respectively. The FTIR shows presence of O-H, N-H, conjugation of C═O and C═C bands. The research presented the biosynthesized Cu NPs with aqueous extract Chrysophyllum albidum as reducing agent to be more efficient in degrading the dye mixture compared to Mimusops Coriacea aqueous extract. The study achieved a less laborious and a cost-effective method of remediating dye wastewater through the use of biosynthesized nanoparticle, which makes the process environment friendly.
    },
     year = {2025}
    }
    

    Copy | Download

  • TY  - JOUR
    T1  - A Synthesis/Sorption Approach in the Remediation of Mixed Vat Dye Aqueous Solution Using Biosynthesized Copper Nanoparticles
    
    AU  - Emmanuel Oladeji Oyetola
    AU  - Friday Onyekwere Nwosu
    AU  - Amarachi Esther Obasi
    Y1  - 2025/09/19
    PY  - 2025
    N1  - https://doi.org/10.11648/j.ijee.20251003.15
    DO  - 10.11648/j.ijee.20251003.15
    T2  - International Journal of Ecotoxicology and Ecobiology
    JF  - International Journal of Ecotoxicology and Ecobiology
    JO  - International Journal of Ecotoxicology and Ecobiology
    SP  - 71
    EP  - 89
    PB  - Science Publishing Group
    SN  - 2575-1735
    UR  - https://doi.org/10.11648/j.ijee.20251003.15
    AB  - Adsorption processes for the remediation of wastewater have been in literature for decades, it is conventional to make use of instruments such as; Centrifuge, Oven, water-bath shaker and others, during the synthesis of nanoparticle as an adsorbent. The above-mentioned instruments make the process costlier and cumbersome. Combining the synthesis and the adsorption processes into a single chamber proffer a locally practicable, cost effective and highly efficient methodology. The remediation of simulated mixed vat-dye wastewater during the formation of copper nanoparticles (Cu NPs) is presented in this work; abundance of flavonoids, saponin, terpenoids and catechins phytochemicals were noticed in the extracts which serves as the reducing agent, the sorption optimization results show that Chrysophyllum albidum aqueous extract effected a 100% dye removal at optimum pH of 9 (alkaline medium) while, Mimusops Coriacea aqueous extract had a 92.9% dye removal ability at the optimum pH of 5 (acidic medium). the reaction optimum time stands at 48 hours. Characterization of the sludge i.e., dye particles and copper nanoparticles revealed from the calculated X-ray diffraction (XRD) average crystal sizes of 5.89nm and 17.23nm for Mimusops Coriacea and Chrysophyllum albidum respectively. The FTIR shows presence of O-H, N-H, conjugation of C═O and C═C bands. The research presented the biosynthesized Cu NPs with aqueous extract Chrysophyllum albidum as reducing agent to be more efficient in degrading the dye mixture compared to Mimusops Coriacea aqueous extract. The study achieved a less laborious and a cost-effective method of remediating dye wastewater through the use of biosynthesized nanoparticle, which makes the process environment friendly.
    
    VL  - 10
    IS  - 3
    ER  - 

    Copy | Download

Author Information
  • Abstract
  • Keywords
  • Document Sections

    1. 1. Introduction
    2. 2. Materials and Methods
    3. 3. Results and Discussion
    4. 4. Conclusion
    Show Full Outline
  • Abbreviations
  • Conflicts of Interest
  • Appendix
  • References
  • Cite This Article
  • Author Information