1. Introduction
In Ethiopia, soil erosion has been a problem ever since man started to cultivate the soil and domesticate animals
| [9] | FAO. (2017). GIEWS country brief - Ethiopia, November 2017. |
[9]
and
| [1] | Ademe, Y., Kebede, T., Mullatu, A., & Shafi, T. (2017). Evaluation of the effectiveness of soil and water conservation practices on improving selected soil properties in Wonago district, Southern Ethiopia. Journal of Soil Science and Environmental Management, 8(3), 70-79. |
[1]
. Soil erosion in Ethiopia is not a new phenomenon; it is as old as the history of agriculture itself, but the problem attracted the attention of policymakers only after the devastating famine problem in 1973–1974
| [8] | Ellis, F., Kutengule, M., and Nyasulu, A. (2003). Livelihoods and rural poverty reduction in Malawi. World Development, 31(9), 1495-1510. |
[8]
. Land degradation and soil erosion are strongly linked to population pressure and continuous cultivation in the Ethiopian highlands. The prevalence of traditional agricultural land use and the absence of appropriate resource management often result in the degradation of natural soil fertility
| [2] | Anley, Y., Bogale, A., and Haile‐Gabriel, A. (2007). Adoption decision and use intensity of soil and water conservation measures by smallholder subsistence farmers in Dedo district, Western Ethiopia. Land degradation and development, 18(3), 289-302. |
[2]
. Although data on the extent of the problems are rare, patchy, and inconsistent, available estimates indicate that the average rate of soil erosion is nearly 10 times the rates of soil-water regeneration in the highlands, and the rate of soil nutrient depletion is the highest in sub-Saharan Africa
| [16] | Mammo, S., & Debisa, A. (2025). Evaluation of technical feasibility of physical soil and water conservation structures in Ijara watershed, Nonno district, west Shewa zone, Oromia, Ethiopia. Discover Sustainability, 6(1), 295. |
| [17] | Moges, D. M., and Taye, A. A. (2017). Determinants of farmers’ perception to invest in soil and water conservation technologies in the North-Western Highlands of Ethiopia. International Soil and Water Conservation Research, 5(1), 56-61. |
[16, 17]
. The average annual rate of soil loss in the country is estimated at 42 t/ha/year, which results in 1–2% of crop loss, and it can be even higher on steep slopes and in places where the vegetation cover is low
| [3] | Asfaw, D., and Neka, M. (2017). Factors affecting adoption of soil and water conservation practices: the case of Wereillu Woreda (District), South Wollo Zone, Amhara Region, Ethiopia. International Soil and Water Conservation Research, 5(4), 273-279. |
[3]
.
Soil degradation in Ethiopia can be seen as a direct result of past agriculture practices in its highlands, and the processes of over-cultivation, deforestation, and overgrazing lead to accelerated soil erosion
| [3] | Asfaw, D., and Neka, M. (2017). Factors affecting adoption of soil and water conservation practices: the case of Wereillu Woreda (District), South Wollo Zone, Amhara Region, Ethiopia. International Soil and Water Conservation Research, 5(4), 273-279. |
[3]
. Some farming practices in the Highlands also contribute to erosion. These include the cultivation of cereal crops such as teff, sorghum, barley, and wheat
, which require the preparation of a finely tilled seedbed, mono cropping, and up-and-down slope plugging to facilitate drainage. According to
| [4] | Bekele, A., Aticho, A., & Kissi, E. (2018). Assessment of community based watershed management practices: emphasis on technical fitness of physical structures and its effect on soil properties in Lemo district, Southern Ethiopia. Environmental Systems Research, 7(1), 20. |
[4]
report, the productive land in Ethiopia has been exposed to land degradation mainly due to high population pressure, deforestation, a lack of integrated bio-physical SWC measures, and continuous cultivation that affects the physical, chemical, and biological properties of soils and results in on-site nutrient loss and off-site sedimentation of water resources. Prior to 1974, conservation of agricultural land was largely neglected due to the singular dominance given to industrial growth over agriculture. In the wake of the 1985 famine, the then-Ethiopian government launched an ambitious program of SWC measures supported by donors and backed up by the largest food-for-work program in the country
| [19] | Semu, A. (2018). The impact of soil and water conservation for improved agricultural production in Ethiopia. J Agri., 1(1): 9-12. |
[19]
. During this massive mobilization of resources, the Ethiopian highlands have also been targeted
| [19] | Semu, A. (2018). The impact of soil and water conservation for improved agricultural production in Ethiopia. J Agri., 1(1): 9-12. |
[19]
. For instance, between 1976 and 1988, through food-for-work (FFW) programmers, 800,000 km of soil and stone bunds on agricultural land were constructed; 600,000 km of hillside terraces were built; and 80,000 hectares were closed for regeneration and forestation of steep slopes
| [21] | Teka, K., Haftu, M., Ostwald, M., and Cederberg, C. (2020). Can integrated watershed management reduce soil erosion and improve livelihoods? A study from northern Ethiopia. International Soil and Water Conservation Research, 8(3), 266-276. |
[21]
. In Ethiopia, about 1.5 billion tons of topsoil is eroded each year, and 30,000 hectares of farmland are lost annually due to water erosion
| [20] | Sisay, D. (2017). Effects of soil and water conservation practices on biophysical attributes, livestock feed resources availability and peoples livelihood condition of Debre Mewi watershed, North-west Ethiopia: M.sc unpublished thesis, Bahir Dar University. |
[20]
. The latest land degradation estimates indicate that out of the 52 million hectares of land making up the highlands of Ethiopia, 14 million hectares are severely degraded, 13 million hectares are moderately degraded, and 2 million hectares have practically lost the minimum soil cover needed to produce crops
| [20] | Sisay, D. (2017). Effects of soil and water conservation practices on biophysical attributes, livestock feed resources availability and peoples livelihood condition of Debre Mewi watershed, North-west Ethiopia: M.sc unpublished thesis, Bahir Dar University. |
[20]
. To address the issue of land degradation and soil erosion, the Ethiopian government has been actively implementing conservation projects since 1973, with assistance from international organizations.
In Ethiopia, intensive soil and water conservation measures were constructed, especially on croplands. However, reports indicated that these conservation structures have not been adopted and sustainably used by the farmers
| [2] | Anley, Y., Bogale, A., and Haile‐Gabriel, A. (2007). Adoption decision and use intensity of soil and water conservation measures by smallholder subsistence farmers in Dedo district, Western Ethiopia. Land degradation and development, 18(3), 289-302. |
| [6] | Bojago, E., Senapathy, M., Ngare, I., & Dado, T. B. (2022). Assessment of the effectiveness of biophysical soil and water conservation structures: a case study of Offa Woreda, Wolaita Zone, Ethiopia. Applied and Environmental Soil Science, 2022(1), 6910901. |
[2, 6]
. The role of improved stone terraces and soil bund conservation practices in enabling farmers to improve their productivity has been valued for the last three decades
| [7] | Debisa, A., Regasa, T., & Mammo, S. (2025). Effects of physical soil and water conservation structures and slope gradients on selected soil properties in Ijara watershed, Nonno district, West Shewa, Ethiopia. Discover Sustainability, 6(1), 147. |
[7]
.
Due to severe climate risks, weak land management, lack of technical skill in implementation of improved soil and water conservation measures, and low crop productivity in Ethiopia, in the past two decades, research focus has been mostly on the on-site effects of soil erosion. The result of this condition can be associated with the extremely poor agricultural production systems, low income, and poor living status of society
| [10] | Fenetahun, Y., Yuan, Y., Xinwen, X., and Yongdong, W. (2021). Effects of grazing enclosures on species diversity, phenology, biomass, and carrying capacity in Borana Rangeland, Southern Ethiopia. Frontiers in Ecology and Evolution, 517. |
[10]
.
Implementing improved physical structures and biological/agronomic/soil conservation measures, particularly in farming systems with diverse climates and socio-economic and ecological conditions such as in Ethiopia, is challenging
| [11] | Gadisa, N., & Midega, T. (2021). Soil and water conservation measures in Ethiopia: importance and adoption challenges. World Journal of Agricultural & Soil Science, 6(3). |
[11]
. As a result, the promotion of improved soil conservation practices and agricultural technologies has been one of the major focuses of Ethiopia's development policy, as well as most of the other development factors in the country
| [12] | Gebremeskel, G., Gebremicael, T. G., and Girmay, A. (2018). Economic and environmental rehabilitation through soil and water conservation, the case of Tigray in northern Ethiopia. Journal of Arid Environments, 151, 113-124. |
[12]
. Although many factors contributed to the failure of soil conservation interventions, the main reason was that planners and implementing agencies ignored local level biophysical and socioeconomic realities
| [14] | Hurni H. (1991). Degradation and conservation of the soil resources in the Ethiopian highlands: In African Mountains and Highlands: Problems and Prospective. |
[14]
. According to
| [14] | Hurni H. (1991). Degradation and conservation of the soil resources in the Ethiopian highlands: In African Mountains and Highlands: Problems and Prospective. |
[14]
, uncontrolled soil erosion and weak land management has become the major caused for crop yield reduction from year to year in Ethiopia.
A study conducted by
| [15] | Kifle, S., Teferi, B., Kebedom, A., & Legesse, A. (2016). Factors influencing farmer's decision on the use of introduced soil and water conservation practices in the lowland’s of Wenago Woreda, Gedeo Zone, Ethiopia. American Journal of Rural Development, 4(1), 24-30. |
[15]
, in Northern Ethiopia indicated that crop yields increased by 7% compared to the situation without stone bunds and also yield increased from 632 to 683 kg per hectare for cereals, farm 501 to 556 kg per hectare (11%) for Eragrostistef and from 335-to 351 kg per hectare for cicerarietinum. This finding implies that SWC measures has a significant role in maintaining soil moisture, soil fertility, agricultural production, mitigating anthropogenic land degradation and improving livelihoods. In connection with this, the study conducted by
| [15] | Kifle, S., Teferi, B., Kebedom, A., & Legesse, A. (2016). Factors influencing farmer's decision on the use of introduced soil and water conservation practices in the lowland’s of Wenago Woreda, Gedeo Zone, Ethiopia. American Journal of Rural Development, 4(1), 24-30. |
[15]
estimate a mean seasonal runoff reduction of 40% in Andit Tid (Northern Ethiopia) to 62% in Gununo (South Ethiopia) because of SWC technologies. This result showed that forming stone and soil bunds is of vital importance in fighting dissertation, soil erosion, drought, poverty and famine in Ethiopia.
Currently, there is evidence that smallholder farmers in rural Ethiopia are participating in diverse land management programs and livelihood strategies away from on-farm engagement towards non-farm and off-farm activities to generate additional income for survival and cope with agricultural risks. Previous studies by
| [17] | Moges, D. M., and Taye, A. A. (2017). Determinants of farmers’ perception to invest in soil and water conservation technologies in the North-Western Highlands of Ethiopia. International Soil and Water Conservation Research, 5(1), 56-61. |
[17]
showed that various personal (attitude, perception, awareness), economic (financial income), institutional (fertilizer, credit, extension service), and biophysical attributes have influential roles in smallholder farmers' decisions on the adoption of improved physical structures. However, according to
| [15] | Kifle, S., Teferi, B., Kebedom, A., & Legesse, A. (2016). Factors influencing farmer's decision on the use of introduced soil and water conservation practices in the lowland’s of Wenago Woreda, Gedeo Zone, Ethiopia. American Journal of Rural Development, 4(1), 24-30. |
[15]
, the relationship between these attributes has not yet been well studied; there were no relevant studies concerning the impact of adoption of improved soil and water conservation structures on crop yield and smallholder farmers' annual income. In addition, there are no quantitative studies to show the impacts of soil erosion problems, only a few scientific works have been done, and there is not enough information on the existing impacts of improved SWC technologies on smallholder farmer income and its adoption determinant factors
| [18] | Muche, K., & Molla, E. (2024). Assessing the Impacts of Soil Water Conservation Activities and Slope Position on the Soil Properties of the Gelda Watershed, Northwest Ethiopia. Applied and Environmental Soil Science, 2024(1), 6858460. |
[18]
.
Rural farmers of the study area have limited opportunities for earning cash income and they face distinct problems which include shortage of farm land, cash income, housing, illiteracy and poor access to schooling (which hinders access to new technologies), fragmentation of land holding and poorly developed institutions of smallholder agricultural production. Declining soil fertility resulting from continuous cropping has led to declining yield of coffea arabica, Ensete ventricosum, fruits, root and other cereal crops in the study area. Though several scientific studies on SWC measures had been conducted in the study area, the majority of them focused on farmers' participation in SWC activities and coverage of terraced areas without relating the benefit of improved SWC structures at the household level. The low livelihood status of rural farmers and their shortage of income were not reported figuratively. To end this problem, none of these empirical studies were conducted in the study area
| [19] | Semu, A. (2018). The impact of soil and water conservation for improved agricultural production in Ethiopia. J Agri., 1(1): 9-12. |
[19]
. Therefore, the main purpose this research is (i) to assess the impact of improved physical structures (stone terraces and soil bunds) on crop yield and rural farmers' annual income.
Findings obtained from this original research can aid or assist policy makers, planners, world, national, and local communities, stakeholders, adopter farmers, professional researchers, experts, and other concerned individuals to enhance the adoption of introduced physical structures in the study area and Ethiopia.
2. Materials and Methods
2.1. Description of the Study Area
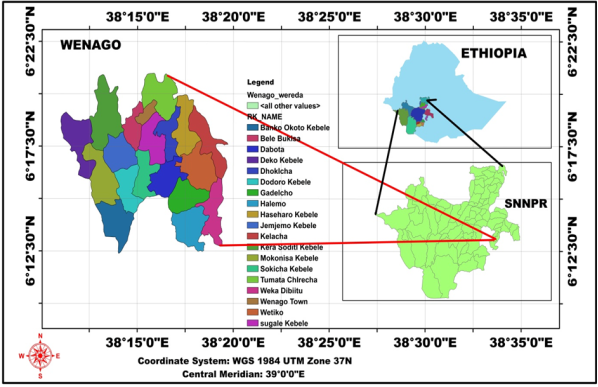
The research was conducted in Wenago district, South Ethiopia, 375 km away south of the capital city Addis Ababa. The study area is one of the eight districts in Gedeo zone. It is located between 6°
12ꞌ 30ꞌꞌ - 6°
22ꞌ 30ꞌꞌ N latitude and 38° 15ꞌ 0ꞌꞌ - 38°
20ꞌ 0ꞌꞌ (
Figure 1). The study district consists a total of 21 kebeles of which 17 are rural and the rest 4 are small administrative towns. Wenago district is bordered in the west by Abaya district (Oromiya); in the south by Yirga Cheffie district; in the north by Sidama regional state; and in the east by Dilla Zuria district. The altitudes of the study area ranges from 1100 m.a.s.l. in the West to 2100 m.a.s.l. in the Eastern highlands, with mean annual temperature and rainfall of 12–22°C and 900–1,400 mm, respectively. The rainfall distribution in the study area was bimodal (March to May and September to November
| [11] | Gadisa, N., & Midega, T. (2021). Soil and water conservation measures in Ethiopia: importance and adoption challenges. World Journal of Agricultural & Soil Science, 6(3). |
[11]
. Nitosols which are derived from volcanic rocks are the most dominant soil type covering the highest proportion of the study area and are important for coffee growing areas
| [3] | Asfaw, D., and Neka, M. (2017). Factors affecting adoption of soil and water conservation practices: the case of Wereillu Woreda (District), South Wollo Zone, Amhara Region, Ethiopia. International Soil and Water Conservation Research, 5(4), 273-279. |
[3]
. Based on the Gedeo zone plan and economy development bureau annual report (2023), the recent population projection of the study district has a total of 152,000 with an area of 248 square kilometers giving the population density of 613 persons/km
2. 92% of the study population lived in rural areas, and the remaining 8% lived in very small town centers where infrastructure and facilities were poorly constructed.
Figure 1. Location map of the study area (Source: Ethio-GIS (2017).
2.2. Research Approach
The research in this study incorporated a hybrid methodological approach (both qualitative and quantitative) that combined conventional survey tools such as household survey, focus group discussion, interview and personal observations with other additional secondary sources. The farming household heads are the main responsible body for making day-to-day decisions on land use and land management (soil and water conservation).
2.3. Data Types, Sources and Methods of Data Collection
In this study, the researcher examined the effect of Soil and water conservation (SWC) measures on households’ income and livelihoods by categorizing them in to adopters and non-adopters of SWC practices. Both qualitative and quantitative data from primary and secondary sources were used. The sources of primary data were household survey using a questionnaire, Focused Group Discussions (FGD), Key Informant Interviews (KIIs) using checklists, and personal observation. Moreover, the household questionnaire was pre-tested on 15 non-sample households from the sample kebeles (the smallest unit in the administrative structure of Ethiopia) and accordingly modified and refined before the actual household survey. To substantiate the validity of the quantitative data, focus group discussions (FGD) was held with 8 participants (elderly, youth, male, female, rich, poor) who were purposively selected and interview was made with 33 randomly selected Key informant interview (KII) consisting kebele leaders, model farmers, office experts, development agents (DA’s) and knowledgeable persons.
The discussion and interview were guided by checklist developed for this purpose. The results together with the household survey were the cornerstone in obtaining current information on the prevailing conditions in the surveyed area. In addition, secondary information was gathered from the district agriculture and rural development offices mainly from official documents and from regional governmental and non-governmental institutions working on protecting the environment. The information gathered from different secondary sources and other official documents available in different institutions were used to enhance the appropriateness and reliability of the primary data. Besides, the information at this level would help greatly in elaborating and checking the results of the survey and to correct some wrongly recorded figures.
2.4. Sampling Technique
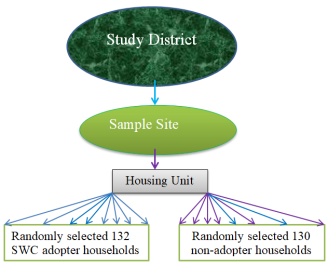
In this study, three-stage sampling techniques were used to select sample household heads for a survey. The primary goal of sampling technique was to get the representative small units from the much large population, such that the researcher can study the smaller group and produce accurate generalizations about the large population. In the first stage, out of the eight districts of Gedeo zone, Wenago district was purposively selected based on its soil erosion problems and active intervention of SWC activities and the information was obtained from Gedeo Zone agriculture and natural resources department report (2020). In the second stage, among the 17 Kebeles of the Wenago district, three kebeles, namely Tumata Chirecha, Kara Soditi and Dobota kebeles (18%) were selected purposively based on the their similar agricultural practice, high rate of soil erosion problem and active human SWC intervention. In the third stage (final stage), after securing fresh list of household heads from the three kebeles, households were again stratified in to SWC adopters and non-adopter groups. Then using probability proportional to size 132 SWC adopters and 130 non-adopters households were selected randomly from the three sample kebeles (
Figure 2).
Figure 2. Sampling techniques of housing unit and households (Source: Own constructed, 2024).
2.5. Sample Size Determination
For the purpose of this study, the following sample size determination formula provided by
| [1] | Ademe, Y., Kebede, T., Mullatu, A., & Shafi, T. (2017). Evaluation of the effectiveness of soil and water conservation practices on improving selected soil properties in Wonago district, Southern Ethiopia. Journal of Soil Science and Environmental Management, 8(3), 70-79. |
[1]
was used:
where ‘n’ is the required sample size
/1+4463(0.06)2 ‘N’ is the total target population (4463)
n = 4463/1+4463(0.0036) ‘e’ stands for error limit (0.06)
n = 4463/1+16.06
n = 4463/17.06
n = 262
Therefore, the survey of the study was administered on 262 households who were selected from the three sample kebeles and assuming at 94% confidence level and + 0.06 precision.
2.6. Data Analysis
Quantitative analysis in this study employed both descriptive statistics and econometric methods. Simple statistics like mean, frequency, percentage and chi-square (X2) were used. The collected data were presented using graphs, tables, and charts.
3. Results and Discussion
3.1. Main Crop Types, Sources of Livelihoods and Annual Crop Production of Sample Households
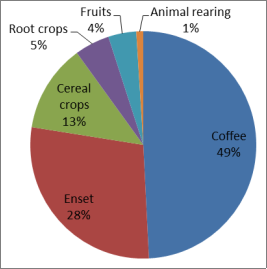
The primary crops which serve as a major source of food and income by adopters and non-adopter households in the study area were assessed. The statistical analysis result revealed that coffee (49%), Enset (28%), cereal crops (13%), root crops (5%), fruits (4%) and followed by livestock rearing (1%) are the main sources of food and income of the households in the study area (
Figure 3). The study area is agroforestry dominated agricultural system, as a result coffee is the main crop cultivated for commercial purposes whereas Enset is the staple food almost grown for food consumption in the study area. All these crops are grown during the long rainy season (April to June). The rest root crops such as potatoes, sugar beet and other spices and sugar cane are also grown on a small scale during the short rainy season (July to September). In the study area, perennial tree crops are widely grown particularly Coffee and Enset followed by other vegetables such as Boyna, Potato, Godere, and Cabbages in order to enhance a household's basic income. Perennial tree crops are also widely grown. According to the survey results, farmers of the study area particularly in Tumata Chericha and Dobota sample kebeles diversify their income sources by growing different food crops.
The analysis result of the chi-square [X2 = 6.99; P-value = 0.5
3] depicted that statistically there had no significant difference between the adopters and non-adopters in terms of main crop type production and income (
Table 2). This result was supported by
| [20] | Sisay, D. (2017). Effects of soil and water conservation practices on biophysical attributes, livestock feed resources availability and peoples livelihood condition of Debre Mewi watershed, North-west Ethiopia: M.sc unpublished thesis, Bahir Dar University. |
[20]
who stated that Coffee has been under production for a long time in the study area.
The study also quantified how much of the produced crop was consumed sold and carry-over (Kg) for risk time by both adopter and non-adopter sample household farmers in the harvest season of 2019/2020. Accordingly, 48.9% of the crop produced went to market sale. This study agreed with finding of
| [20] | Sisay, D. (2017). Effects of soil and water conservation practices on biophysical attributes, livestock feed resources availability and peoples livelihood condition of Debre Mewi watershed, North-west Ethiopia: M.sc unpublished thesis, Bahir Dar University. |
[20]
who reported that minority of cereal crops produced (47.5%) went to sale studied in Debre Mewi watershed, North-west Ethiopia. In this study, the share of home consumption accounts 42.5%. This result is contradicted with the finding of
| [13] | Gidey, A. (2015). The contribution of soil and water conservation practices towards sustainable rural livelihoods in Tigray region, northern Ethiopia (Doctoral dissertation, PhD Thesis, Addis Abeba University, Ethiopia). |
[13]
who reported that the majority of crop produced (70%) went to home consumption studied in Tigray region, northern Ethiopia. This figure is lower than what was reported by the National level-80%
| [9] | FAO. (2017). GIEWS country brief - Ethiopia, November 2017. |
[9]
. The carry-over (300 Kg) of adopters is three times greater than non-adopters (100 Kg). Farmers of the study communities sell large portion of coffee produced compared to other products and they might use the cash in turn to buy additional stable food, fertilizers, credit payment and to fulfill other social obligation.
To analyze the impact of improved SWC measures on crop yield production, the annual crop yield (Kg) of household adopters before adoption in the harvest season of 2023 and after adoption of improved structures in the harvest season of 2024 were compared. The result showed that household’s average crop production (Kg) before adoption of improved SWC measures in the harvest season of 2023 was about 1800 Kg while household’s crop production after the adoption of improved SWC structures in the harvest year of 2024 was 2400 Kg with enhancement of 600 Kg indicating that adoption of improved SWC measures increases crop yield by 11.5%. 75% of the interviewed key informants mentioned that the terraced farm plots are more productive than non-terraced plots. They also added that their susceptibility rises if they are not at least treated with drainage ditches when there is heavy rain fall. However, this does not mean that terraces alone are effective in controlling soil erosion; rather it is recommended that to employ terraces in combination with vegetative or agronomic measures. The households were also able to find wood, grass and medicinal plants around their home after they applied improved SWC practices, but before the adoption of SWC practices households were forced to move more than 5 km far away by foot in search of grass for their livestock feed, fire wood, construction materials and medicinal plants.
Key informants were asked to reflect on their opinion regarding the main types of agricultural activities and source of food in their local area. Accordingly, they replied that their main agricultural activities were mixed farming (crop production and livestock keeping). Of the 33 total key informants interviewed, 25 (75.75%) of them underlined that the primary yields (coffee and Enset) have considerably declined from year to year due to attack of pests and diseases, severe soil erosion, poor soil moisture and weak land management were their prioritized problems in their farm plot. The majority (72%) of the interviewed households reported that diversification activities are limited by poor access to credit services, fertilizer, late delivery and market access and shortage of capital. Similarly, of the 24 total Focus Group Discussion (FGD) participants, 20 (83%) of them explained that agroforestry is their main farming activity indicating that agroforestry system is the most dominant agricultural system meaning all types of crops are grown together within the same farmland in the study area. To sum up, it is important to consider that very few of the under-study farmers occasionally engaged in non-farm activities to generate additional income.
Figure 3. Major livelihood sources of the study communities by 2023/24 harvest years.
3.2. The Most Applied Physical Structures in the Study Area
In view of this, to encounter such soil erosion problems, the local sample communities in general and the sampled household farmers, in particular, have adopted the use of erosion control and water conservation methods. In this study, terracing technologies are some of the best mechanisms of soil and water conservation measures constructed on sloping farm lands aimed to reduce soil erosion, slope length, runoff water, retain soil moisture, enhance infiltration and crop productivity as compared to traditional SWC practices. Improved SWC structures such as stone terraces and soil bunds are scaled up through a concerted effort of extension workers, office experts and other relevant no-state actors. The dimension of each implemented structures have specified parameters (length, width, height, depth and spacing) which are guided by the agricultural agents (DAs) and other concerned experts (
Table 1). In this regard, the result presented in
Table 1, shows that sampled adopter household farmers have adopted improved stone terraces (46.21%), soil-bund (32.58%), and uses both (21.21%) conservation methods.
During the interview, 82% of the SWC adopters said that SWC measures implementation are very important in providing high crop yield, soil moisture and grass for animal fodder.
Stone Terraces: In the study area a number of stone terraces were implemented usually on individual farm lands
| [17] | Moges, D. M., and Taye, A. A. (2017). Determinants of farmers’ perception to invest in soil and water conservation technologies in the North-Western Highlands of Ethiopia. International Soil and Water Conservation Research, 5(1), 56-61. |
[17]
. Communities, families and individuals who made stone bunds usually on their farm fields. Stone terraces are effective measures to control soil loss and increase soil water retention capacity but are labor intensive and are not easily available. These physical structures are constructed on steep degraded areas with the objective to control run-off soil loss and increasing infiltration. The simple descriptive result showed that about 46.21% of the SWC adopter households applied and construct improved stone terraces in steep farm lands (
Table 1).
Soil Bunds: Soil bunds are constructed by throwing soil dug from basins downslope
| [5] | Bojago, E., Delango, M. W., & Milkias, D. (2023). Effects of soil and water conservation practices and landscape position on soil physicochemical properties in Anuwa watershed, Southern Ethiopia. Journal of Agriculture and Food Research, 14, 100705. |
[5]
. The soil bund structures in the study areas were installed at a vertical interval (VI) or height of terraces 0.5 meters depending on the slope of cultivated farmland and are mostly found in the middle and lower parts of the catchment where land is relatively flat and soil bunds are less permanent structures
| [21] | Teka, K., Haftu, M., Ostwald, M., and Cederberg, C. (2020). Can integrated watershed management reduce soil erosion and improve livelihoods? A study from northern Ethiopia. International Soil and Water Conservation Research, 8(3), 266-276. |
[21]
. The descriptive result in
Table 1, showed that 32.58% of the sample adopters applied and constructs soil bund in their farm land to control rapid soil erosion, and increase water infiltration. Hand shovels and hoes locally known as Akafa
and kotto respectively are the main tools used for the construction of both improved stone terraces and soil bunds in the study area. According to the office experts, DA’s, key informants and focus group discussion, these soil bund structures are commonly constructed during the dry season before the farmland is preparing for crop production.
Table 1. Classification of physical structures adopted by most household farmers in the study area.
Type of structural SWC measures | Adopters | Specified dimensions of improved SWC structures | Guiding by |
N | % |
Stone terraces | 61 | 46.21 | -length | -DA’s |
Soil bunds | 43 | 32.58 | -width | -office experts |
Both stone & soil bunds | 28 | 21.21 | -height | -non-state actors |
Total | 132 | 100 | -spacing | |
Source: Field survey result (2023/24).
3.3. Main Crop Types Produced and Annual Crop Production of Households
Table 3 presents the primary crops which serve as a major source of food and income by adopters and non-adopter households in the study areas. Based on the statistical result of this analysis, it is possible to generalize that coffee (49.2%), Enset (23.3%), cereal crops (9.5%) and followed by other crop are the main sources of food and income of the households in the study (
Table 2). As shown in
Table 3, the study area is agroforestry dominated agricultural system, as a result
coffea Arabica is the main crop cultivated for commercial purposes whereas Ensete ventrocosum is the staple food almost grown for food consumption. All these crops are grown during the long rainy season (April to November). The rest root crops such as potatoes, sugar beet and other spices and sugar cane are also grown on a small scale during the short rainy season (July to September).
The analysis result of the chi-square [X2 = 6.99; P-value = 0.53] depicted that statistically there had no significant difference between the adopters and non-adopters in terms of main crop type production (
Table 2). Key informants were asked to reflect on their opinion regarding the main types of agricultural activities and source of food in their local area. Accordingly, of the 33 key informants, 91% of them replied that their main agricultural activities were mixed farming (crop production and livestock keeping). Of the 33 total key informants interviewed, 25 (75.75%) of them underlined that the primary yields (coffea Arabica and Ensete venricosum) have considerably declined from year to year due to attack of pests and diseases, severe soil erosion, poor soil moisture and weak land management. The majority (72%) of the interviewed households reported that diversification activities are limited as a result of poor access to credit services and fertilizer, late delivery and market access. Similarly, of the 24 total FGD participants, 20 (83%) of them explained that agroforestry is their main farming activity indicating that agroforestry system is the most dominant agricultural system meaning all types of crops are grown together within the same farmland in the study area (
Figure 4). To sum up, it is important to consider that very few of the under-study farmers occasionally engaged in non-farm activities to generate additional income.
Table 2. Agricultural activities, major crop types and average crop production of sample HHHs by the harvest years of 2023/24.
Variable | Description | Adoption category of SWC measures | Total | df | X2 | P-value |
Non-adopters | adopters |
N | % | N | % | N | % |
What is your major crop types produced? | Coffea arabica | 62 | 47.7 | 67 | 50.7 | 129 | 49.2 | 8 | 6.99 | 0.53NS |
Ensete ventricosum | 30 | 23 | 31 | 23.5 | 61 | 23.3 |
Cereal crops | 13 | 10 | 12 | 9.1 | 25 | 9.5 |
Root crops | 2 | 1.5 | 4 | 3.0 | 6 | 2.3 |
fruits | 4 | 3.0 | 3 | 2.3 | 7 | 2.7 |
vegetation | 2 | 1.5 | 5 | 3.8 | 7 | 2.7 |
Animal husba. | 2 | 1.5 | 4 | 3.0 | 6 | 2.3 |
Off-farm acti. | 9 | 6.9 | 3 | 2.3 | 12 | 4.6 |
others | 6 | 4.6 | 3 | 2.3 | 9 | 3.4 |
Total | 130 | 100 | 132 | 100 | 262 | 100 |
Source: Field survey result (2023/24).
3.4. Benefit of Improved Physical Structures to the Sample Household Respondents
As indicated in
Table 3, 2.3%, 4.6%, 3.8%, and 89.2% of non-adopters claimed that soil and water conservation has been used for soil erosion reduction, crop yield increased, household income increased and no benefit respectively while 26.5%, 24.2%, 31.8%, and 17.4% of the adopters responded that soil and water conservation practices contributed in reducing soil erosion reduced, increased crop yield, household income, and no benefit respectively. As 89.2% of the non-adopters have no benefited from adoption of improved soil and water conservation structures, this indicated that non-adopters seem to have less awareness of the advantages of SWC practices than those of adopters. As shown in
Table 3, the chi-square test [X2 = 136] showed that statistically there is a significant difference between adopters and non-adopters in terms of the benefit of improved soil and water conservation measures at 5% probability.
This result was in line with the finding of
| [2] | Anley, Y., Bogale, A., and Haile‐Gabriel, A. (2007). Adoption decision and use intensity of soil and water conservation measures by smallholder subsistence farmers in Dedo district, Western Ethiopia. Land degradation and development, 18(3), 289-302. |
[2]
who reported that statistically there was a significant difference between adopters and non-adopters in terms of the benefit of improved SWC measures studied in Dedo district, Western Ethiopia. However, this result was contradicted with the finding of
| [8] | Ellis, F., Kutengule, M., and Nyasulu, A. (2003). Livelihoods and rural poverty reduction in Malawi. World Development, 31(9), 1495-1510. |
[8]
who reported that statistically there was no significant difference between the two groups in terms of the benefit of improved SWC measures studied in Malawi.
Table 3. Benefit of physical structures in terms of crop yield and income.
Benefit of SWC | Non-adopters | Adopters | Total | X2 |
N | % | N | % | N | % |
Soil erosion reduced | 3 | 2.3 | 35 | 26.5 | 38 | 14.5 | 136** |
Crop yield increased | 6 | 4.6 | 32 | 24.3 | 38 | 14.5 |
Household income increased | 5 | 3.8 | 42 | 31.8 | 47 | 17.9 |
No benefit | 116 | 89.2 | 23 | 17.4 | 139 | 53.1 |
Total | 130 | 100% | 132 | 100% | 162 | 100% |
Source: Field survey result (2023/24). Note: ** means significant at the 5% probability level.
3.5. The Impact of Adoption of Introduced (Improved) Physical Structures on Crop Yield Increment
To analyze the impact of improved physical structures on crop yield production, the annual crop yield (Kg) of household adopters before adoption in the harvest season of 2023 and after adoption of improved structures in the harvest season of 2024 were compared (
Table 4). The result showed that household’s average crop yield (Kg) before adoption of improved structures on own farm land in the harvest season of 2023 was about 1558 Kg while household’s crop yield after the adoption of improved SWC structures was 1965 Kg with enhancement of 406 Kg (
Table 4) indicating that adoption of improved physical structures increases crop yield by 11.5% which implies that adoption of improved physical soil and water conservation structures have brought a positive impact on yield increments and income of the household farmers (
Table 4).
Table 4. Impact of adoption of improved physical structures on crop production.
Crop types | Adopter household’s annual average crop production (Kg) before use of improved physical structures in 2023 | Adopter household’ average crop production (Kg) after use of improved physical structures in 2024 | Change (Kg) | Crop increment in % |
Coffea arabica | 800 | 1100 | +300 | 11.5% |
Ensete ventricosum | 400 | 455 | +55 |
Cereal crops | 180 | 180 | 0 |
Root crops | 99 | 120 | +21 |
Fruits | 79 | 110 | +31 |
Total | 1558 | 1965 | +406 |
Source: Field survey result (2023/24).
However, it is important to consider that the yield progress is the result of the past consecutive years soil and water conservation activities. The enhancement of crop productivity could be due to the fact that physical structures (stone terraces and soil bunds) reduce soil erosion, retain fertile loam soils, and increase soil moisture on the terraced area as well as proper land management systems. Of the 33 interviewed informants, 29 (87.8%) of the interviewed key informants mentioned that the terraced farm plots are more productive than non-terraced plots. They also added that their susceptibility rises if they are not at least treated with drainage ditches when there is heavy rain fall. However, this does not mean that terraces alone are effective in controlling soil erosion; rather it is recommended that to employ terraces in combination with vegetative or agronomic measures. The households were also able to find grass and medicinal plants around their home after they applied improved soil and water conservation practices (see
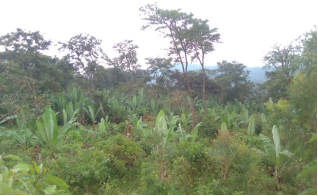
Figure 4), but before the adoption of SWC practices households were forced to move more than 5 km far away by foot in search of grass for their livestock feed and medicinal plants.
According to the information gathered from a total of 24 FGD participants, 20 (83.3%) of them reported that SWC adopter households have harvested an average of 1800 Kg. of crop per year in the harvest season of 2023/24 while non-adopter households who do not adopted improved physical structures gained an average of 1450 Kg. of crop yield in the same harvest year revealing that structure adopter households produce more yield by increment of 350 Kg and could be beneficiaries than non-adopters. The yield increment and difference might be due to application of introduced physical structures by adopter groups applied on their own farm land which enable them to have good moisture, soil fertility, source of income, cut and carry of grass for livestock feed. They also claimed that SWC activities and agricultural practices were almost carried out by male members of the family and females were limited due to their household activities in the study area.
This information is in line with the main survey data result. Implementation of stone terrace and soil bund practices in a traditional way, weak land management, misuse of natural resources, farmland scarcity, and inappropriate conservation methods causes’ substantial degradation of land in the study area. According to the office experts report, implementation of stone terrace and soil bund practices in a traditional way, weak land management, misuse of natural resources, farmland scarcity, and inappropriate conservation methods causes substantial degradation of land in the study area.
Figure 4. Partial view of the agroforestry system in the study area.
3.6. Why Non-adopter Household Farmers Do Not Adopt Introduced Physical Structures
As one can understand from
Tables 2 and 3, the total number of sample household respondents was 262 of which 130 samples households were non-adopters (non-users of introduced physical structures) (
Table 5). As shown in
Table 5, 60.8% and 20% of non-adopters claimed that adoption of improved physical soil and water conservation structures on private farm land cause to less farm plot and the terraced area harbor rodents and other dangerous wild animals respectively. As 100% of the non-adopters have no benefited from adoption of improved soil and water conservation structures, this indicated that non-adopter household farmers seem to have less awareness of the advantages of introduced physical structures than those of adopters.
Table 5. Why some household farmers do not adopt improved physical structures on own farm plot?
As you are non-adopter, |
Variables | Adoption category of SWC measures |
n = non-adopters | % |
As you are non-adopter, why you do not adopt improved physical structures on your own farm land? | Improved SWC measure is boring | 6 | 4.6% |
Inadequate household labor | 9 | 6.9% |
Information gap with experts | 4 | 3.1% |
Lack of Knowledge | 5 | 3.8% |
The terraces cause to less farm plot | 79 | 60.8% |
The terraced area harbor rodents and other dangerous wild animals | 26 | 20% |
Shortage of time to work on SWC measures | 1 | 0.8% |
Total | 130 | 100% |
Source: Field survey result (2023/24).
Household survey was also made on non-adopters to assess why they do not adopt improved SWC structures on their own farm land. As indicated in
Table 5, the result of the simple descriptive shows that the majority 79% and 26% of them mentioned that improved structures occupy part of the farm plot which could be used for production purpose and harbor rodents respectively. This implies that non-adopter groups lack awareness about the advantages of improved SWC measures (
Table 5).