Crop growth models like AquaCrop maximize crop output and water use efficiency by forecasting agricultural indicators including crop yield, dry biomass, and water productivity. This study not only validated and calibrated the AquaCrop model, but also investigated the effects of deficit irrigation on wheat yield and water productivity. The experiment was conducted for calibration in 2022-2023 and for validation in 2023-2024. Five irrigation treatments were utilized in this study: 100% ETc, 80% ETc, 80% ETc at development and mid-stage, 60% ETc, and 60% ETc at development and mid-stage. The test variety was the Kingbird local wheat variety. Applying 100% ETc produced the maximum plant height, biomass, yield, and thousand seed weight (66.97cm, 36.43g, 3.47t ha-1, 9.53t ha-1), while 60% ETc produced the lowest values (63.1cm, 30.4g, 1.94t ha-1, and 7.74t ha-1). The best water productivity of 0.92kg m-3 was seen throughout the development and mid-stages when 80% ETc was applied. The AquaCrop model's root mean square error ranged from 0.002 to 0.25 t ha-1, its model efficiency ranged from 0.81 to 0.95, and its coefficient of determination for grain yield, dry biomass, and water productivity ranged from 0.84 to 0.98. Model efficiency was 0.83, 0.85, and 0.77, yield, biomass, and water productivity had coefficients of determination of 0.96, 0.93, and 0.73, and the AquaCrop model's root mean square error was 0.244, 0.413t ha-1, and 0.03kg m-3, respectively. When 60% ETc was used, the largest prediction error of 17.36 was observed under yield, while when 100% crop water requirement was applied, the lowest prediction error of 0.26 was obtained under biomass. Therefore, it can be concluded that the AquaCrop model can reliably forecast crop metrics that are impacted by different watering schedules.
| Published in | International Journal of Engineering Management (Volume 9, Issue 2) |
| DOI | 10.11648/j.ijem.20250902.13 |
| Page(s) | 66-74 |
| Creative Commons |
This is an Open Access article, distributed under the terms of the Creative Commons Attribution 4.0 International License (http://creativecommons.org/licenses/by/4.0/), which permits unrestricted use, distribution and reproduction in any medium or format, provided the original work is properly cited. |
| Copyright |
Copyright © The Author(s), 2025. Published by Science Publishing Group |
AquaCrop Model, Calibration, Validation, Wheat, Yield
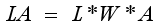 (1)
(1) 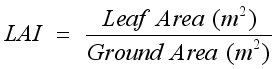 (2)
(2) 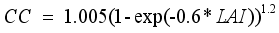 (3)
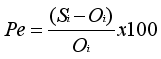
(3)  (4)
(4)  (5)
(5)  (6)
(6)  (7)
(7)  (8)
(8) Soil parameters | Soil depth (cm) | Mean | |
|---|---|---|---|
0-20 | 20-40 | ||
Sand (%) | 36 | 30 | 33 |
Silt (%) | 18 | 20 | 19 |
Clay (%) | 46 | 50 | 48 |
Textural class | Clay | Clay | Clay |
Bulk density (g/cm3) | 1.37 | 1.47 | 1.42 |
PH-water (1: 2.5) | 7.14 | 6.88 | 7.01 |
EC (ds/m) | 0.353 | 0.296 | 0.325 |
OC (%) | 1.06 | 1.14 | 1.1 |
OM (%) | 1.83 | 1.96 | 1.895 |
TN (%) | 0.09 | 0.1 | 0.095 |
FC (%) | 40 | 42 | 41 |
PWP (%) | 27.9 | 29.9 | 28.9 |
Hydraulic conductivity (mm/hr) | 0.94 | 0.78 | 0.86 |
Saturation (%) | 47.3 | 48.8 | 48.05 |
Treatments | PH (cm) | TSW (g) | Yield (t ha-1) | BY (t ha-1) | WP (kg m-3) |
|---|---|---|---|---|---|
100% ETc | 66.97a | 36.43a | 3.47a | 9.53a | 0.86b |
80% ETc | 65.9ab | 33.43b | 2.73b | 8.63b | 0.85bc |
80% ETc DM | 66.47ab | 35.15a | 3.32a | 9.17a | 0.92a |
60% ETc | 63.10c | 30.40c | 1.94c | 7.74c | 0.80c |
60% ETc DM | 65.40b | 33.32b | 2.59b | 8.26b | 0.82bc |
LSD (0.05) | 1.2122 | 1.361 | 0.16 | 0.44 | 0.05 |
CV (%) | 0.98 | 2.14 | 3.08 | 2.72 | 3.44 |
Description | Calibrated Values |
|---|---|
Canopy Growth Coefficient (CGC) (%/day) | 9.4 |
Canopy Decline Coefficient (CDC) (%/day) | 10.3 |
Maximum canopy cover (%) | 66 |
Reference Harvest Index (HIO) (%) | 31 |
Treatment | Yield | WP | Biomass | ||||||
|---|---|---|---|---|---|---|---|---|---|
Obs | Sim | PE (%) | Obs | Sim | PE (%) | Obs | Sim | PE (%) | |
100% ETc | 3.36 | 3.05 | 9.23 | 0.83 | 0.88 | 5.63 | 9.54 | 9.44 | 1.01 |
80% ETc | 2.60 | 2.59 | 0.20 | 0.81 | 0.82 | 1.63 | 8.61 | 8.71 | 1.22 |
80% ETc DM | 3.21 | 2.86 | 11.03 | 0.89 | 0.90 | 0.64 | 9.31 | 8.94 | 3.92 |
60% ETc | 1.91 | 2.21 | 15.66 | 0.79 | 0.79 | 0.08 | 7.79 | 7.46 | 4.25 |
60% ETc DM | 2.54 | 2.53 | 0.18 | 0.80 | 0.82 | 1.93 | 8.23 | 8.19 | 0.53 |
Model output parameters | Observed | Simulated | RMSE | ME | R2 |
|---|---|---|---|---|---|
Grain yield (t ha-1) | 2.73 | 2.53 | 0.25 | 0.81 | 0.98 |
Dry biomass (t ha-1) | 8.69 | 8.27 | 0.23 | 0.94 | 0.93 |
WP (kg m-3) | 0.83 | 0.82 | 0.02 | 0.95 | 0.84 |
Treatment | Yield | WP | Biomass | ||||||
|---|---|---|---|---|---|---|---|---|---|
Obs | Sim | PE (%) | Obs | Sim | PE (%) | Obs | Sim | PE (%) | |
100% ETc | 3.58 | 3.21 | 10.20 | 0.89 | 0.95 | 7.12 | 9.51 | 9.49 | 0.26 |
80% ETc | 2.85 | 2.70 | 5.30 | 0.88 | 0.86 | 2.75 | 8.66 | 8.91 | 2.84 |
80% ETc DM | 3.42 | 3.26 | 4.68 | 0.95 | 0.96 | 0.87 | 9.02 | 9.16 | 1.51 |
60% ETc | 1.97 | 2.38 | 17.36 | 0.81 | 0.83 | 2.13 | 7.45 | 6.58 | 11.74 |
60% ETc DM | 2.63 | 2.62 | 0.53 | 0.83 | 0.85 | 1.91 | 8.29 | 8.37 | 0.89 |
Model output parameters | Obs | Sim | RMSE | ME | R2 |
|---|---|---|---|---|---|
Grain yield (t ha-1) | 2.89 | 2.82 | 0.24 | 0.83 | 0.96 |
Dry biomass (t ha-1) | 8.59 | 8.50 | 0.41 | 0.85 | 0.93 |
WP (kg m-3) | 0.87 | 0.89 | 0.03 | 0.77 | 0.73 |
| [1] | Abedinpour, M., Sarangi, A., Rajput, T. B. S., Singh, M., Pathak, H., & Ahmad, T. (2012). Performance evaluation of AquaCrop model for maize crop in a semi-arid environment. Agricultural Water Management, 110, 55-66. |
| [2] | Allen, R. G., Pereira, L. S., Raes, D., Smith, M., & Ab, W. (1998). Crop evapotranspiration - Guidelines for computing crop water requirements - FAO Irrigation and drainage paper 56 By. 1-15. |
| [3] | Andarzian, B., Bannayan, M., Steduto, P., Mazraeh, H., Barati, M. E., Barati, M. A., & Rahnama, A. (2011). Validation and testing of the AquaCrop model under full and deficit irrigated wheat production in Iran. Agricultural Water Management, 100(1), 1-8. |
| [4] | Araya, A., Habtu, S., Hadgu, K. M., Kebede, A., & Dejene, T. (2010). Test of AquaCrop model in simulating biomass and yield of water deficient and irrigated barley (Hordeum vulgare). Agricultural Water Management, 97(11), 1838-1846. |
| [5] | Asmamaw, D. K., Janssens, P., Dessie, M., Tilahun, S. A., Adgo, E., Nyssen, J., Walraevens, K., Assaye, H., Yenehun, A., Nigate, F., & Cornelis, W. M. (2023). Effect of deficit irrigation and soil fertility management on wheat production and water productivity in the Upper Blue Nile Basin, Ethiopia. Agricultural Water Management, 277, 108077. |
| [6] | Atakltie A., P. S. (2023). Effect of Deficit Irrigation on Yield and Water Productivity of Irrigated Wheat (Triticum aestivum L.) in the Upper Nile River. Irrigated Drainage Sys Eng, 12(5), 1-8. |
| [7] | Darko, R. O., Yuan, S. Q., Yan, H. F., Liu, J. P., & Abbey, A. (2016). Calibration and validation of aquacrop for deficit and full irrigation of tomato. International Journal of Agricultural and Biological Engineering, 9(3), 104-110. |
| [8] | Farahani, H. J., Izzi, G., & Oweis, T. Y. (2009). Parameterization and evaluation of the aquacrop model for full and deficit irrigated cotton. Agronomy Journal, 101(3), 469-476. |
| [9] | Jemal, M. H., Fikadu, R. B., Kebede, N. T., Wondimu, T. A., Nigusie, A. S., & Tesema, M. T. (2022). Effects of irrigation levels and nitrogen fertilizer rate on grain yield of wheat (Triticum aestivum) at Amibara, Middle Awash, Ethiopia. Journal of Soil Science and Environmental Management, 13(1), 11-16. |
| [10] | Kale Celik, S., Madenoglu, S., & Sonmez, B. (2018). Evaluating aquacrop model for winter wheat under various irrigation conditions in Turkey. Tarim Bilimleri Dergisi, 24(2), 205-217. |
| [11] | Kasundra, T. H., & Tiwari, M. K. (2022). Calibration and Validation of Aquacrop Model for Maize Crop (Zea Mays) Under Semi-Arid Environment of Gujarat. 07, 1637-1647. |
| [12] | Keating, B. A., & Wafula, B. M. (1992). Modelling the fully expanded area of maize leaves. Field Crops Research, 29(2), 163-176. |
| [13] | Kuşçu, H., Turhan, A., & Demir, A. O. (2014). The response of processing tomato to deficit irrigation at various phenological stages in a sub-humid environment. Agricultural Water Management, 133, 92-103. |
| [14] | Lindi, S., Iticha, B., Hone, M., Tadese, K., & Admasu, W. (2019). Determination of Optimal Irrigation Scheduling and Water Productivity for Wheat (Triticum aestevum L.) at. Academic Research Journal of Agricultural Science and Research, 7(July), 289-296. |
| [15] | Meena, R. P., Karnam, V., Tripathi, S. C., Jha, A., Sharma, R. K., & Singh, G. P. (2019). Irrigation management strategies in wheat for efficient water use in the regions of depleting water resources. Agricultural Water Management, 214, 38-46. |
| [16] | Memon, S. A., Sheikh, I. A., Talpur, M. A., & Mangrio, M. A. (2021). Impact of deficit irrigation strategies on winter wheat in semi-arid climate of sindh. Agricultural Water Management, 243, 106389. |
| [17] | Salman, S. A., Shahid, S., Afan, H. A., Shiru, M. S., Al-ansari, N., & Yaseen, Z. M. (n. d.). Changes in Climatic Water Availability and Crop Water Demand for Iraq Region. 14-27. |
| [18] | Smith, R., Aguiar, J. L., Baameur, A., Cahn, M., Cantwell, M., de la Fuente, M., Hartz, T., Koike, S., Molinar, R., Natwick, E., Suslow, T., & Takele, E. (2011). Chile Pepper Production in California. Chile Pepper Production in California. |
| [19] | Steduto, P., Hsiao, T. C., Raes, D., & Fereres, E. (2009). Aquacrop-the FAO crop model to simulate yield response to water: I. concepts and underlying principles. Agronomy Journal, 101(3), 426-437. |
| [20] | Tadesse, T., Haque, I., & Aduayi, E. A. (1991). Soil, plant, water, fertilizer, animal manure and compost analysis manual. |
| [21] | Tari, A. F. (2016). The effects of different deficit irrigation strategies on yield, quality, and water-use efficiencies of wheat under semi-arid conditions. Agricultural Water Management, 167, 1-10. |
| [22] | Ummah, M. S. (2019). A Manual for Extension Agents and Seed Producers By. Sustainability (Switzerland), 11(1), 1-14. |
| [23] | Xue, Q., Rudd, J. C., Liu, S., Jessup, K. E., Devkota, R. N., & Mahan, J. (2014). Yield determination and water-use efficiency of wheat under water-limited conditions in the U. S. Southern High Plains. Crop Science, 54(1), 34-47. |
APA Style
Bedane, H., Genemu, G. (2025). Optimization of Wheat (Triticum aestevum L.) Water Productivity Under Deficit Furrow Irrigation Using AquaCrop Model. International Journal of Engineering Management, 9(2), 66-74. https://doi.org/10.11648/j.ijem.20250902.13
ACS Style
Bedane, H.; Genemu, G. Optimization of Wheat (Triticum aestevum L.) Water Productivity Under Deficit Furrow Irrigation Using AquaCrop Model. Int. J. Eng. Manag. 2025, 9(2), 66-74. doi: 10.11648/j.ijem.20250902.13
@article{10.11648/j.ijem.20250902.13,
  author = {Habtamu Bedane and Gudeta Genemu},
  title = {Optimization of Wheat (Triticum aestevum L.) Water Productivity Under Deficit Furrow Irrigation Using AquaCrop Model
},
  journal = {International Journal of Engineering Management},
  volume = {9},
  number = {2},
  pages = {66-74},
  doi = {10.11648/j.ijem.20250902.13},
  url = {https://doi.org/10.11648/j.ijem.20250902.13},
  eprint = {https://article.sciencepublishinggroup.com/pdf/10.11648.j.ijem.20250902.13},
  abstract = {Crop growth models like AquaCrop maximize crop output and water use efficiency by forecasting agricultural indicators including crop yield, dry biomass, and water productivity. This study not only validated and calibrated the AquaCrop model, but also investigated the effects of deficit irrigation on wheat yield and water productivity. The experiment was conducted for calibration in 2022-2023 and for validation in 2023-2024. Five irrigation treatments were utilized in this study: 100% ETc, 80% ETc, 80% ETc at development and mid-stage, 60% ETc, and 60% ETc at development and mid-stage. The test variety was the Kingbird local wheat variety. Applying 100% ETc produced the maximum plant height, biomass, yield, and thousand seed weight (66.97cm, 36.43g, 3.47t ha-1, 9.53t ha-1), while 60% ETc produced the lowest values (63.1cm, 30.4g, 1.94t ha-1, and 7.74t ha-1). The best water productivity of 0.92kg m-3 was seen throughout the development and mid-stages when 80% ETc was applied. The AquaCrop model's root mean square error ranged from 0.002 to 0.25 t ha-1, its model efficiency ranged from 0.81 to 0.95, and its coefficient of determination for grain yield, dry biomass, and water productivity ranged from 0.84 to 0.98. Model efficiency was 0.83, 0.85, and 0.77, yield, biomass, and water productivity had coefficients of determination of 0.96, 0.93, and 0.73, and the AquaCrop model's root mean square error was 0.244, 0.413t ha-1, and 0.03kg m-3, respectively. When 60% ETc was used, the largest prediction error of 17.36 was observed under yield, while when 100% crop water requirement was applied, the lowest prediction error of 0.26 was obtained under biomass. Therefore, it can be concluded that the AquaCrop model can reliably forecast crop metrics that are impacted by different watering schedules.
},
 year = {2025}
}
TY  - JOUR
T1  - Optimization of Wheat (Triticum aestevum L.) Water Productivity Under Deficit Furrow Irrigation Using AquaCrop Model

AU  - Habtamu Bedane
AU  - Gudeta Genemu
Y1  - 2025/09/25
PY  - 2025
N1  - https://doi.org/10.11648/j.ijem.20250902.13
DO  - 10.11648/j.ijem.20250902.13
T2  - International Journal of Engineering Management
JF  - International Journal of Engineering Management
JO  - International Journal of Engineering Management
SP  - 66
EP  - 74
PB  - Science Publishing Group
SN  - 2640-1568
UR  - https://doi.org/10.11648/j.ijem.20250902.13
AB  - Crop growth models like AquaCrop maximize crop output and water use efficiency by forecasting agricultural indicators including crop yield, dry biomass, and water productivity. This study not only validated and calibrated the AquaCrop model, but also investigated the effects of deficit irrigation on wheat yield and water productivity. The experiment was conducted for calibration in 2022-2023 and for validation in 2023-2024. Five irrigation treatments were utilized in this study: 100% ETc, 80% ETc, 80% ETc at development and mid-stage, 60% ETc, and 60% ETc at development and mid-stage. The test variety was the Kingbird local wheat variety. Applying 100% ETc produced the maximum plant height, biomass, yield, and thousand seed weight (66.97cm, 36.43g, 3.47t ha-1, 9.53t ha-1), while 60% ETc produced the lowest values (63.1cm, 30.4g, 1.94t ha-1, and 7.74t ha-1). The best water productivity of 0.92kg m-3 was seen throughout the development and mid-stages when 80% ETc was applied. The AquaCrop model's root mean square error ranged from 0.002 to 0.25 t ha-1, its model efficiency ranged from 0.81 to 0.95, and its coefficient of determination for grain yield, dry biomass, and water productivity ranged from 0.84 to 0.98. Model efficiency was 0.83, 0.85, and 0.77, yield, biomass, and water productivity had coefficients of determination of 0.96, 0.93, and 0.73, and the AquaCrop model's root mean square error was 0.244, 0.413t ha-1, and 0.03kg m-3, respectively. When 60% ETc was used, the largest prediction error of 17.36 was observed under yield, while when 100% crop water requirement was applied, the lowest prediction error of 0.26 was obtained under biomass. Therefore, it can be concluded that the AquaCrop model can reliably forecast crop metrics that are impacted by different watering schedules.

VL  - 9
IS  - 2
ER  -
Oromia Agricultural Research Institute, Bako Agricultural Engineering Research Center, Bako, Ethiopia
Information

