Research Article | | Peer-Reviewed

Mapping Soil Erosion Hotspot Areas in the Bwabwata Watershed North Central Highlands of Ethiopia

Received: 6 May 2025     Accepted: 27 May 2025     Published: 4 July 2025
Views:       Downloads:
Abstract

Soil erosion produces major environmental problems in Ethiopian highlands while continuing to affect the Bwabwata watershed as an ecological issue. Effective control of soil erosion in watersheds necessitates the identification of erosion hotspots. The identification of such hotspots has been missing from past research investigations within this area. A GIS-based RUSLE model implementation helps estimate soil loss and determine the order of priority for sub-watersheds in terms of soil and water conservation planning. Mean annual precipitation, together with digital soil data and digital elevation models combined with slope steepness measurements, allowed the computation of RUSLE output values. The RUSLE model incorporated into a GIS platform evaluated soil erosion effects resulting from land use and land cover changes in three specific periods. The quantitative evaluation shows both cropland and settlement areas extended from 2004 to 2024, but forest and shrubland decreased because of their conversion to different land uses. The watershed experienced a significant elevation of mean annual soil erosion rate from 28.63 t/ha/yr in 2004 to 32.99 t/ha/yr in 2014, with a subsequent minor erosion reduction to 30.93 t/ha/yr in 2024. Currently, the total soil loss in the study area amounts to 117,545.25 tons from 3,800 hectares. The soil loss tolerance threshold exceeds in 42% of the study area, which spreads across 1,595.76 hectares, resulting in high erosion risk areas. A successful approach to safeguarding watershed resources requires specific allocation of SWC efforts toward high-risk sub-watersheds, along with planned LULC management.

Published in International Journal of Environmental Monitoring and Analysis (Volume 13, Issue 4)
DOI 10.11648/j.ijema.20251304.11
Page(s) 114-129
Creative Commons

This is an Open Access article, distributed under the terms of the Creative Commons Attribution 4.0 International License (http://creativecommons.org/licenses/by/4.0/), which permits unrestricted use, distribution and reproduction in any medium or format, provided the original work is properly cited.

Copyright

Copyright © The Author(s), 2025. Published by Science Publishing Group

Keywords

GIS, LULCC, Remote Sensing, RUSLE Model, Soil Erosion, Watershed

1. Introduction
Soil erosion is a critical environmental and agricultural matter throughout all regions of Africa . Ethiopia is undergoing one of the worst cases of land erosion because its steep topography combines with deforestation and heavy agricultural methods to impact more than 75% of the country. According to RUSLE model calculations the national average soil erosion typically reaches 38 t ha-1 yr-1 in Ethiopia while specific regions experience ratios exceeding 220 t ha-1 yr-1 based on their slope characteristics and land management techniques . Soil degradation affects the East African highlands especially strongly because these regions depend heavily on natural resources for rural survival . Three factors a rapidly growing number of people and unpredictable precipitation patterns and fast-paced land management changes combine to worsen soil destruction in this area . Soil loss experienced a significant increase between 1985 and 2019 in the Suha watershed of northwestern Ethiopia because of agricultural expansion together with land cover change . Soil erosion together with unsustainable managed lands have resulted in substantial agricultural output losses throughout the last three decades in Ethiopia . Soil and water conservation strategies introduced to prevent erosion show variable success rates according to evidence presented in . The highlands of Ethiopia produce huge annual sediment discharge through trans-boundary rivers which creates operational difficulties for both Ethiopian territory and its neighboring nations . The ongoing development and conservation practices in the Ethiopian highlands require sustainable land practices to address the influences of topography and population growth together with climate variations .
Soil erosion continues as an ongoing environmental challenge for Ethiopia since the integration of geographically precise data remains insufficient and assessments of local-scale degradation centers within micro-watersheds are insufficient . A lack of mapping exists for specific hotspots throughout the Bwabwata Watershed because this area remains remote with sparse available data. The Beshilo sub-basin holds a reputation as the most vulnerable area in terms of soil erosion in the Blue Nile basin yet it does not employ modern geospatial modeling technology to address erosion rate problems specifically .
The combination of Remote sensing paired with GIS technologies serves as a critical solution to solve this data scarcity issue . The ability of these techniques to merge environmental data from multiple sources while producing continuous spatial outputs proves vital when dealing with regions having limited resources or accessibility . The tools enable estimation of essential erosion model parameters including land cover together with slope and rainfall erosivity and soil erodibility at appropriate scales according to . The use of Landsat together with Sentinel-2 and MODIS sensors has improved land use/land cover (LULC) monitoring through better temporal and spatial data resolution to determine human-caused changes leading to erosion .
Geospatial techniques demonstrate their worth through multiple research projects which use them to detect soil erosion areas alongside selection of priority intervention locations. The Upper Blue Nile received successful erosion mapping through the combination of RUSLE modeling and remote sensing data implementation by . Mekonnen et al . proved that soil conservation planning requires a detailed understanding of combining both LULC changes and topographic factors for hotspot identification purposes.
Existing research about erosion dynamics has advanced our understanding across large regions and nations, but it lacks concrete insights at watershed levels, specifically in the understudied high-risk area, which is Bwabwata. The Bwabwata sub-basin requires site-specific soil erosion hotspot mapping analyses that integrate GIS and remote sensing at high-resolution levels. The application of insufficient localized understanding makes land management techniques lose their effectiveness.
The current research aims to achieve these objectives.
1. To apply the RUSLE model for soil erosion Identification for the past three decades
2. To identify soil erosion hotspot areas within the watershed that requires immediate attention and intervention.
2. Materials and Methods
2.1. Description of the Study Area
The Bwabwata watershed consists of land which extends from heights between 2837 m to 3855 m above sea level within the Abay Basin Beshilo sub-basin (Figure 1). Higher rainfall occurs between June and September generating its highest point of precipitation in August (297.3 mm) leading to December temperatures of 15.4°C while June temperatures reach 20.1°C. 48.8 percent of the Bwabwata watershed slopes at levels between 0-7% while 55.2 percent slopes at 8-16% which together lead to soil erosion patterns.
The local soil landscape comprises mainly of Eutric Leptosols (15.81%) together with Lithic Leptosols (84.18%) which tend to being shallow and vulnerable to erosion on steep slopes. Most of the terrain in this area falls under cropland (56.68%) grassland (14.54%) forest (21.23%) and includes small sections of shrubland bare land and settlements. The patterns of drainage in the area become concentrated along streams that flow from elevated regions thus causing elevated erosion rates in those areas. Barley serves as the primary agricultural crop of this zone where traditional terracing of steep slopes tries to control regular soil loss. The main economic activities revolve around agricultural production since the region functions as an agricultural economy. The local crops consist of wheat and barley while beans and peas are also grown but farming practices restrict themselves to annual operations because of diminishing agricultural outputs. Agro-economy comprises 94% of the entire economic sector as trade and government jobs take up the remaining 6%.
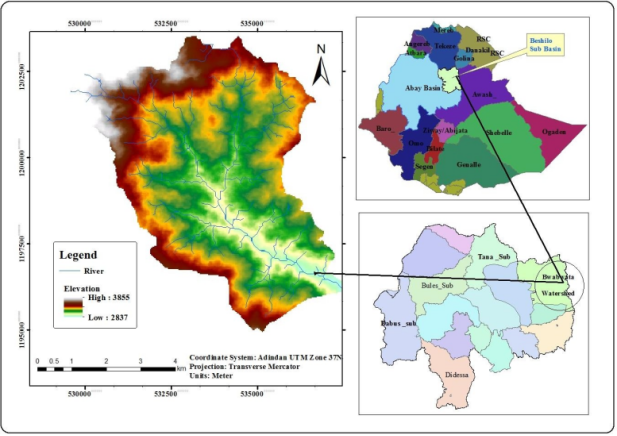
Figure 1. Location map of the study area (extracted from CSA 2007; GADM 2018).
2.2. Data Types and Sources
Field surveys in addition to satellite images obtained from various organizations and United States Geological Survey and Landsat (http://landsat.usgs.gov) online resources provided the data for this research. This study obtained its primary data through a Global Positioning System (GPS) while (Table 1) explains all data sources with their formats. The purpose of analysis included hotspot identification through the use of ArcGIS 10.5 with Spatial Analyst extension for overlaying thematic data while integrating geo-referencing and proximity assessment functionality. The program ERDAS Imagine 2015 served for performing land use/cover classification tasks. The data analyses were performed with Microsoft Excel while the report generation relied on a reference management system. The fieldwork required the use of GPS receiver and digital camera and compass to gather data.
Table 1. Data Source and data Type.

Data type

Data source

Purpose

Resolution

Software used

Land sat Imageries

USGS

Extract LULC

30 meter

ERDAS 2015 ArcGIs10.5

DEM (ASTER Digital Elevation Model)

USGS

Extract Slope, LS & drainage etc.

30 meter

ArcGIs10.5

Shape file

DIVA-GIS

Extract study area

ArcGIs10.5

Soil data

MOWIE

Extract soil map

1:250,000

ArcGIs10.5

GPS data

Field survey

Identify soil color, LULC,

ArcGIs10.5

Rain fall data

-NMSA

Extract rain fall map

30 meter

ArcGIs10.5

2.3. Soil Erosion Hazard Analysis Using Revised Universal Soil Loss Equation (RUSLE) Model
The RUSLE stands as an empirical predictive model developed from USLE for estimating prolonged yearly average soil erosion rates through stronger calculation capabilities . The predictive model involves five primary components which include rainfall erosivity (R), soil erodibility (K), slope length and steepness (LS), cover management (C) as well as support practices (P).
The equation of RUSLE model is as follows;
A= R*K*LS*C*P(1)
A-average annual soil loss (t/h-1/year-1)
R- rainfall-runoff erosivity factor (J mm ha–1 h–1 year–1)
K- Soil erodibility factor T hah ha–1 J–1 mm–1)
LS- Slope length and steepness factor (dimensionless)
C cover management factor (dimensionless)
P- Support practice factor (dimensionless)
Extensive watershed areas gain efficient and accurate identification of soil erosion hotspots through the GIS-enabled integration of RUSLE system . Ethiopian adaptations of RUSLE incorporate native rainfall patterns along with local management practices to boost its adaptability for the local region .
2.3.1. RUSLE Model Calibration
RUSLE as originally developed for U.S. purposes requires regional calibration when researchers implement it in new areas . The Maybar Observatory in Ethiopia's Soil Conservation Research Programme (SCRP) provided non-spatial data for calibration purposes since the observatory presents prolonged erosion data relevant to central Ethiopian highlands . Soil loss observations under different land uses allowed the calibration of RUSLE input components R and P and C to create dependable results in the study region.
2.3.2. Rainfall Erosivity Factor (R)
RUSLE models utilize R-factor to calculate rainfall erosivity through the evaluation of rainfall intensity in combination with duration for determining soil erosion amounts . The scarce rainfall data in Ethiopian highlands led to create an empirical equation which estimated the R-factor through mean annual precipitation measurements.
R = -8.12 + 0.562 × P
The equation relates rainfall erosivity factor (MJ·mm·ha-1·h-1·yr-1) to mean annual precipitation (mm) through the variable R. The authors collected data from nine stations which included Akesta, Dessie, Gugufto, Kabe, Lugama, Mekane Selam, Tebaset, Segno Gebeya, and Wereilu for three time periods: 1994–2004, 2004–2014, and 2014–2024. The researchers used ArcGIS IDW interpolation to create a 30 m × 30 m resolution erosivity map layer by processing the data.
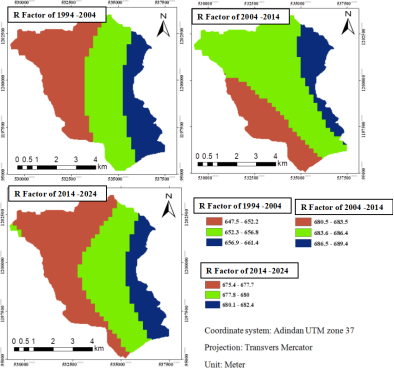
Figure 2. R factor Map of the study area in three study periods.
2.3.3. Soil Erodibility Factor (K)
Soil erosion susceptibility depends on the properties of texture structure organic matter and permeability which are quantified through the K-factor analysis . According to Hurni , Ethiopian soil color corresponds to precipitation values that range from 0.15 for black soil to 0.35 for light gray soil. Table 2 shows that soil color at nineteen points identified by GPS received classification using Munsell soil charts while the K-factor map was produced through kriging interpolation methods.
Table 2. Distribution of Soil color, sample points and erodability values.

Major Soil type

Soil color by (GPS)

No Sample point by GPS

Erodibility (K) factor in ton·ha·hr·ha−1·MJ−1·mm−1

Black

5

0.15

Eutric Leptosols & Lithic Leptosols

Brown

5

0.20

Red

5

0.25

Gray

4

0.35

Total

19

-

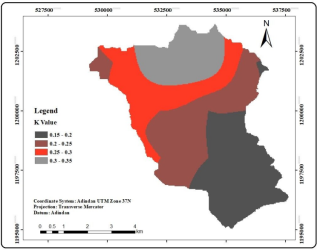
Figure 3. Erodibility map (K-factor) of the study area.
2.3.4. Slope Length and Slope Steepness Factor (LS)
The erosion-related assessment factor LS unites slope measurements (L) with slope gradients (S) to determine topographic effects on soil erosion . Field measurements for topographic assessments are difficult to execute so digital elevation models (DEMs) provide an efficient and more extensive method. This research employed the 30 m resolution ASTER DEM for calculating slope and flow accumulation. The LS-factor measurement requires the following mathematical equation.
LS = ((flow accumulation * cell size/22.1)m* (0.065 + 0.045S + 0.0065S2))
The LS value equals ((Flow Accumulation * Cell Size)/22.1)^0.5*S + 0.065 when Cell Size equals 30 m and S represents slope value in percent and m is set to 0.5 while S exceeds 5% . The research used ArcGIS 10.5 for processing of DEM data through sink filling operations as well as direction and accumulation calculations which produced an LS-factor map shows in figure 4.
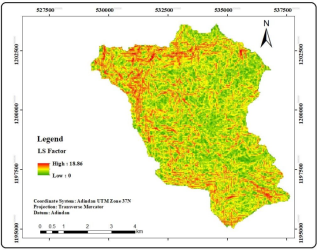
Figure 4. LS Factor map.
2.3.5. Covering Management Factor (C)
Land cover contributes to soil erosion through the C-factor which reaches its highest risk value for bare land (C = 1) while vegetative cover minimizes C-values . Deforestation alongside agricultural expansion creates higher C-values which increases erosion risks in the affected areas . Table 3 indicates the classification of Landsat images (2004, 2014, 2024) as LULC types occurred through field-based data application. RUSLE literature adapted to Ethiopian conditions served to determine C-values for soil erosion calculation which Maybar Observatory measurements validated to generate C-factor maps for each research period.
Table 3. Land use land cover class and C-factor value of the year.

Land use/cover

C value

Reference

Cropland

0.15

Hurni (1985), Asmamaw & Mohammed (2019)

Shrub land

0.03

ADSWE (2015)

Bare land

0.6

BCEOM (2004), Bewket and Teferi (2009)

Forest

0.01

Hurni (1985), Bewket and Teferi (2009)

Settlement

0.12

Asmamaw & Mohammed (2019)

Grass land

0.05

Mekuriaw (2017)

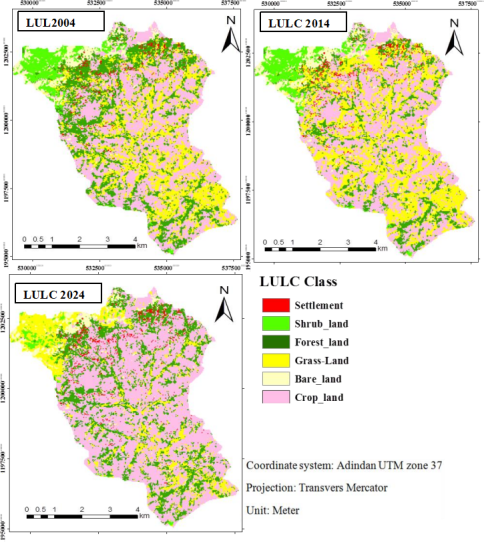
Figure 5. Land Use Land cover of the three study Periods.
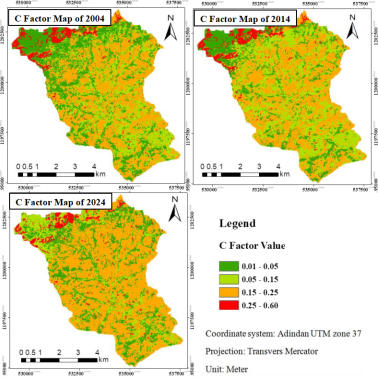
Figure 6. C-Factor Map of the study area in three different periods.
2.3.6. Support Practice Factor (P)
The P-factor measures soil erosion control effectiveness between completely effective practices at P=0 and no intervention at P=1. The authors determined P-values through direct observations of actual land management methods. The data from 2004 presented crop strip systems and nuclear-shaped contour furrowing as implemented under government programs. Table 4 indicates The researchers conducted fieldwork with interviews and examined local records to identify terraces and reforestation sites for both years 2014 and 2024.
Table 4. Management practices and p value.

No

Management practices

Management (P value)

1

Protected/reforested

0.50

2

Terraces

0.60

3

Strip cropping

0.80

4

Ploughing on contour

0.90

5

No Management

1.00

Each factor grid (R, K, LS, C, and P) was generated with a 30 m cell size and projected using the Adindan UTM Zone 37N coordinate system with the Adindan datum. Using ArcGIS 10.5, the five soil erosion-controlling factor layers were integrated, and the Revised Universal Soil Loss Equation (RUSLE) was applied to estimate the average annual soil loss in the Bwabwata watershed for 2004, 2014, and 2024 shows in Figure 2. The spatial analyst and statistical tools in ArcGIS were used to calculate soil loss amounts and classify erosion severity levels across the study area.
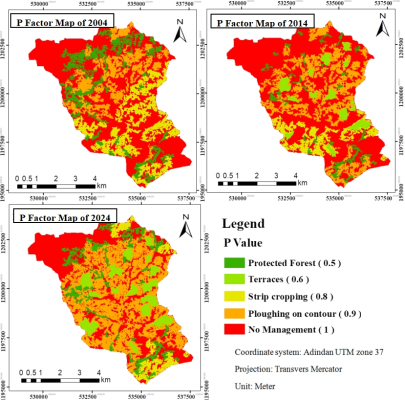
Figure 7. P -Factor Map of the Watershed.
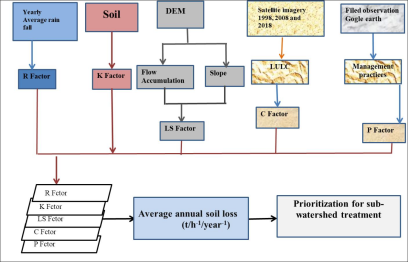
Figure 8. Soil Loss (Erosion) Estimation Flow Chart using RUSLE Model.
3. Results and Discussion
3.1. Soil Erosion Dynamics in Bwabwata Watershed
An assessment of soil erosion in the Bwabwata watershed occurred through implementation of the Revised Universal Soil Loss Equation (RUSLE) within ArcGIS 10.5 through cell-by-cell analysis. The calculated potential soil loss amounts for the study area differed from 0.0 to 808.69 t ha-1 yr-1 (2004) and 0.0 to 924.63 t ha-1 yr-1 (2014) and 0.0 to 876.3 t ha-1 yr-1 (2024). The estimation of yearly soil loss within the watershed area showed a gradual increase from 28.63 to 32.99 to 30.93 t ha-1 yr-1 between 2004 and 2024. These variations indictating shifting land use patterns along with changing topographic conditions.
Table 5. Trends of Mean annual soil loss.

Year

Area/ha

Min

Max

Range

Mean

Annual Soil Loss/t/ha

2004

3800

0

808.0693

808. 69

28.63

108,807.17

2014

3800

0

924.6374

924.63

32.99

125,362.11

2024

3800

0

876.3051

876.30

30.93

117,545.25

According to table 5 shows total soil loss altered substantially throughout the watershed during the study period when 4.36 t ha-1 yr-1 was gained from 2004 to 2014 while 2.06 t ha-1 yr-1 was lost from 2014 to 2024. The combination of afforestation reforestation and terracing practices during 2014–2024 helped decrease erosion levels (2014–2024). Further details are discussed below.
3.2. Temporal Dynamics of Soil Erosion
There are notable temporal fluctuations in the evaluation of soil erosion in the Bwabwata watershed during a two-decade period (2004–2024). With an average yearly soil loss of 28.63 t ha-1 yr-1, the potential soil erosion in 2004 ranged from 0.0 to 808.69 t ha-1 yr-1, resulting in 108,807.17 tons of soil loss from 3,800 hectares. With rates ranging from 0.0 to 924.63 t ha-1 yr-1 and an increasing average yearly loss of 32.99 t ha-1 yr-1, soil erosion accelerated by 2014. As a result, overall soil loss increased to 125,362.11 tons, which is 4.36 t ha-1 yr-1 more than in 2004. However, better land management techniques helped to slow soil loss in 2024. The range of the anticipated erosion rate was 0.0 to 876.3.
Soil loss decreased in 2024 as a result of better land management techniques. With an average yearly loss of 30.93 t ha-1 yr-1, or 117,545 tons of soil loss, the predicted erosion rate varied from 0.0 to 876.3 t ha-1 yr-1. The efficiency of conservation efforts was demonstrated by the 1.31 t ha-1 yr-1 drop that occurred between 2014 and 2024, despite the overall trend showing an increase of 2.3 t ha-1 yr-1 over two decades. Areas most impacted by erosion throughout the research period are visually represented by the Soil Erosion Risk Map (Figure 9), which shows the spatial distribution of soil erosion risk throughout the watershed.
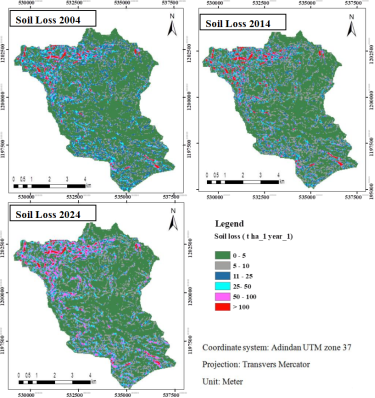
Figure 9. Soil Erosion Map in 2004.2014 and 2024.
Table 6. Numeric soil loss range, area coverage, and severity class 2004, 2014 and 2024.
2004.

Numeric range of

Area/ha

%

Annual soil loss/ton

percent of total soil loss

soil loss (t ha_1 year_1)

0-5

1674.2

44.06

6,696.80

9.25

5-10

561.69

14.78

4,325.01

5.98

11-25

797.3

20.98

10,843.28

14.98

25-50

442.76

11.65

13,459.90

18.60

50-100

225.63

5.94

16,177.67

22.35

>100

98.42

2.59

20,865.04

28.83

2014
2014

Numeric range of

Area /ha

%

Annual soil loss/ton

Percent of total soil loss

soil loss (t ha_1 year_1)

0-5

1546.73

40.70

6,186.92

7.19

5-10

577.63

15.20

4,447.75

5.17

11-25

754.97

19.87

10,267.59

11.93

25-50

467.74

12.31

14,219.30

16.52

50-100

321.33

8.46

23,039.36

26.77

>100

131.60

3.46

27,899.20

32.42

2024
2024

Numeric range of

Area/ha

%

Annual soil loss/ton

percent of total soil loss

soil loss (t ha_1 year_1)

0-5

1612.46

42.43

5,966.10

7.83

5-10

591.78

15.57

4,852.60

6.37

11-25

741.75

19.52

10,829.55

14.21

25-50

455.19

11.98

13,564.66

17.80

50-100

297.43

7.83

20,433.44

26.81

>100

101.39

2.67

20,572.03

26.99

Table 6 indicated that Mean soil loss was calculated by considering the total soil loss in a class and the number of the pixel (counts) in the respective class using ArcGIS 10.5 Spatial Analyst Zonal Statistics extension. According to table 6 shows the rate of soil erosion increased from the year 2004 to 2024. In 2004 from the total area of watershed 1564 ha (41.16%) of land soil erosion above SLT level and also 1675.64ha (44.09%), 1595.76ha (42%) of the study area soil erosion values above SLT in 2014 and 2024 respectively.
3.3. Comparison of Findings with Previous and Recent Studies in the Ethiopian Highlands
The estimated average annual soil loss in the Bwabwata watershed (30.93 t ha-1 yr-1) is consistent with findings from both historical and recent studies conducted in the Ethiopian Highlands. According to Renard et al. , the tolerable soil loss threshold commonly referred to as Soil Loss Tolerance (SLT) ranges from 5 to 11 t ha-1 yr-1, depending on local soil characteristics and productivity sustainability. Hurni further adapted this to Ethiopian contexts, suggesting a national SLT benchmark of 10 t ha-1 yr-1 for sustainable land use. The current estimate for Bwabwata thus significantly exceeds both benchmarks, emphasizing critical land degradation risks.
Recent studies between 2019 and 2024 similarly report soil loss levels well above the tolerable thresholds, underscoring the widespread severity of the problem across the Ethiopian Highlands. For example: In the upper Bilate watershed, soil loss ranged from 0.05 to 498.24 t ha-1 yr-1, with an average of 24.1 t ha-1 yr-1 . In the Tul watershed, mean annual soil loss was reduced by 23.5 t ha-1 yr-1 following watershed development interventions . In the Gilgel Abay watershed, rates averaged 39.8 t ha-1 yr-1 in erosion-prone zones . In East Hararghe, average erosion rates ranged from 33 to 50 t ha-1 yr-1 over the last three decades, reflecting the worsening trend . The Anger River sub-basin recorded an average of 35.5 t ha-1 yr-1 . The Hare watershed showed an increase from 19.34 to 27.89 t ha-1 yr-1 between 2001 and 2021 .
3.4. Identification of Soil Erosion Hotspots in Bwabwata Watershed
The prioritization of sub-watersheds is a crucial step in soil conservation planning, enabling targeted interventions in areas experiencing severe soil loss. In this study, ten sub-watersheds were delineated based on hydrological drainage patterns. The erosion risk map was systematically reclassified to identify and rank sub-watersheds according to their susceptibility to erosion. This prioritization facilitates the implementation of effective conservation measures to mitigate soil degradation and enhance watershed sustainability. (figure 10) Soil erosion risk maps and severity classes for the Bwabwata watershed were developed based on average annual soil loss. The Soil Loss Tolerance (SLT) value served as the basis for categorizing erosion severity. The actual soil erosion rate was quantitatively assessed, and the distribution of soil loss was mapped accordingly. Table 7 presents the average soil loss from sub-watersheds, highlighting critical areas requiring intervention.
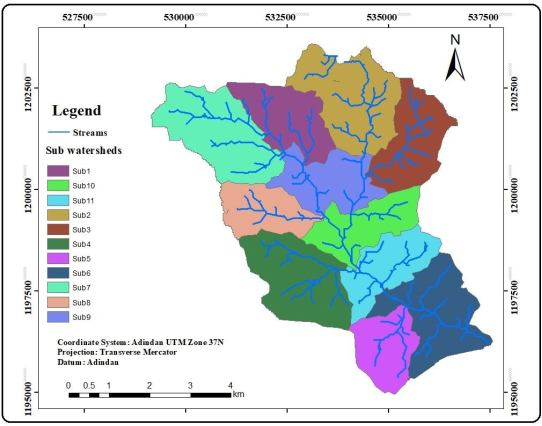
Figure 10. Map of the Sub watershed.
Table 7. Average Soil loss from the sub-watersheds.

Sub watershed

Area

Soil loss statistics

Total Soil loss

ha

%

Min

Max

Mean

Sum

Ton/ha

%

Sub1

317.64

8.36

0

766.11

51.93

42,165.10

17,449.74

20.93

Sub2

475.59

12.52

0

652.09

29.88

36,028.47

14,686.23

17.61

Sub3

347.52

9.15

0

206.82

18.36

8,124.38

2,904.24

3.48

Sub4

405.12

10.66

0

278.86

12.72

11,171.41

3,534.61

4.24

Sub5

228.00

6.00

0

165.22

16.18

6,164.58

1,865.88

2.24

Sub6

428.16

11.27

0

410.04

21.68

9,815.55

5,002.75

6.00

Sub7

446.61

11.75

0

876.30

62.30

76,668.84

30,504.85

36.58

Sub8

239.43

6.30

0

122.98

12.44

5,998.13

1,780.88

2.14

Sub9

316.38

8.33

0

229.27

11.61

7,497.44

2,408.12

2.89

Sub10

297.75

7.84

0

146.36

4.64

4,207.84

1,383.02

1.66

Sub11

297.75

7.84

0

115.14

6.28

5,591.03

1,870.54

2.24

According to the study result, the rate of soil erosion in the entire sub watershed passed the threshold 5-11t ha-1 yr-1. This was accepted as the soil loss tolerance value for the entire watershed. As table 7 shows, sub watersheds 1, 2, 3, 4, 5, 6, 7and sub watershed 8, are above the tolerance value, while sub watersheds 9, 10 and 11 are classified under tolerance value.
3.5. Prioritization for Sub-watershed Treatment
RUSLE was applied for the identification and prioritization of the critical sub-watersheds on the basis of average annual soil loss. The predicted amount of soil loss and its spatial distribution can provide a basis for comprehensive management and sustainable land use for the watershed. As Table 8 shows the areas with high and severe soil erosion warrant special priority for the implementation of control measures.
Table 8. E rosion risk classes.

Soil loss (t/ha/y)

Severity classes

Priority classes

Sub-Watersheds

Area

(ha)

(%)

5-11

Moderate

IV

10, 11

566.41

14.906

11-20

High

III

3, 4, 5, 8, 9

1562.31

41.113

20-30

Very high

II

6, 2

897.37

23.615

>30

Severe

I

1, 7

773.91

20.366

Prioritizing sub-watersheds based on soil loss rates is effective when the number of sub-watersheds is small and sufficient data are available. This method is particularly useful when soil loss potentials across sub-watersheds show minimal variation. The erosion risk map for Bwabwata watershed was prepared, identifying critical sub-watersheds for targeted management to reduce soil loss. Figure 6 illustrates the erosion risk classes per sub-watershed level, providing a visual representation of areas requiring immediate attention.
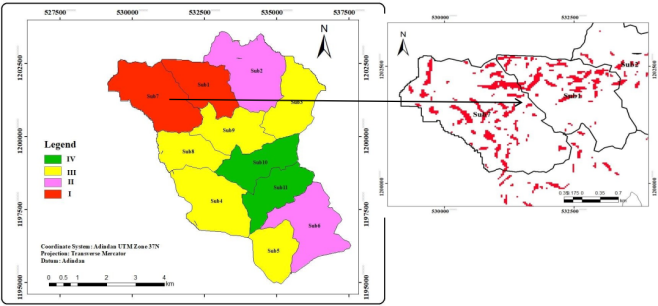
Figure 11. Erosion Risk classes per sub watershed Level.
Bwabwata watershed was characterized by different levels of erosion risk. Table 8 present severe erosion affects 773.91 ha (20.36%), very high risk impacts 897.37 ha (23.61%), and moderate to high risk covers 2128.72 ha (56.01%). Overall, 85% of the watershed (3233.59 ha) exceeds the tolerable soil loss level of 11 t ha-1 yr-1. Areas with high to very severe erosion potential were classified as hotspots, requiring immediate conservation efforts, while areas with lower risk were regard cold spots. Sub-watersheds were ranked for treatment, with sub-watersheds 1 and 7 prioritized, followed by sub-watersheds 2 and 6, and others receiving attention in later stages.
4. Conclusion
This study attempts to find soil erosion hotspots, magnitude, and dynamics from the years 2004, 2014, and 2024 in the Bwabwata watershed, which is located in the upper Blue Nile basin. The study demonstrates that an empirically based erosion assessment model, the RUSLE, integrated with satellite remote sensing and geographical information systems, can provide useful information for conservation practices. The finding suggests that spatial variability in the severity of soil loss within the study watershed indicates the hotspots of soil erosion, where there is a need to prioritize land management interventions. Firstly, the majority of the watershed area is potentially prone to soil erosion hazards. Secondly, the finding revealed that there was a significant increasing trend in soil erosion rate i.e., 28.63 ton/ha/year, 32.99 32.99 ton/ha/year and 30.93 ton/ha/year in 2004, 2014, and 2024, respectively The current potential soil erosion rate in Bwabwata watershed was estimated to be in the range of 0.0 to 876.3 tons/ha/year. The average soil loss for the entire watershed was calculated to be 30.93 tons/ha/year, and the total soil loss in the watershed in 2024 was calculated to be 117,545.25 tons of soil from an area of 3800 hectares. According to the 2024 soil erosion study results, areas that are classified based on SLT erosion risk class cover an area of 1595.76 ha (42 %) of the study area above the tolerance value. The result of the study, the soil erosion hotspot map developed for the watershed based on their average annual soil loss and SLT, the severe and very high soil erosion class, was significant, which requires appropriate conservation measures before the area is turned into a level of irreversibility. F Accordingly, the top priority for soil conservation measures must be given to sub-watersheds 7 & 1, in the first stage, sub-watersheds 2 and 6 can be considered; in the second stage, sub-watersheds 3, 4, 5, 4, 5, 9, and 9; in the third stage, sub-watersheds 10 & 11 could finally undergo the process.
Abbreviations

RUSLE

Revised Universal Soil Loss Equation

DEM

Digital Elevation Model

SLT

Soil Loss Tolerance

LULC

Land Use and Land Cover

USGS

United States Geological Survey

NMSA

National Meteorological Services Agency

Acknowledgments
We express our heartfelt thanks to Dr. Asnake Mekuriaw and those who have directly or indirectly contributed to the study.
Ethical Approval and Consent to Participate
This research paper entitled” Mapping Soil Erosion Hotspot Areas in the Bwabwata Watershed North Central Highlands of Ethiopia, is aimed to estimate soil loss and prioritize sub-watersheds for soil and water conservation planning by employing GIS-based RUSLE models. Therefore, we the author approve to publish the findings, and there is no ethical conflict.
Author Contributions
Moges Gtachew Ebrea: Conceptualization, Formal analysis, Investigation, Methodology, Visualization, Writing – review & editing
Terefe Hundessa Bekana: Data curation, Methodology, Supervision, Validation, Visualization
Netsanet Habtamu Yessuf: Conceptualization, Data curation, Methodology, Supervision, Writing – review & editing
Consent for Publication
The author read the manuscript and agreed to publication.
Funding
The author(s) received no financial support for the research, authorship, and/or publication of this article.
Data Availability Statement
Data will be available on the reasonable request of the first Author.
Conflicts of Interest
The authors declare no conflicts of interest.
References
[1] T. Asante, “The impact of soil erosion on African farmers and crop productivity,” The Farmer's Journal Africa, 2023. Available:
[2] M. Getachew, B. Belay, and T. Worku, “National soil loss rate estimation in Ethiopia using RUSLE and GIS,” Heliyon, vol. 10, no. 4, 2024. Available:
[3] D. A. Teku and T. Derbib, “Uncovering the drivers, impacts, and urgent solutions to soil erosion in the Ethiopian Highlands: a global perspective on local challenges,” Frontiers in Environmental Science, vol. 12, 2024. Available:
[4] N. Yeneneh, E. Elias, and G. L. Feyisa, “Quantify soil erosion and sediment export in response to land use/cover change in the Suha watershed, northwestern highlands of Ethiopia: implications for watershed management,” Environmental Systems Research, vol. 11, no. 20, 2022. Available:
[5] B. Terefe et al., “Review of soil loss estimation in Ethiopia: Evaluating the use of the RUSLE model integrated with GIS and remote sensing techniques,” Research Square, Jan. 2024. [Online]. Available:
[6] A. J. D. Astuti et al., “Recent dynamics in sediment connectivity in the Ethiopian Highlands,” Regional Environmental Change, vol. 24, no. 109, 2024. [Online]. Available:
[7] M. Adugna and H. Wolde, “Modeling soil erosion under conservation measures in Ethiopia,” Catena, vol. 230, 2024. [Online]. Available:
[8] D. O. Gemeda, M. B. Moisa, I. N. Dejene, and B. B. Merga, “Soil loss estimation and prioritization using geographic information systems and the RUSLE model: a case study of the Anger River sub-basin, Western Ethiopia,” J. Water Clim. Change, vol. 13, no. 3, pp. 1170–1184, 2022.
[9] M. Mekonnen and A. M. Melesse, “Soil erosion mapping and hotspot area identification using GIS and remote sensing in northwest Ethiopian highlands near Lake Tana,” in Nile River Basin: Hydrology, Climate and Water Use, A. M. Melesse, Ed. Dordrecht: Springer, 2011, pp. 207–224.
[10] G. A. Tiruneh, “Evaluating the erodibility of major soils of Aba Gerima and Guder watersheds using simulated rainfall: implication for modeling soil erosion,” Environ. Dev. Sustain., vol. 26, no. 2, pp. 1685–1702, 2024.
[11] A. Gashaw, T. Tulu, and M. Argaw, “Erosion risk assessment for prioritization of conservation measures in Geleda watershed, Blue Nile basin, Ethiopia,” Environ. Syst. Res., vol. 6, no. 1, p. 17, 2017.
[12] T. Gashaw, A. W. Worqlul, Y. T. Dile, S. Addisu, A. Bantider, and G. Zeleke, “Evaluating potential impacts of land management practices on soil erosion in the Gilgel Abay watershed, upper Blue Nile basin,” Heliyon, vol. 6, no. 8, p. e04777, 2020.
[13] T. A. Kebede, N. Haregeweyn, E. Adgo, K. Ebabu, D. T. Meshesha, M. Tsubo, T. Masunaga, and A. A. Fenta, “Determining C- and P-factors of RUSLE for different land uses and management practices across agro-ecologies: case studies from the Upper Blue Nile basin, Ethiopia,” Phys. Geogr., vol. 41, no. 2, pp. 109–130, 2020.
[14] M. Mustefa, F. Fufa, and W. Takala, “GIS estimation of annual average soil loss rate from Hangar River watershed using RUSLE,” J. Water Clim. Change, vol. 11, no. 2, pp. 529–539, 2020.
[15] B. G. Tikuye, “Assessing current and projected soil loss under changing land use and climate using RUSLE with Remote sensing and GIS in the Lake Tana Basin, Upper Blue Nile River Basin, Ethiopia,” Egypt. J. Remote Sens. Space Sci., vol. 24, no. 3, pp. 561–570, 2021.
[16] K. G. Renard, G. R. Foster, G. A. Weesies, D. K. McCool, and D. C. Yoder, Predicting Soil Erosion by Water: A Guide to Conservation Planning with the Revised Universal Soil Loss Equation (RUSLE), U.S. Department of Agriculture, Agriculture Handbook No. 703, 1997.
[17] L. Tamene, A. Park, A. Dikau, and A. Vlek, “Analysis of factors determining sediment yield variability in the highlands of northern Ethiopia,” Geomorphology, vol. 103, no. 3, pp. 369–382, 2009.
[18] T. Halefom, A. T. Gebreyesus, and B. Gessesse, “Soil erosion modeling using RUSLE and GIS in the Gumara watershed, Ethiopia,” Environmental Systems Research, vol. 7, no. 1, p. 17, 2018.
[19] M. Alemu, “Application of RUSLE and GIS for soil erosion assessment in the Awash River Basin, Ethiopia,” Journal of Environment and Earth Science, vol. 8, no. 1, pp. 1–10, 2018.
[20] A. Mekuriaw, “Soil erosion risk assessment using GIS and RUSLE model in the Awash River Basin, Ethiopia,” African Journal of Environmental Science and Technology, vol. 11, no. 12, pp. 601–614, 2017.
[21] Mekuriaw, “GIS-based soil loss estimation using RUSLE model in the Awash River Basin, Ethiopia,” International Journal of Environmental Monitoring and Analysis, vol. 5, no. 5, pp. 126–134, 2017.
[22] H. Hurni, “Erosion–productivity–conservation systems in Ethiopia,” in Soil Conservation and Productivity, Proceedings of the 4th International Conference on Soil Conservation, Maracay, Venezuela, 1985, pp. 654–674.
[23] P. Porto, M. Bacchi, G. Preiti, M. Romeo, and M. Monti, “Combining plot measurements and a calibrated RUSLE model to investigate recent changes in soil erosion in upland areas in Southern Italy,” International Journal of Sediment Research, vol. 37, no. 4, pp. 447–457, 2022.
[24] M. Tesfaye, Soil Conservation Experiments on Cultivated Land in the Maybar Area, Wello Region, Ethiopia, Research Report 16, Soil Conservation Research Project, University of Bern, 1988. Google BooksBioOne+2Google Books+2The AI for Academic Research | SciSpace+2.
[25] Waghmare and M. Suryawanshi, “Mapping Soil Erosion Risk: Using Remote Sensing and GIS,” IOSR Journal of Applied Geology and Geophysics, vol. 5, no. 3, pp. 1–5, 2017.
[26] L. Ma, Y. Liu, X. Zhang, Y. Ye, G. Yin, and B. A. Johnson, “Deep learning in remote sensing applications: A meta-analysis and review,” ISPRS J. Photogramm. Remote Sens., vol. 152, pp. 166–177, Dec. 2019.
[27] W. H. Wischmeier and D. D. Smith, Predicting Rainfall Erosion Losses: A Guide to Conservation Planning, U.S. Department of Agriculture, Agriculture Handbook No. 537, 1978. Wikipedia, la enciclopedia libre+1Wikipedia+1.
[28] M. Mitasova, H. Mitas, W. M. Brown, and D. P. Gerdes, “Modeling spatially distributed soil erosion and deposition using GIS,” Land Use Policy, vol. 13, no. 2, pp. 131–144, 1996.
[29] R. L. Goldman, H. Tallis, P. Kareiva, and G. C. Daily, “Field evidence that ecosystem service projects support biodiversity and diversify options,” Proceedings of the National Academy of Sciences, vol. 105, no. 27, pp. 9445–9448, 2008.
[30] A. T. Desalegn, T. L. Helsebo, and S. S. Bikiko, "Assessment of soil erosion and prioritization of conservation and restoration measures using RUSLE and Geospatial techniques: the case of upper Bilate watershed," International Journal of River Basin Management, vol. 22, no. 4, pp. 1–15, 2024. [Online]. Available:
[31] M. B. Moisa, I. N. Dejene, B. B. Merga, and D. O. Gemeda, "Assessment of the effects of land use/cover changes on soil loss and sediment export in the Tul Watershed, Northwest Ethiopia using the RUSLE and InVEST models," International Journal of River Basin Management, vol. 22, no. 4, pp. 1–15, 2023. [Online]. Available:
[32] A. T. Desalegn, T. L. Helsebo, and S. S. Bikiko, "Watershed prioritization for conservation planning using RUSLE and morphometric methods, Northwestern Ethiopia," Journal of Mountain Science, vol. 20, pp. 2242–2262, 2023. [Online]. Available:
[33] M. Bekele, "Water Erosion Risk Assessment for Conservation Planning in the East Hararghe Zone, Ethiopia," Geosciences, vol. 13, no. 6, pp. 1–20, 2023. [Online]. Available:
[34] M. B. Moisa, I. N. Dejene, B. B. Merga, and D. O. Gemeda, "Soil loss estimation and prioritization using geographic information systems and the RUSLE model: a case study of the Anger River sub-basin, Western Ethiopia," Journal of Water and Climate Change, vol. 13, no. 3, pp. 1170–1184, 2022. [Online]. Available:
[35] M. Guche, "GIS‐Based Soil Erosion Dynamics Modeling by RUSLE at Watershed Level in Hare Watershed, Rift Valley Basin, Ethiopia," Applied and Environmental Soil Science, vol. 2024, Article ID 9916448, 2024. [Online]. Available:
[36] G. Chander and B. L. Markham, “Revised Landsat-5 TM radiometric calibration and conversion to reflectance,” Remote Sensing of Environment, vol. 78, no. 3, pp. 217–223, 2001.
[37] R. Guder and F. Kabeta, “Morphometric and land use land cover analysis for the management of water resources in Guder sub-basin, Ethiopia,” Appl. Water Sci., vol. 15, no. 18, 2025.
[38] Balasubraman. (2017). Soil Erosion- Causes and Effects Soil Erosion – Causes and Effects By Prof. A. Balasubramanian Centre for Advanced Studies in Earth Science, University of Mysore, Mysore, (March).
Cite This Article
  • APA Style

    Ebrea, M. G., Bekana, T. H., Yessuf, N. H. (2025). Mapping Soil Erosion Hotspot Areas in the Bwabwata Watershed North Central Highlands of Ethiopia. International Journal of Environmental Monitoring and Analysis, 13(4), 114-129. https://doi.org/10.11648/j.ijema.20251304.11

    Copy | Download

    ACS Style

    Ebrea, M. G.; Bekana, T. H.; Yessuf, N. H. Mapping Soil Erosion Hotspot Areas in the Bwabwata Watershed North Central Highlands of Ethiopia. Int. J. Environ. Monit. Anal. 2025, 13(4), 114-129. doi: 10.11648/j.ijema.20251304.11

    Copy | Download

    AMA Style

    Ebrea MG, Bekana TH, Yessuf NH. Mapping Soil Erosion Hotspot Areas in the Bwabwata Watershed North Central Highlands of Ethiopia. Int J Environ Monit Anal. 2025;13(4):114-129. doi: 10.11648/j.ijema.20251304.11

    Copy | Download

  • @article{10.11648/j.ijema.20251304.11,
      author = {Moges Gtachew Ebrea and Terefe Hundessa Bekana and Netsanet Habtamu Yessuf},
      title = {Mapping Soil Erosion Hotspot Areas in the Bwabwata Watershed North Central Highlands of Ethiopia},
      journal = {International Journal of Environmental Monitoring and Analysis},
      volume = {13},
      number = {4},
      pages = {114-129},
      doi = {10.11648/j.ijema.20251304.11},
      url = {https://doi.org/10.11648/j.ijema.20251304.11},
      eprint = {https://article.sciencepublishinggroup.com/pdf/10.11648.j.ijema.20251304.11},
      abstract = {Soil erosion produces major environmental problems in Ethiopian highlands while continuing to affect the Bwabwata watershed as an ecological issue. Effective control of soil erosion in watersheds necessitates the identification of erosion hotspots. The identification of such hotspots has been missing from past research investigations within this area. A GIS-based RUSLE model implementation helps estimate soil loss and determine the order of priority for sub-watersheds in terms of soil and water conservation planning. Mean annual precipitation, together with digital soil data and digital elevation models combined with slope steepness measurements, allowed the computation of RUSLE output values. The RUSLE model incorporated into a GIS platform evaluated soil erosion effects resulting from land use and land cover changes in three specific periods. The quantitative evaluation shows both cropland and settlement areas extended from 2004 to 2024, but forest and shrubland decreased because of their conversion to different land uses. The watershed experienced a significant elevation of mean annual soil erosion rate from 28.63 t/ha/yr in 2004 to 32.99 t/ha/yr in 2014, with a subsequent minor erosion reduction to 30.93 t/ha/yr in 2024. Currently, the total soil loss in the study area amounts to 117,545.25 tons from 3,800 hectares. The soil loss tolerance threshold exceeds in 42% of the study area, which spreads across 1,595.76 hectares, resulting in high erosion risk areas. A successful approach to safeguarding watershed resources requires specific allocation of SWC efforts toward high-risk sub-watersheds, along with planned LULC management.},
     year = {2025}
    }
    

    Copy | Download

  • TY  - JOUR
    T1  - Mapping Soil Erosion Hotspot Areas in the Bwabwata Watershed North Central Highlands of Ethiopia
    AU  - Moges Gtachew Ebrea
    AU  - Terefe Hundessa Bekana
    AU  - Netsanet Habtamu Yessuf
    Y1  - 2025/07/04
    PY  - 2025
    N1  - https://doi.org/10.11648/j.ijema.20251304.11
    DO  - 10.11648/j.ijema.20251304.11
    T2  - International Journal of Environmental Monitoring and Analysis
    JF  - International Journal of Environmental Monitoring and Analysis
    JO  - International Journal of Environmental Monitoring and Analysis
    SP  - 114
    EP  - 129
    PB  - Science Publishing Group
    SN  - 2328-7667
    UR  - https://doi.org/10.11648/j.ijema.20251304.11
    AB  - Soil erosion produces major environmental problems in Ethiopian highlands while continuing to affect the Bwabwata watershed as an ecological issue. Effective control of soil erosion in watersheds necessitates the identification of erosion hotspots. The identification of such hotspots has been missing from past research investigations within this area. A GIS-based RUSLE model implementation helps estimate soil loss and determine the order of priority for sub-watersheds in terms of soil and water conservation planning. Mean annual precipitation, together with digital soil data and digital elevation models combined with slope steepness measurements, allowed the computation of RUSLE output values. The RUSLE model incorporated into a GIS platform evaluated soil erosion effects resulting from land use and land cover changes in three specific periods. The quantitative evaluation shows both cropland and settlement areas extended from 2004 to 2024, but forest and shrubland decreased because of their conversion to different land uses. The watershed experienced a significant elevation of mean annual soil erosion rate from 28.63 t/ha/yr in 2004 to 32.99 t/ha/yr in 2014, with a subsequent minor erosion reduction to 30.93 t/ha/yr in 2024. Currently, the total soil loss in the study area amounts to 117,545.25 tons from 3,800 hectares. The soil loss tolerance threshold exceeds in 42% of the study area, which spreads across 1,595.76 hectares, resulting in high erosion risk areas. A successful approach to safeguarding watershed resources requires specific allocation of SWC efforts toward high-risk sub-watersheds, along with planned LULC management.
    VL  - 13
    IS  - 4
    ER  - 

    Copy | Download

Author Information