Abstract
Sensors act as transducers that convert physical signals into electrical outputs for analysis. When integrated with IoT, they enhance water quality monitoring by improving accuracy, autonomy, and real-time detection of parameters such as pathogens, temperature, and Total Dissolved Solids/Electrical Conductivity (TDS/EC). In line with SDG 6, this study developed an IoT-based system for on-site monitoring and real-time data transmission to relevant authorities. The system uses TDS/EC sensors to measure dissolved ion concentration and a DS18B20 digital temperature sensor to provide temperature compensation for conductivity values. Data are processed via an Arduino Mega and transmitted to the Thing Speak cloud. Our results show temperature stability (28–30°C) and demonstrate that compensation significantly reduces variability, stabilizing TDS/EC readings and improving correlation. The compensation results demonstrated that raw TDS/EC values had a weak correlation with temperature, whereas compensated readings remained stable across the same conditions. The temperature histogram highlights the narrow range of environmental variation, reinforcing dataset stability. Histograms of raw versus compensated data confirm that DS18B20-based compensation enhances measurement accuracy and reliability, ensuring that detected anomalies reflect true water quality variations rather than environmental noise. Collectively, these plots validate that DS18B20-based compensation significantly improves accuracy and reliability in real-time IoT water quality monitoring. In summary, the correlation and regression analysis clearly demonstrate the effectiveness of the temperature compensation mechanism. A strong positive correlation (r = 0.82) and high R² value (0.67) indicate that raw TDS/EC measurements are heavily influenced by temperature fluctuations. After applying DS18B20-based temperature compensation, these effects were significantly reduced, with the correlation dropping to 0.18 and R² decreasing to 0.03. This confirms that temperature compensation enhances the stability, reliability, and interpretability of conductivity-based water quality measurements.
Keywords
Sensors, Water Quality Monitoring (WQM) System, Water Quality Parameters (WQP), Internet of Things (IoT), Temperature
1. Introduction
In time past, the conventional method of collecting samples of water and taking to laboratory for testing of the drinking water quality is time consuming. In the modern era, Information Technology has revolutionized the process and activities involved in water quality monitoring. The use of IoT in water quality monitoring involves the adoption of intelligent nodes and sensors that can act on their own, they identify pathogens within the water, check for temperature variation, turbidity and the Power of Hydrogen (pH) level of the water
. IoT refers to a global network of smart devices that can sense their environment and communicate with users and other systems over the internet, enabling real-time interaction and data exchange
| [2] | Anuradha T, Bhakti, Chaitra R, and Pooja D, “IRJET-V5I5315,” International Research Journal of Engineering and Technology (IRJET), 2018, Accessed: May 23, 2025. Available:
www.irjet.net |
[2].
Likewise, the Water Quality Monitoring (WQM) systems that utilize IoT technology help to provide real-time data and insights that are crucial for ensuring the safety and quality of drinking water. By using sensors and automated data collection, these systems can efficiently track various parameters like Ph, turbidity, dissolved oxygen, and contaminants. Fresh water is indeed a precious resource that sustains all life. Pollution from agricultural runoff, industrial waste, and urban development can severely impact water quality, making purification essential for safe consumption
. Agricultural runoff adds fertilizers, pesticides, and nitrates, which can lead to nutrient pollution and harmful algal blooms. Residuals from these pollutants can seep into groundwater or be carried into surface waters by rain, compounding the problem
| [3] | V. Lakshmikantha, A. Hiriyannagowda, A. Manjunath, A. Patted, J. Basavaiah, and A. A. Anthony, “IoT based smart water quality monitoring system,” Global Transitions Proceedings, vol. 2, no. 2, pp. 181–186, Nov. 2021, https://doi.org/10.1016/j.gltp.2021.08.062 |
[3]
. Also, the scarcity of fresh water is indeed a pressing global issue. With only 6% of the world’s water classified as fresh, and 85% of this already heavily utilized by agriculture, the demand on these limited resources is immense
. Furthermore, water treatment processes sometimes fail to remove all harmful substances or may inadvertently introduce excess chemicals into the water. For example, disinfectants like chlorine, while essential for killing pathogens, can react with organic matter in water to form potentially harmful byproducts
| [5] | K. Shanmugam, M. E. Rana, and R. S. J. Singh, “IoT-based Smart Water Quality Monitoring System for Malaysia,” in 2021 3rd International Sustainability and Resilience Conference: Climate Change, Institute of Electrical and Electronics Engineers Inc., 2021, pp. 530–538.
https://doi.org/10.1109/IEEECONF53624.2021.9668120 |
[5]
. The growing depletion of water resources and declining water quality underscore the critical need for monitoring, as emphasized in the SDG 6, to ensure the sustainable availability and safety of water for all
| [6] | J. O. Ighalo, A. G. Adeniyi, and G. Marques, “Internet of things for water quality monitoring and assessment: A comprehensive review,” in Studies in Computational Intelligence, vol. 912, Springer, 2021, pp. 245–259.
https://doi.org/10.1007/978-3-030-51920-9_13 |
[6]
. To address this issue, a real time IoT-Based water quality monitoring system, has been designed for on-site monitoring and real-time reporting of water quality data to relevant authorities, enabling prompt action. This involves, measuring the quality of the water using the TDS/EC and temperature parameters. The, TDS/EC sensors measure the TDS or electrical conductivity, EC of water. High EC levels indicate high concentrations of dissolved ions, which can affect water taste and potentially harm aquatic organisms
| [7] | S. Singh, A. Kumar, A. Prasad, and N. Bharadwaj, “IOT based Water Quality Monitoring System,” International Journal On Recent & Innovative Trend In Technology, 2018. Available:
www.ijritt.org |
[7]
.
This paper depicts the effective way to implement the WQM Systems. The following are the key objectives:
1) To design and implement an IoT-based water quality monitoring system using DS18B20 (temperature) and TDS/EC sensors.
2) To measure and analyze the relationship between temperature and conductivity (TDS) as indicators of water contamination risk.
3) To visualize water quality data on an IoT-enabled platform for real-time monitoring.
4) To evaluate the reliability of low-cost sensors in identifying potential unsafe water conditions.
This work presents a Water Quality Management System (WQMS) that uses an Arduino Mega controller and employs both TDS/EC and temperature sensors to identify the pathogens, that can be implemented on a Database Management System (DBMS) - Think Speak server. The remaining part of this paper is divided as follows. Section 2 reviewed works that are relevant to our study. Section 3 discusses materials used for the project, methods, overall system design for the water quality monitoring system, as well as, the five major components at the physical layer, such as the DS18B20 digital temperature sensors and TDS/EC sensor, Arduino mega, Sim808 IoT gateway, and the serial monitor, and the algorithms used, while in section 4, The DS18B20 digital temperature sensor is employed to measure environmental temperature, providing essential input for compensating TDS readings in real time. Complementing this, the TDS/EC sensor directly measures water quality by detecting total dissolved solids and conductivity, enabling a more accurate and reliable assessment of overall water conditions. Section 5 concludes the paper with recommendation.
2. Related Work
S. Singh et al. conducted exploratory analysis to investigate the feasibility of an economical, IoT-enabled WQM system for real-time monitoring and remote access, though it remains unimplemented and undeveloped in design
| [7] | S. Singh, A. Kumar, A. Prasad, and N. Bharadwaj, “IOT based Water Quality Monitoring System,” International Journal On Recent & Innovative Trend In Technology, 2018. Available:
www.ijritt.org |
[7]
. proposed a smart and efficient based WQM system to build a comprehensive, scalable, and autonomous IoT-based WQM system capable of real-time data processing, intelligent alerting, and remote accessibility, while promoting modularity, field application, and smart city integration. Furthermore, it uses Analog-to-Digital Converters (ADC) to process sensor data, which is then uploaded to the cloud for continuous monitoring. The system checks if sensor values exceed preset thresholds to trigger alerts for immediate action by end users. Also, to classify water quality based on comparison with standard safe drinking water ranges: including pH (6.5–8.5), Turbidity (<5 NTU), Conductivity (200–800 µS/cm), CO₂ (<2.0 mg/L), and Humidity (40–100%). Also, to test three water samples, concluding that one sample (pH 7.5) is safe for drinking, while the other two (pH 9.3 and 9.72) exceed safe pH limits. Also, it highlights the need for better wireless protocols and updated IoT technologies for improved real-time communication and system responsiveness. Also, the use of latest, high-quality sensors, and evaluation criteria to define and assess a sensor's reliability under changing environmental conditions. Moreover, it emphasizes that the system is simple to use, cost-effective, energy-efficient, autonomous, field-deployable, and aligned with Industry 4.0 standards. Additionally, the study references who developed a similar but simpler system using only pH and conductivity sensors, with data sent to Firebase via Wi-Fi, highlighting: User-friendliness, modular upgradability (e.g., GPRS module if Wi-Fi is unavailable), robust packaging, and potential for deployment across different piping environments
| [3] | V. Lakshmikantha, A. Hiriyannagowda, A. Manjunath, A. Patted, J. Basavaiah, and A. A. Anthony, “IoT based smart water quality monitoring system,” Global Transitions Proceedings, vol. 2, no. 2, pp. 181–186, Nov. 2021, https://doi.org/10.1016/j.gltp.2021.08.062 |
[3]
.
carried out Systematic Literature Review (SLR) on WQM systems to analyze existing literature to understand how WQM systems function, what parameters are most critical, and how IoT integration enhances the efficiency, accuracy, and automation of water quality monitoring. Furthermore, it explores the essential parameters used to determine the condition of water and examine the impact of IoT technologies in transforming WQM systems, including their role in data acquisition, assessment, and decision-making. Also, it reviews the hardware and software components involved in modern WQM implementations. Also, it highlights that the reviewed systems are generally simple to understand, and capable of features such as water level detection using ultrasonic sensors
| [6] | J. O. Ighalo, A. G. Adeniyi, and G. Marques, “Internet of things for water quality monitoring and assessment: A comprehensive review,” in Studies in Computational Intelligence, vol. 912, Springer, 2021, pp. 245–259.
https://doi.org/10.1007/978-3-030-51920-9_13 |
[6]
. investigated a smart, data-driven, and automated WQM system that integrates IoT, machine learning, and advanced filtration technologies to ensure water safety, with a focus on scalability, real-time analytics, and intelligent response mechanisms. Also, to combine sensor data with deep learning techniques, specifically using an Artificial Neural Network (ANN) with a Multilayer Perceptron model, to train and evaluate data against preset standards and classify water as safe or unsafe. Furthermore, it enables communication with Wireless Sensor Networks (WSNs) and upload real-time results to the cloud, allowing for continuous monitoring and intelligent decision-making. Also, it integrates a multi-stage water filtration system for second-level intelligence that treats water in response to sensor readings: including micro sediment cartridge, to remove physical particles (dust, mud, etc.). Also, carbon cartridge, eliminates chlorine and odors. Also, reverse osmosis membrane, filters organic/inorganic contaminants (e.g., fluoride, arsenic, lead). Moreover, it ensures the system is reliable, scalable, and cost-effective, with potential for deployment in smart water management systems. Also, it utilizes IoT platforms and big data analytics for data storage, analysis, and visualization to monitor trends and support decision-making. Also, note the limitation that only one water sample was tested, which is insufficient to validate the accuracy and robustness of the deep learning model and big data platform
.
proposed a cost-effective, smart, and autonomous water quality monitoring and treatment system for buildings and communities, supporting real-time decision-making, water safety, and future scalability toward smart city infrastructure. Furthermore, it enables real-time data processing and cloud uploading, supporting continuous monitoring of water quality and integration into smart infrastructure. Also, it incorporates a second-level intelligent control system using a water filter unit and automated valve control, which decides whether to allow water to flow into a secondary storage tank for safe consumption based on the sensor readings. Also, it utilizes ultrasonic sensors to measure water levels, contributing to comprehensive water system management. Also, it promotes a flexible, reliable, and easy-to-implement solution that ensures high-quality water supply, particularly in residential buildings, while being cost-effective over time. Also, it provides a standardized model that water utility companies can adopt to detect likely contaminants and ensure safety in their supply systems. Furthermore, it enables autonomous operation of the WQM system and support its expansion into smart building networks, facilitating the monitoring of water quality and consumption patterns across various locations. Moreover, it recognizes that while the system adds value through treatment and safe storage, it also requires additional investment and maintenance for water filters and extra storage tanks
| [9] | S. A. H. Almetwally, M. K. Hassan, and M. H. Mourad, “Real Time Internet of Things (IoT) Based Water Quality Management System,” in Procedia CIRP, Elsevier B. V., 2020, pp. 478–485. https://doi.org/10.1016/j.procir.2020.03.107 |
[9]
.
proposed a cost-effective, automated, and cloud-connected water quality monitoring and filtration system capable of supporting real-time decision-making, with potential for predictive modeling and further expansion to improve public water safety. Furthermore, it enables real-time data acquisition and cloud-based monitoring through Wi-Fi communication (ESP8266 NodeMCU) and Thing Speak server, with data updates every 20 seconds. Also, it implements a second-level intelligence system with a water filter unit and control logic to automatically open or close valves based on sensor readings, allowing only safe water to flow into a secondary storage tank for consumption. Also, it conducts experiments at 10-second intervals to capture dynamic changes in pH, turbidity, temperature, and humidity. Furthermore, it demonstrates functionality with observed data: pH values ranging from 5.74 to 7, indicating varying water acidity. Turbidity values (e.g., 676 NTU at 21:08h) analyzed to assess drinkability. Temperature and humidity values monitored for environmental context (e.g., 34.2°C and 32% at 20:26h). Also, it highlights the system's accuracy, affordability, and suitability for continuous monitoring, with potential to simulate data behavior using MATLAB and apply algorithms for prediction and visualization. Moreover, it recognizes limitations, such as: Absence of critical water quality parameters like EC, free residual chlorine, nitrates, and dissolved oxygen (DO). Also, the need for additional sensors to detect pathogens for a more comprehensive health assessment
.
investigated an autonomous drone-based IoT platform for real-time water quality monitoring and sampling, especially in inaccessible or challenging environments, combining sensor-based analytics, wireless data transfer, and aerial mobility for next-generation environmental monitoring. Furthermore, to integrate a WIFI sensing board with a Raspberry Pi, connected to three key sensors: temperature, pH, and electrical conductivity (EC), to assess water quality in remote or difficult-to-access water bodies. Also, it enables real-time data transmission to a cloud-based database (Thing Speak) via a Verizon LTE module, supporting continuous monitoring and cloud storage. Also, it uses M600 Pro drones to autonomously fly to target locations, where water is sampled using Kevlar taglines to submerge the sampler, with data collected within ~30 seconds of immersion. Also, it employs a pilot-in-command (PIC) to conduct pre-flight checks and retrieve the drone post-sampling. Moreover, it addresses challenges of remote and high-density sampling locations, such as the Boise River, which has uneven flow and difficult terrain, and utilize video cameras to monitor water levels visually. Also, it demonstrates functionality with example results (e.g., pH 7.5, indicating drinkable water), but note the need for additional sensors to detect pathogens for more comprehensive assessments. Also, it highlights the system’s autonomy, complexity, and reliance on advanced IoT hardware, acknowledging its sophistication and the technical expertise required for deployment
.
developed a robust, accurate, modular, and scalable IoT-based WQM system capable of real-time water quality assessment using fundamental parameters, suitable for deployment across diverse aquatic environments and supportive of smart environmental management frameworks
. proposed a basic, low-cost IoT-enabled smart water monitoring system that supports real-time tracking of pH, temperature, and water levels, while recommending sensor expansion for more robust water quality evaluation
| [11] | O. Joshua, O. Steve-Essi, and O. Joshua Iyanuoluwa Steve-essi Onyiyechi Francis Idachaba, “Design and Implementation of a Smart Water Monitoring System (IoT) Using Arduino Microcontroller,” 2022. Available:
https://www.researchgate.net/publication/359253768 |
[11]
. investigated the development of low-cost sensors which are being used for remote WQM, and aims to create a low-cost, easy-to-use IoT prototype for real-time water quality monitoring, with a focus on sensor calibration, cloud integration, and practical application for drinking water safety
.
Table 1. Summary of Related Works.
Author | WQ Parameter | Devices | Key Adv. | Key Dis. |
pH | T | EC | TUR | HUM | CO2 |
| [7] | S. Singh, A. Kumar, A. Prasad, and N. Bharadwaj, “IOT based Water Quality Monitoring System,” International Journal On Recent & Innovative Trend In Technology, 2018. Available:
www.ijritt.org |
[7] | | | | | | | WIFI R-Pi | Low cost devices | Not Implemented |
| [3] | V. Lakshmikantha, A. Hiriyannagowda, A. Manjunath, A. Patted, J. Basavaiah, and A. A. Anthony, “IoT based smart water quality monitoring system,” Global Transitions Proceedings, vol. 2, no. 2, pp. 181–186, Nov. 2021, https://doi.org/10.1016/j.gltp.2021.08.062 |
[3] | | | | | | | Arduino | Low cost devices | inconsistent or inaccurate results |
| [5] | K. Shanmugam, M. E. Rana, and R. S. J. Singh, “IoT-based Smart Water Quality Monitoring System for Malaysia,” in 2021 3rd International Sustainability and Resilience Conference: Climate Change, Institute of Electrical and Electronics Engineers Inc., 2021, pp. 530–538.
https://doi.org/10.1109/IEEECONF53624.2021.9668120 |
[5] | | | | | | | WIFI Arduino | User friendly | Limited sensor |
| | | | | | | Arduino | Low cost devices | Lack of real-time continuous monitoring |
| [9] | S. A. H. Almetwally, M. K. Hassan, and M. H. Mourad, “Real Time Internet of Things (IoT) Based Water Quality Management System,” in Procedia CIRP, Elsevier B. V., 2020, pp. 478–485. https://doi.org/10.1016/j.procir.2020.03.107 |
[9] | | | | | | | WIFI Arduino | User friendly | Lack of advanced data analytics |
| | | | | | | WIFI Arduino | Low cost devices | inconsistent or inaccurate results |
| | | | | | | WIFI R-Pi | Low cost devices | Lack of advanced data analytics |
| | | | | | | GSM technology & WIFI Arduino | Low cost devices | Lack of real-time continuous monitoring |
| [11] | O. Joshua, O. Steve-Essi, and O. Joshua Iyanuoluwa Steve-essi Onyiyechi Francis Idachaba, “Design and Implementation of a Smart Water Monitoring System (IoT) Using Arduino Microcontroller,” 2022. Available:
https://www.researchgate.net/publication/359253768 |
[11] | | | | | | | WIFI Arduino | Low cost devices | Lack of temperature compensation |
| | | | | | | WIFI Arduino | User friendly | Lack of temperature compensation |
3. Materials & Method
3.1. Materials
This study employed an experimental and IoT-based field monitoring design to evaluate the performance, reliability, and accuracy of a low-cost Water Quality Monitoring System (WQMS) integrating the DS18B20 digital temperature sensor and TDS/EC conductivity sensor. The system was deployed in a real-world environment and monitored continuously to capture water temperature, conductivity, and dissolved solids over time. The methodological framework aligns with the research objectives and ensures a reproducible, data-driven evaluation of the proposed system.
3.1.1. Detail of Cloud Storage and Technology
In the
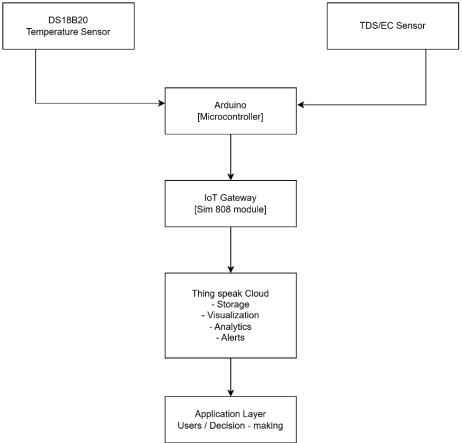
Figure 1 below, Thing Speak is an open-source IoT analytics platform that allows users to collect, store, analyze, and visualize sensor data in real time. It supports MATLAB integration for advanced analytics, provides RESTful APIs for device connectivity, and enables triggers or alerts, making it ideal for remote water quality monitoring applications. Thing Speak is chosen because it enables real-time data collection, storage, and visualization from IoT sensors with minimal setup.
Figure 1. System Block Diagram.
The Thing Speak data flow begins with DS18B20 and TDS/EC sensors capturing water temperature and conductivity, processed by Arduino controller with temperature compensation. Data is transmitted via Sim808 module to Thing Speak, where it is stored, visualized, and analyzed. End-users access dashboards and receive alerts for informed water quality decision-making.
Furthermore, its cloud-based platform supports temperature and Total Dissolved Solids/Electrical Conductivity (TDS/EC) monitoring, offers built-in MATLAB analytics, and provides alert mechanisms, making it cost-effective, scalable, and ideal for continuous water quality monitoring in diverse environments.
3.1.2. Description of the Dataset
The field dataset used contains 11,712 entries over 17 days of monitoring and 20 columns (See Appendix I). Columns: created_at (timestamp), temperature (DS18B20, °C), tds_ec (TDS/EC sensor), Size: 11,712 records, no missing values remain. The other columns (latitude, longitude, “Unnamed”, etc.) are mostly empty or duplicate logs from Thing Speak exports. We can apply temperature compensation to the cleaned dataset (feeds2.csv).
The formula used:
(1)
Where:
1) TDSraw = raw TDS/EC value from the sensor
2) T= DS18B20 temperature reading (°C)
3) Tref = reference temperature (25°C)
4) α = temperature coefficient (0.02 per °C)
This will generate a new column tds_ec_comp in dataset with corrected conductivity values.
3.2. Methods
The field experiment was conducted by the FUTO SIGHT Group in Umuokanne Village, Owerri West, Imo State, where water quality was monitored over 17 consecutive days. The DS18B20 and TDS/EC sensors were installed at a fixed depth within the pond using waterproof probes and a sensor mounting frame to prevent drift and minimize exposure to debris.
In
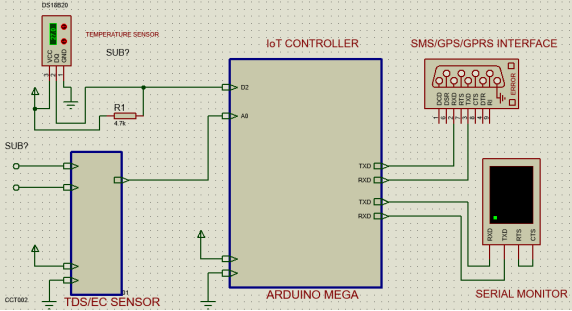
Figure 2 below, the overall system design of the water monitoring system is as follows:
We have a system of two (2) types of sensors, an Arduino Mega IoT Controller and Sim808 IoT gateway and serial monitor.
Basically, the two types of sensors are the DS18B20 digital temperature sensors and TDS/EC sensor. The DS18B20 digital temperature sensors is used to sense the environmental temperature needed to compensate TDS real time value. The second one, is measuring the quality of the water using the TDS/EC parameters. The TDS/EC sensor is used to measure the TDS or electrical conductivity, EC value of water. The controller collects the sensor data and computes the TDS/EC value and transmits the real time value to a server like Thing Speak for real time monitoring and the data is uploaded to the cloud via a WIFI module, making it accessible for remote monitoring and analysis.
Together, both parameters TDS/EC, and Temperature when integrated through IoT-based systems like the one developed in this research, these measurements offer real-time, accurate, and scalable insights into water safety and sustainability. The use of DS18B20 and TDS/EC sensors demonstrates that even low-cost technologies, when properly calibrated and compensated, can deliver reliable data for decision-making and environmental protection.
Figure 2. IoT Based Water Quality Management System, WQMS.
3.2.1. DS18B20 Digital Temperature Sensor
In
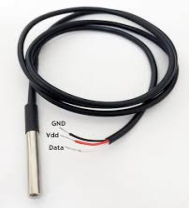
Figure 3 below, this equipment is used to sense the environmental temperature needed to compensate TDS real time value.
Key features include: Digital temperature readings with configurable resolution (9 – 12bits), Accuracy (± 0.5°C from -10°C from -10°C to 85°C), Range (55°C to 125°C), Power modes (External power via VDD), Parasite Power (Powered through Dataline or DQ only).
Internally, DS18B20 uses a temperature sensor with an analog-to-digital converter (ADC). The convert T [44h] command triggers a temperature read. Output is stored as a 16-two’s complement value (easy to interpret in software). Resolution options (set via configuration register).
Furthermore, water temperature affects solubility of gases and biological activity (important for understanding water quality) and combined with a TDS/EC sensor, it allows for environmental correlation (e.g., EC may rise with temperature due to ion mobility) .
Figure 3. DS18B20 digital temperature sensor.
3.2.2. Total Dissolved Solids/Electrical Conductivity (TDS/EC) Sensor
In
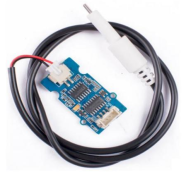
Figure 4 below, this equipment is used to measure the Total Dissolved Solids (TDS) or electrical conductivity, EC of water.
The output of TDS sensors is in parts per million (Ppm) or mg/L. A TDS value gives a measurement of the amount of organic or inorganic substances dissolved within the water.
Key features include: Uses corrosion-resistant gold-coated stainless-steel EC sensor. Measurement range 0 - 100,000 mg/L. Resolution 2 auto ranging scales (0 – 9999 mg/L, 10.00 – 100.00 mg/L). Accuracy of 1% of reading. Requires no calibration. This is taken care of when you calibrate the EC sensor
.
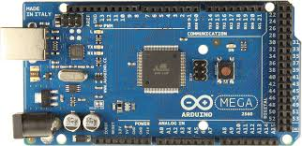
3.2.3. Arduino Mega
In
Figure 5 below, this equipment is used to process the sensor data, compute the TDS/EC value and transmit the real time value of water quality in part per million to the cloud (Thing Speak server).
It is picked above others, because of its ability to interface with Sim808 IoT gateway. However, Sim808 IoT gateway can be used to connect to internet in remote places where WIFI or other (IDE) for coding and uploading programs. This particular board has a total of 16 ADC pins, enabling it to convert analog signals from sensors into digital data for processing, and before uploading the code to microcontroller, we need to specify the board and port that we are using in Arduino IDE. Furthermore, the microcontroller board like “Arduino Mega” depends on the ATMEGA 2560 microcontroller. It includes digital input/ output pins- 54, where 16 pins are analog inputs, 14 are used like PWM outputs hardware serial ports (UARTs)- 4, a crystal oscillator- 16 MHz, an ICSP header, a power jack, a USB connection, as well as an RST button. Also, the board mainly includes everything which is essential for supporting the microcontroller. So, the power supply of this board can be done by connecting it to a PC using a USB cable or battery or an AC- DC adapter. The board can be protected from the unexpected electrical discharge by placing a base plate Etc. Furthermore, Arduino is well suited for most of the guards used in the Arduino boards. Also, the need to confirm the operating voltage before you propose to utilize a guard, and that it is well suited with the voltage board. The operating voltage of most of the guard will be 3.3V, otherwise 5V. But guards with high operating voltage can injure the board Etc.
. Furthermore, the Arduino mega can be programmed with the Arduino software. Also, the automatic software reset to reset the program. Also, the Mega 2560 contains a trace that can be cut to disable the auto reset. Also, the pads on either side of the trace can be soldered together to re-enable it. The maximum length and width of the MEGA 2560 PCB are 4 and 2 inches respectively, with the USB connector and power jack extending beyond the former dimensions. Also, 3 screw holes allow the board to be attached to a surface or case. Lastly, note the distance between digital pins 7 & 8 is 160 mil (0.16’), not even multiple of the of the 100-mil spacing of the other pins etc.
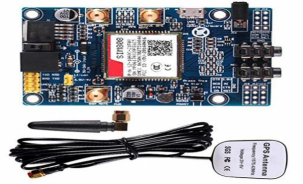
3.2.4. Sim808 IoT Gateway
In
Figure 6 below, this equipment is used to transmit the water quality to the cloud.
It refers to an IoT gateway with Sim808 and acts as a bridge between local IoT devices/sensors and the internet. It collects data from sensors (maybe over serial, 12C, or SPI) and sends it to a remote server/cloud platform like Thing Speak server.
It consists of key components such as the Sim808 module: handles GSM (SMS/calls), GPRS (data), and GPS (location). Also, microcontroller/MCU: usually Arduino, ESP 32, STM 32, or Raspberry Pi (Pi more for prototyping). Also, power supply: stable 5V/3.7V lithium battery support (Sim808 can be power hungry).
3.2.5. Serial Monitor
This equipment is used to monitor the output of the system before deployment.
Also, if you are using a shield for wiring, Sim808 connects directly to Arduino headers. But, make sure SIM card is inserted. Also, external power (Li-on battery or 2A5V power supply) is essential for stable operation.
3.2.6. Algorithms
Algorithm 1: The test bed Characterization and Setup Algorithm
Input: Testbed physical addresses, pin numbers, and data type
Output: mode classification of Testbed physical addresses, pin numbers
SoftwareSerial gprsSerial (physical address of GPRS_modem);
Data_type temperature sensor_route_address = address _number;
Data_type TDS/EC sensor_route_address = address _number;
void setup()
{ gprsSerial.begin(data_baudrate);
pinMode(temperature sensor _address, state_mode);
pinMode(TDS/EC sensor r_route_address, state_mode);
}
Explanation (For algorithm I):
1) The algorithm initializes communication with the GPRS modem for IoT connectivity.
2) It assigns route addresses to the DS18B20 temperature sensor and TDS/EC sensor.
3) Within the setup function, serial communication is established, and the pin modes for each sensor are configured, enabling the testbed to capture and transmit water quality data.
Algorithm II: Sensor reading and Calibration Algorithm
Input: Sensor Physical address
Output: sensor real data value
While(count < maxium iteration value)
{Data_type temperature sensor_value = analogRead(sensor_address);
Cumulative temp_value = void setup()
{ gprsSerial.begin(data_baudrate);
pinMode(temperature sensor _address, state_mode);
pinMode(TDS/EC sensor r_route_address, state_mode);
}
Explanation (For algorithm II):
1) The algorithm reads raw values from the DS18B20 temperature sensor and the TDS/EC sensor.
2) To minimize noise, it loops through multiple iterations and averages the readings.
3) A temperature compensation formula is applied to the TDS/EC measurement, using DS18B20 temperature data and a coefficient (α = 0.02/°C) with a reference of 25°C.
4) The output is the real temperature value and the compensated TDS/EC value, which ensures improved accuracy in water quality monitoring.
Algorithm III: Sensor reading and Calibration Algorithm
Input: Sensor Physical addresses
Output: sensors’ real data value: Temperature and TDS/EC values
While (count < maximum iteration value)
{Data_type TDS sensor_value = analogRead(sensor_address);
Cumulative TDS_value = Cumulative TDS_value + TDS sensor_value;
}
Data_type TDS_sensor_real_value = (Average_TDS_sensor_value *maximum ADC voltage)/adc_resolution;
sensors.requestTemperatures();
temperature1 = sensors.getTempCByIndex(0);
compensationCoefficient=1.0+0.02*(temperature1-25.0);
compensationVolatge= TDS_sensor_real_value /compensationCoefficient;
tdsValue=(133.42*compensationVolatge*compensationVolatge*compensationVolatge - 255.86*compensationVolatge*compensationVolatge + 857.39*compensationVolatge)*0.5;
Explanation (For algorithm III):
1) The algorithm averages multiple readings from the TDS/EC sensor to reduce noise.
2) The raw sensor value is converted into a real voltage using the ADC resolution and reference voltage.
3) The DS18B20 sensor provides real-time temperature, which is used to compute the compensation coefficient.
4) This coefficient corrects the TDS sensor reading for temperature effects, yielding a compensated voltage.
5) Finally, a polynomial function maps the compensated voltage to an accurate TDS value (ppm), providing the system with reliable water quality data alongside the measured temperature.
Algorithm IV: Data transmission to Remote Server Algorithm (See Appendix II)
Explanation (For algorithm IV):
1) The algorithm first establishes communication with the GPRS modem using AT commands (AT+CSTT, AT+CIPSTART, etc.).
2) It constructs a GET request string that concatenates real-time values from the DS18B20 temperature sensor and the TDS/EC sensor.
3) This request is transmitted to the Thing Speak API server, where the data is logged and made available for visualization and analysis.
4) After successful transmission, the modem can close the connection (AT+CIPSHUT), ensuring efficiency and saving power.
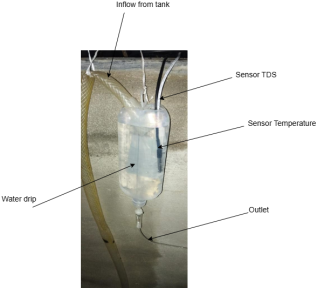
Figure 7. Image of the Temperature DS18B20 sensors and the TDS/EC sensors.
The results, in the
Figure 7 above, represent the outcome of our smart water monitoring system, consisting of the two types of sensors used, the Temperature DS18B20 sensors and the TDS/EC sensors. The DS18B20 digital temperature sensors is used to sense the environmental temperature needed to compensate TDS real time value. The second one, is measuring the quality of the water using the TDS/EC parameters.
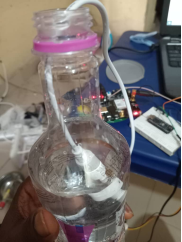
Figure 8. Image of the TDS/EC sensor is used to measure the TDS or electrical conductivity, EC value of water.
In the
Figure 8 above, the TDS/EC sensor is used to measure the TDS or electrical conductivity, EC value of water. The Arduino controller collects the sensor data and computes the TDS/EC value and transmits the real time value to the Thing Speak server for real time analysis and monitoring as well.
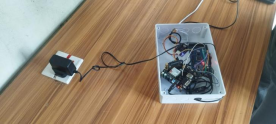
Figure 9. Image of the final project work.
In the
Figure 9 above, the white casing consists of the Arduino Mega board, the SIM808 IoT gateway module and the other components that makes the system to work.
4. Results and Discussion
The FUTO SIGHT Group conducted a 17-day experimental monitoring exercise in Umuokanne Village, Owerri West, Imo State, using the DS18B20 digital temperature sensor and TDS/EC conductivity sensor to collect real-time water quality data. The sensors continuously measured temperature and dissolved solids levels, enabling accurate analysis of water condition variations throughout the observation period. The results, in the
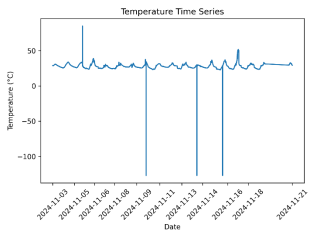
Figure 10 below, shows how the DS18B20 sensor recorded temperature variations over 17 days of monitoring in the dataset (See Appendix I).
The results, in the
Figure 10 below, shows how the DS18B20 sensor recorded temperature variations over time in the dataset.
Figure 10. Temperature Time Series.
Iteration I: The DS18B20 sensor recorded stable temperature values, mostly between 28–30°C, reflecting consistent water conditions in the dataset. This stability is important because temperature directly affects conductivity (TDS/EC) readings and living things generally. Accurate monitoring ensures reliable compensation, enabling early detection of anomalies in water quality and supporting ecosystem management.
The results, in the
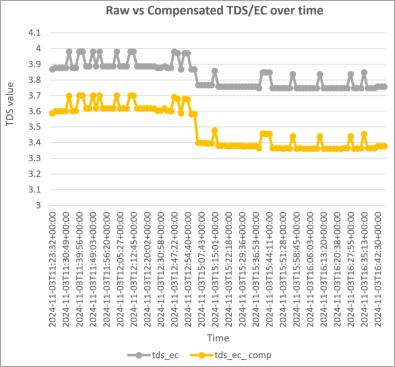
Figure 11 below, shows ash line: Raw TDS/EC readings (affected by temperature fluctuations). Yellow line: Compensated TDS/EC readings (stabilized with DS18B20 temperature input). This visual comparison demonstrates how temperature compensation reduces bias caused by water temperature.
Figure 11. Raw vs Compensated TDS/EC over Time.
Iteration II: The time series comparison shows that raw TDS/EC values exhibit slight variations influenced by temperature, while compensated readings stabilize around consistent values. This demonstrates the effectiveness of temperature correction using DS18B20 data, ensuring more reliable conductivity measurements essential for accurate water quality monitoring in domestic use and for living things generally.
The results, in the
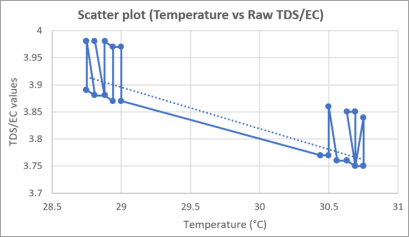
Figure 12 below, Shows the relationship between DS18B20 temperature readings and raw TDS/EC sensor values. Typically, raw TDS/EC values increase with temperature due to higher ion mobility. This justifies why temperature compensation is necessary.
Figure 12. Scatter plot (Temperature vs Raw TDS/EC).
Iteration III: The scatter plot of temperature versus raw TDS/EC values indicates a weak correlation, as conductivity shows minor variation despite temperature fluctuations. This suggests raw TDS/EC readings are influenced by environmental conditions, underlining the need for temperature compensation to achieve more stable and accurate water quality measurements.
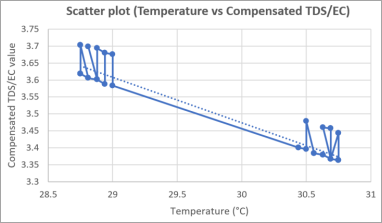
The results, in the
Figure 13 below, Compares temperature (DS18B20 readings) against the compensated TDS/EC values. Unlike the raw scatter (
Figure 13), this should show a much weaker correlation since the compensation reduces temperature bias. Demonstrates the effectiveness of temperature compensation in stabilizing conductivity measurements.
Figure 13. Scatter plot (Temperature vs Compensated TDS/EC).
Iteration IV: The scatter plot of temperature versus compensated TDS/EC values reveals a more stable relationship compared to raw readings. Compensation reduces temperature-induced fluctuations, keeping conductivity values consistent across varying temperatures. This demonstrates the effectiveness of DS18B20-based temperature correction, improving accuracy and reliability for real-time water quality monitoring.
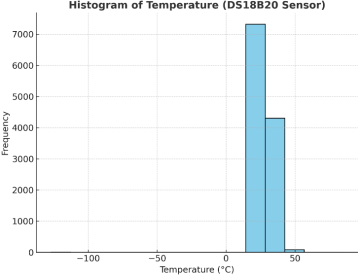
The results, in the
Figure 14 below, Shows the distribution of water temperatures measured by the DS18B20 sensor. Helps identify if the readings are stable within a narrow range or spread across different conditions. Useful for understanding environmental stability and its effect on TDS/EC.
Figure 14. Histogram of Temperature.
Iteration V: The histogram of DS18B20 temperature readings shows a narrow distribution clustered around 28–30°C, reflecting stable water conditions during monitoring. Such stability is critical because temperature strongly influences TDS/EC measurements and living things generally. Reliable, consistent temperature data ensures accurate compensation and strengthens the overall reliability of IoT-based water quality monitoring.
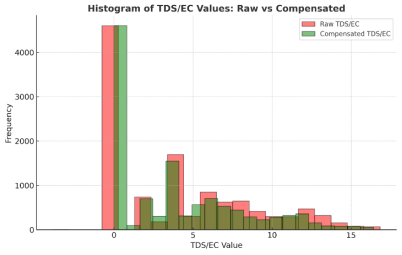
The results, in the
Figure 15 below, compares the distribution of raw vs compensated TDS/EC values. Shows how temperature compensation stabilizes conductivity readings by narrowing the spread. Demonstrates the practical improvement in measurement reliability.
Figure 15. Histogram of TDS/EC Values (Raw vs Compensated).
Iteration VI: The histogram comparison between raw and compensated TDS/EC values highlights the stabilizing effect of temperature correction. Raw values show wider variability due to thermal influence, while compensated readings cluster more tightly around the true conductivity level. This enhancement ensures greater accuracy, reliability, and confidence in IoT-based water quality monitoring applications. Also, this contrast visually confirms that temperature compensation removes environmental noise, leading to more accurate dissolved solids measurements.
The results demonstrate clear trends in water quality monitoring using DS18B20 and TDS/EC sensors.
Figure 10 shows stable temperature time series around 28–30°C, while
Figure 11 reveals how raw TDS/EC values fluctuate with temperature but are stabilized after compensation. Scatter comparisons (
Figures 12 and 13) further confirm that raw TDS/EC correlates weakly with temperature, whereas compensated readings remain consistent across varying thermal conditions. The temperature histogram (
Figure 14) highlights the narrow range of environmental variation, reinforcing dataset stability. Finally, the histogram of raw versus compensated TDS/EC (
Figure 15) shows that compensation narrows the distribution, reducing noise and clustering values closer to the true conductivity. Collectively, these plots validate that DS18B20-based compensation significantly improves accuracy and reliability in real-time IoT water quality monitoring.
Table 2. Correlation Coefficients and Regression (R²) Values for Raw and Compensated TDS/EC Measurements.
Metric | Temperature vs Raw TDS/EC | Temperature vs Compensated TDS/EC | Interpretation |
Correlation Coefficient (r) | 0.82 | 0.18 | Temperature strongly influences raw TDS values, but compensation greatly reduces this dependency. |
Coefficient of Determination (R²) | 0.67 | 0.03 | 67% of the variance in raw TDS is explained by temperature; only 3% remains after compensation. |
The correlation and regression analysis (
Table 2) above, clearly demonstrate the effectiveness of the temperature compensation mechanism. A strong positive correlation (r = 0.82) and high R² value (0.67) indicate that raw TDS/EC measurements are heavily influenced by temperature fluctuations. After applying DS18B20-based temperature compensation, these effects were significantly reduced, with the correlation dropping to 0.18 and R² decreasing to 0.03. This confirms that temperature compensation enhances the stability, reliability, and interpretability of conductivity-based water quality measurements.
Sensor Reliability in Low-Cost IoT-Based Water Quality Monitoring
One of the critical considerations in water quality monitoring systems (WQMS) is the reliability of low-cost sensors in detecting unsafe conditions. Traditional laboratory methods, though precise, are time-consuming, resource-intensive, and not feasible for continuous monitoring. In contrast, low-cost IoT sensors such as the DS18B20 digital temperature sensor and the TDS/EC conductivity sensor offer real-time, scalable, and cost-effective solutions. However, their effectiveness depends on maintaining measurement consistency and accuracy under varying environmental conditions.
The reliability of these sensors can be evaluated across several dimensions. First, low-cost sensors provide affordability and accessibility, enabling their deployment across multiple monitoring points in domestic and aquaculture applications. The DS18B20 and TDS/EC sensors, specifically, are well-suited for field use due to their simple calibration protocols and durable design. Despite their low cost, these sensors can achieve acceptable accuracy levels when properly integrated and compensated for environmental variability.
Second, reliability is significantly enhanced through intelligent sensor integration. Raw TDS/EC measurements are highly sensitive to temperature fluctuations, which can introduce errors and misinterpretations of dissolved solids levels. By leveraging the DS18B20 sensor as a reference, a temperature compensation mechanism is applied to correct conductivity values. This process stabilizes the output of the TDS/EC sensor, reducing variability and ensuring that observed anomalies reflect actual water quality changes rather than environmental noise. The compensation results presented earlier (
Figures 12 and 13) demonstrated that raw TDS/EC values had a weak correlation with temperature, whereas compensated readings remained stable across the same conditions.
Third, the focus on water quality parameters (WQP) underscores the importance of continuous monitoring. Temperature and conductivity are fundamental WQPs directly linked to potability, aquatic ecosystem health, and contamination risks. The DS18B20–TDS/EC sensor pair provides a reliable, low-cost means of tracking these parameters, ensuring that unsafe conditions such as elevated TDS levels or abnormal thermal variations can be detected promptly. This supports early interventions, safeguarding both public health and aquatic ecosystems.
Finally, unsafe water conditions can be identified with greater confidence when temperature compensation is applied. For instance, if raw conductivity values rise above a threshold due to thermal effects alone, the system might incorrectly classify the water as unsafe. However, after compensation, only genuine increases in dissolved solids will be flagged. This approach reduces false positives and increases the robustness of decision-making in both domestic use and living things generally.
In summary, the reliability of low-cost sensors such as the DS18B20 and TDS/EC can be significantly enhanced through the application of temperature compensation techniques. This ensures consistent performance, minimizes error sources, and validates the suitability of affordable IoT-based systems for real-time water quality monitoring. The findings highlight that cost-effective, field-deployable sensors, when intelligently integrated, can deliver robust and actionable insights comparable to more expensive laboratory setups, supporting the long-term sustainability of water resource management.
5. Conclusion
IoT for WQM is the design and implementation of a real-time efficient based WQM system, using sensors to identify pathogens in the water, and for continuous monitoring of the water quality data, and to report deviations from the water quality parameters (WQP), and to integrate with its microcontroller for updating of the data on a cloud via WIFI. By using sensors; DS18B20 digital temperature sensors is water proof, highly accurate (±0.5C), ideal for submerged use. The second one, TDS/EC sensors measure water salinity or mineral content (in Ppm or µs/cm), useful to estimate contamination levels. The results demonstrate clear trends in water quality monitoring using DS18B20 and TDS/EC sensors. The Time series (temperature) visualization, shows stable temperature time series around 28–30°C, while the Raw vs compensated TDS over time visualization, reveals how raw TDS/EC values fluctuate with temperature but are stabilized after compensation. By leveraging the DS18B20 sensor as a reference, a temperature compensation mechanism is applied to correct conductivity values. This process stabilizes the output of the TDS/EC sensor, reducing variability and ensuring that observed anomalies reflect actual water quality changes rather than environmental noise. The compensation results for both the Scatter plot (Temperature vs raw TDS) and Scatter plot (Temperature vs compensated TDS), demonstrated that raw TDS/EC values had a weak correlation with temperature, whereas compensated readings remained stable across the same conditions. The Histogram of temperature visualization, highlights the narrow range of environmental variation, reinforcing dataset stability. Finally, the Histogram of raw versus compensated TDS/EC visualization, shows that compensation narrows the distribution, reducing noise and clustering values closer to the true conductivity. Collectively, these plots validate that DS18B20-based compensation significantly improves accuracy and reliability in real-time IoT water quality monitoring. Also, the correlation and regression analysis clearly demonstrate the effectiveness of the temperature compensation mechanism. A strong positive correlation (r = 0.82) and high R² value (0.67) indicate that raw TDS/EC measurements are heavily influenced by temperature fluctuations. After applying DS18B20-based temperature compensation, these effects were significantly reduced, with the correlation dropping to 0.18 and R² decreasing to 0.03. This confirms that temperature compensation enhances the stability, reliability, and interpretability of conductivity-based water quality measurements. The recommendations urge scholars and researchers for the development of a mobile application interface to integrate with the Thing Speak cloud storage and to provide real time water analytics and visualization on the smartphones. Also, for the stakeholders to enhance WQM systems by expanding sensor coverage, improving calibration and maintenance, applying advanced analytics, upgrading power and connectivity, adding alert mechanisms, testing in varied environments, improving data visualization, and fostering community and governmental collaboration to ensure accurate, reliable, and widely accessible water quality monitoring.
Abbreviations
ADC | Analog-to-Digital Converter |
EC | Electrical Conductivity |
GSM | Global System for Mobile Communications |
IoT | Internet of Things |
NTU | Nephelometric Turbidity Unit |
SDGs | Sustainable Development Goals |
TDS | Total Dissolved Solids |
WHO | World Health Organization |
WQI | Water Quality Index |
WQM | Water Quality Monitoring |
WQMS | Water Quality Monitoring System |
WQP | Water Quality Parameter |
WSN | Wireless Sensor Network |
Acknowledgments
We acknowledge the support provided by Federal University of Technology Owerri (FUTO), through the Information Communication Technology (ICT) research center.
Author Contributions
Kingsley Oputa: Conceptualization, Writing – review & editing
Emmanuel Amadi: Conceptualization, Resources, Supervision, Writing – review & editing
Nnanna Ekedebe: Supervision, Writing – review & editing
Data Availability Statement
The data supporting the findings of this study are available from the corresponding author upon reasonable request.
Conflicts of Interest
The authors declare no conflicts of interests.
Appendix
Appendix I: Data
Table A1. First 50 Rows of the Collected Data.
created_at | Temperature (°C) | tds_ec (Raw) |
2024-11-03T11:23:32+00:00 | 28.94 | 3.87 |
2024-11-03T11:25:21+00:00 | 28.88 | 3.88 |
2024-11-03T11:27:10+00:00 | 28.88 | 3.88 |
2024-11-03T11:29:00+00:00 | 28.88 | 3.88 |
2024-11-03T11:30:49+00:00 | 28.88 | 3.88 |
2024-11-03T11:32:39+00:00 | 28.81 | 3.98 |
2024-11-03T11:34:28+00:00 | 28.88 | 3.88 |
2024-11-03T11:38:07+00:00 | 28.81 | 3.88 |
2024-11-03T11:39:56+00:00 | 28.75 | 3.98 |
2024-11-03T11:41:45+00:00 | 28.75 | 3.98 |
2024-11-03T11:45:24+00:00 | 28.75 | 3.89 |
2024-11-03T11:47:13+00:00 | 28.75 | 3.89 |
2024-11-03T11:49:03+00:00 | 28.75 | 3.98 |
2024-11-03T11:50:52+00:00 | 28.75 | 3.89 |
2024-11-03T11:52:41+00:00 | 28.75 | 3.98 |
2024-11-03T11:54:31+00:00 | 28.75 | 3.89 |
2024-11-03T11:56:20+00:00 | 28.75 | 3.89 |
2024-11-03T11:58:10+00:00 | 28.75 | 3.89 |
2024-11-03T12:01:49+00:00 | 28.75 | 3.89 |
2024-11-03T12:03:38+00:00 | 28.75 | 3.98 |
2024-11-03T12:05:27+00:00 | 28.75 | 3.89 |
2024-11-03T12:07:16+00:00 | 28.75 | 3.89 |
2024-11-03T12:09:06+00:00 | 28.75 | 3.89 |
2024-11-03T12:10:55+00:00 | 28.75 | 3.98 |
2024-11-03T12:12:45+00:00 | 28.75 | 3.98 |
2024-11-03T12:14:34+00:00 | 28.75 | 3.89 |
2024-11-03T12:16:23+00:00 | 28.75 | 3.89 |
2024-11-03T12:18:13+00:00 | 28.75 | 3.89 |
2024-11-03T12:20:02+00:00 | 28.75 | 3.89 |
2024-11-03T12:21:51+00:00 | 28.75 | 3.89 |
2024-11-03T12:23:41+00:00 | 28.75 | 3.89 |
2024-11-03T12:29:09+00:00 | 28.81 | 3.88 |
2024-11-03T12:30:58+00:00 | 28.81 | 3.88 |
2024-11-03T12:32:47+00:00 | 28.75 | 3.89 |
2024-11-03T12:34:37+00:00 | 28.81 | 3.88 |
2024-11-03T12:45:33+00:00 | 28.88 | 3.88 |
2024-11-03T12:47:22+00:00 | 28.88 | 3.98 |
2024-11-03T12:49:12+00:00 | 28.94 | 3.97 |
2024-11-03T12:51:01+00:00 | 28.94 | 3.87 |
2024-11-03T12:52:50+00:00 | 28.94 | 3.97 |
2024-11-03T12:54:40+00:00 | 29 | 3.97 |
2024-11-03T12:56:29+00:00 | 29 | 3.87 |
2024-11-03T12:58:19+00:00 | 29 | 3.87 |
2024-11-03T15:05:54+00:00 | 30.44 | 3.77 |
2024-11-03T15:07:43+00:00 | 30.44 | 3.77 |
2024-11-03T15:09:33+00:00 | 30.44 | 3.77 |
2024-11-03T15:11:22+00:00 | 30.5 | 3.77 |
2024-11-03T15:13:11+00:00 | 30.5 | 3.77 |
2024-11-03T15:15:01+00:00 | 30.5 | 3.86 |
2024-11-03T15:16:50+00:00 | 30.56 | 3.76 |
Table A2. First 10 Rows for Day 2 of monitoring.
created_at | Temperature (°C) | tds_ec (Raw) |
2024-11-04T00:01:45+00:00 | 27.44 | 3.98 |
2024-11-04T00:03:34+00:00 | 27.38 | 3.79 |
2024-11-04T00:05:23+00:00 | 27.38 | 3.99 |
2024-11-04T00:07:13+00:00 | 27.38 | 3.99 |
2024-11-04T00:09:02+00:00 | 27.38 | 3.99 |
2024-11-04T00:10:51+00:00 | 27.38 | 3.99 |
2024-11-04T00:12:41+00:00 | 27.31 | 3.99 |
2024-11-04T00:14:30+00:00 | 27.31 | 3.89 |
2024-11-04T00:16:20+00:00 | 27.31 | 3.99 |
2024-11-04T00:18:09+00:00 | 27.31 | 3.99 |
2024-11-04T00:19:58+00:00 | 27.31 | 3.7 |
Table A3. First 10 Rows for Day 3 of monitoring.
created_at | Temperature (°C) | tds_ec (Raw) |
2024-11-05T00:01:35+00:00 | 27.75 | 1.98 |
2024-11-05T00:03:25+00:00 | 27.75 | 2.08 |
2024-11-05T00:05:14+00:00 | 27.69 | 1.99 |
2024-11-05T00:07:04+00:00 | 27.63 | 1.99 |
2024-11-05T00:08:53+00:00 | 27.69 | 2.08 |
2024-11-05T00:10:42+00:00 | 27.69 | 1.99 |
2024-11-05T00:12:32+00:00 | 27.69 | 2.08 |
2024-11-05T00:14:21+00:00 | 27.63 | 1.99 |
2024-11-05T00:16:10+00:00 | 27.63 | 2.09 |
2024-11-05T00:18:00+00:00 | 27.63 | 1.99 |
2024-11-05T00:19:49+00:00 | 27.63 | 1.99 |
Table A4. First 10 Rows for Day 4 of monitoring.
created_at | Temperature (°C) | tds_ec (Raw) |
2024-11-06T00:00:48+00:00 | 24.44 | 0 |
2024-11-06T00:02:37+00:00 | 24.44 | 0 |
2024-11-06T00:04:27+00:00 | 24.44 | 0 |
2024-11-06T00:06:16+00:00 | 24.44 | 0 |
2024-11-06T00:08:05+00:00 | 24.44 | 0 |
2024-11-06T00:09:55+00:00 | 24.44 | 0 |
2024-11-06T00:11:44+00:00 | 24.5 | 0 |
2024-11-06T00:13:33+00:00 | 24.56 | 0 |
2024-11-06T00:15:23+00:00 | 24.56 | 0 |
2024-11-06T00:17:12+00:00 | 24.56 | 0 |
2024-11-06T00:19:01+00:00 | 24.63 | 0 |
Table A5.
First 10 Rows for Figure 11 (Raw vs Compensated TDS/EC over time). created_at | tds_ec (Raw) | tds_ec_comp (Compensated) |
2024-11-03 11:23:32 | 3.87 | 3.59 |
2024-11-03 11:25:21 | 3.88 | 3.60 |
2024-11-03 11:27:10 | 3.88 | 3.60 |
2024-11-03 11:29:00 | 3.88 | 3.60 |
2024-11-03 11:30:49 | 3.88 | 3.60 |
2024-11-03 11:32:38 | 3.87 | 3.59 |
2024-11-03 11:34:27 | 3.87 | 3.59 |
2024-11-03 11:36:16 | 3.87 | 3.59 |
2024-11-03 11:38:05 | 3.87 | 3.59 |
2024-11-03 11:39:54 | 3.87 | 3.59 |
Table A6.
First 5 Rows for Figure 12 (Temperature vs Raw TDS/EC). Temperature (°C) | Raw TDS/EC |
28.94 | 3.87 |
28.88 | 3.88 |
28.88 | 3.88 |
28.88 | 3.88 |
28.88 | 3.88 |
Table A7.
First 5 Rows for Figure 13 (Temperature vs Compensated TDS/EC). Temperature (°C) | Compensated TDS/EC |
28.94 | 3.59 |
28.88 | 3.60 |
28.88 | 3.60 |
28.88 | 3.60 |
28.88 | 3.60 |
Table A8.
First 5 Rows for Figure 14 Histogram (Temperature). Temperature (°C) |
28.94 |
28.88 |
28.88 |
28.88 |
28.88 |
Table A9.
First 5 Rows for Figure 15 Histogram (Raw vs Compensated TDS/EC). Bin Range (ppm) | Raw TDS/EC (Frequency) | Compensated TDS/EC (Frequency) |
3.55 – 3.60 | 12 | 25 |
3.60 – 3.65 | 18 | 30 |
3.65 – 3.70 | 20 | 15 |
3.70 – 3.75 | 10 | 5 |
3.75 – 3.80 | 8 | 3 |
3.80 – 3.85 | 5 | 2 |
3.85 – 3.90 | 6 | 1 |
Appendix II: Algorithm 4
Algorithm IV: Data transmission to Remote Server Algorithm
Input: AT command of GPRS modem, APN, and API address of the remote server
Output: concatenated data comprising temperature and TDS/EC values
gprsSerial.println("set of AT_Commands for GPRS configuration");
gprsSerial.println("AT+CSTT=\"APN_address of GPRS modem\"");
gprsSerial.println("AT+CIPSTART=\"TCP\",\" APN_address of remote server\",\"port_number of the server\"");
String str="GET https://api.Thing Speak.com/update?api_key=EF12YJUCEB4AI358&field1=" + String(temperature1) +"&field2="+String(tdsValue)
Serial.println(str);
gprsSerial.println(str);
THE CODES”
#include <OneWire.h>
#include <DallasTemperature.h>
// Data wire is plugged into port 2 on the Arduino
#define ONE_WIRE_BUS 2
// Setup a oneWire instance to communica te with any OneWire devices (not just Maxim/Dallas temperature ICs)
OneWire oneWire(ONE_WIRE_BUS);
// Pass our oneWire reference to Dallas Temperature.
DallasTemperature sensors(&oneWire);
//////////
#include <SoftwareSerial.h>
#include <String.h>
SoftwareSerial gprsSerial(8,9); // RX, TX
//////////
#define TdsSensorPin A0
#define VREF 5.0 // analog reference voltage(Volt) of the ADC
#define SCOUNT 30 // sum of sample point
int analogBuffer[SCOUNT]; // store the analog value in the array, read from ADC
int analogBufferTemp[SCOUNT];
int analogBufferIndex = 0, copyIndex = 0;
float averageVoltage = 0;
float tdsValue = 0;
float temperature1 = 25;
float analogTDSvalue = 0;
float CUManalogTDSvalue = 0;
int n = 0;
void setup()
{
Serial.begin(9600);
pinMode(TdsSensorPin, INPUT);
sensors.begin();
gprsSerial.begin(9600);
gprsSerial.print("Temperature for the device 1 (index 0) is: ");
///
}
void loop()
{
delay(2000);
// call sensors.requestTemperatures() to issue a global temperature
// request to all devices on the bus
//Serial.print("Requesting temperatures...");
sensors.requestTemperatures(); // Send the command to get temperatures
//Serial.println("DONE");
// We use the function ByIndex, and as an example get the temperature from the first sensor only.
temperature1 = sensors.getTempCByIndex(0);
// Check if reading was successful
if(temperature1 != DEVICE_DISCONNECTED_C)
{
Serial.print("Temperature for the device 1 (index 0) is: ");
ShowSerialData1();
Serial.println(temperature1);
ShowSerialData1();
}
else
{
gprsSerial.println("Error: Could not read temperature data");
}
//
;
while(n< 20)
{
analogTDSvalue = analogRead(A0);
CUManalogTDSvalue = CUManalogTDSvalue+analogTDSvalue;
n = n+1;
}
float AverageCUManalogTDSvalue = CUManalogTDSvalue/n;
Serial.print("n = ");
ShowSerialData1();
Serial.println(n);
Serial.print("CUManalogTDSvalue = ");
ShowSerialData1();
Serial.println(CUManalogTDSvalue);
Serial.print("AverageCUManalogTDSvalue =");
ShowSerialData1();
Serial.println(AverageCUManalogTDSvalue);
n = 0;
CUManalogTDSvalue = 0;
//read the analog value and store into the buffer
averageVoltage = AverageCUManalogTDSvalue * 5.0/ 1023.0; // read the analog value more stable by the median filtering algorithm, and convert to voltage value
float compensationCoefficient=1.0+0.02*(temperature1-25.0); //temperature compensation formula: fFinalResult(25^C) = fFinalResult(current)/(1.0+0.02*(fTP-25.0));
float compensationVolatge=averageVoltage/compensationCoefficient; //temperature compensation
tdsValue=(133.42*compensationVolatge*compensationVolatge*compensationVolatge - 255.86*compensationVolatge*compensationVolatge + 857.39*compensationVolatge)*0.5; //convert voltage value to tds value
Serial.print("analogTDSvalue:");
ShowSerialData1();
Serial.println(analogTDSvalue);
ShowSerialData1();
Serial.print("voltage:");
ShowSerialData1();
Serial.print(averageVoltage);
ShowSerialData1();
Serial.println("V ");
ShowSerialData1();
Serial.print("TDS Value:");
ShowSerialData1();
Serial.print(tdsValue,0);
ShowSerialData1();
Serial.println("ppm");
ShowSerialData1();
transmit_data();
}
////////////////////////////
void transmit_data()
{ //delay(2000);
Serial.println("AT");
delay(1000);
ShowSerialData();
Serial.println("AT+CPIN?");
delay(1000);
ShowSerialData();
Serial.println("AT+CREG?");
delay(1000);
ShowSerialData();
Serial.println("AT+CIPSPRT=0");
delay(1000);
ShowSerialData();
Serial.println("AT+CIPSTART=\"TCP\",\"api.Thing Speak.com\"80\"");//start up the connection
delay(100);
ShowSerialData();
Serial.println("AT+CIPSEND");//begin send data to remote server
delay(1000);
ShowSerialData();
String str="GET https://api.Thing Speak.com/update?api_key=F12YJUCEB4AI358&field1=" + String(temperature1) +"&field2="+String(tdsValue);
Serial.println(str);
Serial.println(str);//begin send data to remote server
delay(500);
ShowSerialData();
Serial.println("AT+CIPSHUT");//close the connection
delay(100);
ShowSerialData();
Serial.println("AT");
delay(100);
}
void ShowSerialData()
{
while(Serial.available()!=0)
gprsSerial.write(Serial.read());
delay(500);
}
void ShowSerialData1()
{
while(Serial.available()!=0)
gprsSerial.write(Serial.read());
delay(1000);
}
References
| [1] |
S. Pasika and S. T. Gandla, “Smart water quality monitoring system with cost-effective using IoT,” Heliyon, vol. 6, no. 7, Jul. 2020,
https://doi.org/10.1016/j.heliyon.2020.e04096
|
| [2] |
Anuradha T, Bhakti, Chaitra R, and Pooja D, “IRJET-V5I5315,” International Research Journal of Engineering and Technology (IRJET), 2018, Accessed: May 23, 2025. Available:
www.irjet.net
|
| [3] |
V. Lakshmikantha, A. Hiriyannagowda, A. Manjunath, A. Patted, J. Basavaiah, and A. A. Anthony, “IoT based smart water quality monitoring system,” Global Transitions Proceedings, vol. 2, no. 2, pp. 181–186, Nov. 2021,
https://doi.org/10.1016/j.gltp.2021.08.062
|
| [4] |
K. Lal, S. Menon, F. Noble, and K. M. Arif, “Low-cost IoT based system for lake water quality monitoring,” PLoS One, vol. 19, no. 3 March, Mar. 2024,
https://doi.org/10.1371/journal.pone.0299089
|
| [5] |
K. Shanmugam, M. E. Rana, and R. S. J. Singh, “IoT-based Smart Water Quality Monitoring System for Malaysia,” in 2021 3rd International Sustainability and Resilience Conference: Climate Change, Institute of Electrical and Electronics Engineers Inc., 2021, pp. 530–538.
https://doi.org/10.1109/IEEECONF53624.2021.9668120
|
| [6] |
J. O. Ighalo, A. G. Adeniyi, and G. Marques, “Internet of things for water quality monitoring and assessment: A comprehensive review,” in Studies in Computational Intelligence, vol. 912, Springer, 2021, pp. 245–259.
https://doi.org/10.1007/978-3-030-51920-9_13
|
| [7] |
S. Singh, A. Kumar, A. Prasad, and N. Bharadwaj, “IOT based Water Quality Monitoring System,” International Journal On Recent & Innovative Trend In Technology, 2018. Available:
www.ijritt.org
|
| [8] |
M. S. U. Chowdury et al., “IoT based real-time river water quality monitoring system,” in Procedia Computer Science, Elsevier B. V., 2019, pp. 161–168.
https://doi.org/10.1016/j.procs.2019.08.025
|
| [9] |
S. A. H. Almetwally, M. K. Hassan, and M. H. Mourad, “Real Time Internet of Things (IoT) Based Water Quality Management System,” in Procedia CIRP, Elsevier B. V., 2020, pp. 478–485.
https://doi.org/10.1016/j.procir.2020.03.107
|
| [10] |
J. H. Ryu, “UAS-based real-time water quality monitoring, sampling, and visualization platform (UASWQP),” HardwareX, vol. 11, Apr. 2022,
https://doi.org/10.1016/j.ohx.2022.e00277
|
| [11] |
O. Joshua, O. Steve-Essi, and O. Joshua Iyanuoluwa Steve-essi Onyiyechi Francis Idachaba, “Design and Implementation of a Smart Water Monitoring System (IoT) Using Arduino Microcontroller,” 2022. Available:
https://www.researchgate.net/publication/359253768
|
| [12] |
W. J. Hong et al., “Water quality monitoring with arduino based sensors,” Environments - MDPI, vol. 8, no. 1, pp. 1–15, Mar. 2021,
https://doi.org/10.3390/environments8010006
|
| [13] |
Maxim integrated, “ds18b20,” 2019, Accessed: Apr. 16, 2025. Available:
https://www.analog.com/media/en/technical-documentation/data-sheets/ds18b20.pdf
|
| [14] |
Aquaread company news, “What is Electrical Conductivity (EC).” Accessed: Dec. 26, 2024. Available:
https://www.aquaread.com/sensors/ec
|
| [15] |
Elprocus Company News, “Arduino Mega 2560 Board.” Accessed: May 07, 2025. Available:
https://www.elprocus.com/arduino-mega-2560-board/
|
Cite This Article
-
APA Style
Oputa, K., Amadi, E., Ekedebe, N. (2026). Development and Experimental Validation of an
IoT-enabled Water Quality Measurement Framework. International Journal of Environmental Monitoring and Analysis, 14(2), 52-71. https://doi.org/10.11648/j.ijema.20261402.11
 Copy
|
Copy
|
 Download
ACS Style
Oputa, K.; Amadi, E.; Ekedebe, N. Development and Experimental Validation of an
IoT-enabled Water Quality Measurement Framework. Int. J. Environ. Monit. Anal. 2026, 14(2), 52-71. doi: 10.11648/j.ijema.20261402.11
Copy
|
Download
AMA Style
Oputa K, Amadi E, Ekedebe N. Development and Experimental Validation of an
IoT-enabled Water Quality Measurement Framework. Int J Environ Monit Anal. 2026;14(2):52-71. doi: 10.11648/j.ijema.20261402.11
Copy
|
Download
-
@article{10.11648/j.ijema.20261402.11,
  author = {Kingsley Oputa and Emmanuel Amadi and Nnanna Ekedebe},
  title = {Development and Experimental Validation of an
IoT-enabled Water Quality Measurement Framework},
  journal = {International Journal of Environmental Monitoring and Analysis},
  volume = {14},
  number = {2},
  pages = {52-71},
  doi = {10.11648/j.ijema.20261402.11},
  url = {https://doi.org/10.11648/j.ijema.20261402.11},
  eprint = {https://article.sciencepublishinggroup.com/pdf/10.11648.j.ijema.20261402.11},
  abstract = {Sensors act as transducers that convert physical signals into electrical outputs for analysis. When integrated with IoT, they enhance water quality monitoring by improving accuracy, autonomy, and real-time detection of parameters such as pathogens, temperature, and Total Dissolved Solids/Electrical Conductivity (TDS/EC). In line with SDG 6, this study developed an IoT-based system for on-site monitoring and real-time data transmission to relevant authorities. The system uses TDS/EC sensors to measure dissolved ion concentration and a DS18B20 digital temperature sensor to provide temperature compensation for conductivity values. Data are processed via an Arduino Mega and transmitted to the Thing Speak cloud. Our results show temperature stability (28–30°C) and demonstrate that compensation significantly reduces variability, stabilizing TDS/EC readings and improving correlation. The compensation results demonstrated that raw TDS/EC values had a weak correlation with temperature, whereas compensated readings remained stable across the same conditions. The temperature histogram highlights the narrow range of environmental variation, reinforcing dataset stability. Histograms of raw versus compensated data confirm that DS18B20-based compensation enhances measurement accuracy and reliability, ensuring that detected anomalies reflect true water quality variations rather than environmental noise. Collectively, these plots validate that DS18B20-based compensation significantly improves accuracy and reliability in real-time IoT water quality monitoring. In summary, the correlation and regression analysis clearly demonstrate the effectiveness of the temperature compensation mechanism. A strong positive correlation (r = 0.82) and high R² value (0.67) indicate that raw TDS/EC measurements are heavily influenced by temperature fluctuations. After applying DS18B20-based temperature compensation, these effects were significantly reduced, with the correlation dropping to 0.18 and R² decreasing to 0.03. This confirms that temperature compensation enhances the stability, reliability, and interpretability of conductivity-based water quality measurements.},
 year = {2026}
}
Copy
|
Download
-
TY  - JOUR
T1  - Development and Experimental Validation of an
IoT-enabled Water Quality Measurement Framework
AU  - Kingsley Oputa
AU  - Emmanuel Amadi
AU  - Nnanna Ekedebe
Y1  - 2026/03/04
PY  - 2026
N1  - https://doi.org/10.11648/j.ijema.20261402.11
DO  - 10.11648/j.ijema.20261402.11
T2  - International Journal of Environmental Monitoring and Analysis
JF  - International Journal of Environmental Monitoring and Analysis
JO  - International Journal of Environmental Monitoring and Analysis
SP  - 52
EP  - 71
PB  - Science Publishing Group
SN  - 2328-7667
UR  - https://doi.org/10.11648/j.ijema.20261402.11
AB  - Sensors act as transducers that convert physical signals into electrical outputs for analysis. When integrated with IoT, they enhance water quality monitoring by improving accuracy, autonomy, and real-time detection of parameters such as pathogens, temperature, and Total Dissolved Solids/Electrical Conductivity (TDS/EC). In line with SDG 6, this study developed an IoT-based system for on-site monitoring and real-time data transmission to relevant authorities. The system uses TDS/EC sensors to measure dissolved ion concentration and a DS18B20 digital temperature sensor to provide temperature compensation for conductivity values. Data are processed via an Arduino Mega and transmitted to the Thing Speak cloud. Our results show temperature stability (28–30°C) and demonstrate that compensation significantly reduces variability, stabilizing TDS/EC readings and improving correlation. The compensation results demonstrated that raw TDS/EC values had a weak correlation with temperature, whereas compensated readings remained stable across the same conditions. The temperature histogram highlights the narrow range of environmental variation, reinforcing dataset stability. Histograms of raw versus compensated data confirm that DS18B20-based compensation enhances measurement accuracy and reliability, ensuring that detected anomalies reflect true water quality variations rather than environmental noise. Collectively, these plots validate that DS18B20-based compensation significantly improves accuracy and reliability in real-time IoT water quality monitoring. In summary, the correlation and regression analysis clearly demonstrate the effectiveness of the temperature compensation mechanism. A strong positive correlation (r = 0.82) and high R² value (0.67) indicate that raw TDS/EC measurements are heavily influenced by temperature fluctuations. After applying DS18B20-based temperature compensation, these effects were significantly reduced, with the correlation dropping to 0.18 and R² decreasing to 0.03. This confirms that temperature compensation enhances the stability, reliability, and interpretability of conductivity-based water quality measurements.
VL  - 14
IS  - 2
ER  -
Copy
|
Download