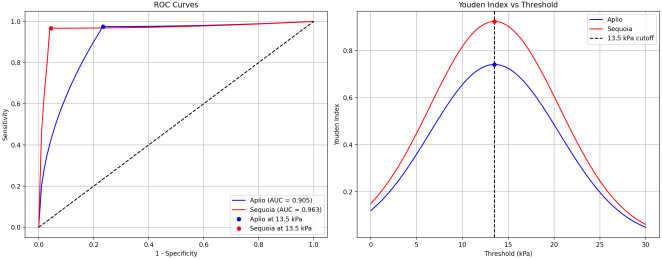
Introduction: Accurate assessment of liver fibrosis is essential for clinical management of patients with chronic liver disease. This study aimed to compare the diagnostic performance and agreement between two different ultrasound elastography systems, Canon Aplio i800 (2D-SWE) and Siemens Sequoia (pSWE), in an obese population with various liver pathologies and to identify factors influencing measurement discrepancies. Methods: In this prospective cross-sectional study, 89 adult patients with an increased risk of fatty liver disease underwent liver stiffness measurements using the Canon Aplio i800 (2D-SWE) and Siemens Sequoia (pSWE) systems. Patients were categorized into fibrosis stages (F0-F4) according to the established cut-off values. Agreement between systems was assessed using correlation coefficients, Bland-Altman analysis, and Cohen's kappa. Regression analysis was performed to identify the factors influencing measurement variability. Results: The study included 63 males and 25 females (mean age, 52 years; mean BMI: 29.5 kg/m²). The overall correlation between systems was moderate (r=0.68, 95% CI: 0.54-0.77), with a stronger correlation in F4 patients (r=0.575) than in non-F4 patients (r=0.237). For the F4 classification, both systems showed excellent sensitivity (97.5%), but Sequoia demonstrated superior specificity (100% vs. 79.6%) and overall accuracy (98.9% vs. 87.9%). The mean difference between measurements was -1.44 kPa overall, with larger discrepancies in F4 patients (-5.79 kPa) than in non-F4 patients (0.60 kPa). Multivariate analysis identified the skin-to-capsule distance and shear wave dispersion as the most significant factors affecting measurement variability, particularly for the Aplio system. Conclusion: Although both systems demonstrated high diagnostic performance for advanced fibrosis, the Sequoia system showed superior specificity and accuracy in the obese population. Measurements between systems are not directly interchangeable, particularly in patients with advanced fibrosis, increased subcutaneous fat, or liver inflammation. The Society of Radiologists in Ultrasound "rule of four" remains appropriate for liver stiffness classification, but system-specific considerations are necessary for accurate clinical interpretation.
| Published in | International Journal of Gastroenterology (Volume 9, Issue 1) |
| DOI | 10.11648/j.ijg.20250901.110 |
| Page(s) | 58-70 |
| Creative Commons |
This is an Open Access article, distributed under the terms of the Creative Commons Attribution 4.0 International License (http://creativecommons.org/licenses/by/4.0/), which permits unrestricted use, distribution and reproduction in any medium or format, provided the original work is properly cited. |
| Copyright |
Copyright © The Author(s), 2025. Published by Science Publishing Group |
Liver Stiffness, Liver Fibrosis, Metabolic Associated Steatotic Liver Disease (MASLD), 2D Shear Wave Elastography, Point Shear Wave Elastography
MASLD | Metabolic Associated Steatotic Liver Disease |
2D SWE | 2dimensional Shear Wave Elastography |
pSWE | Point Shear Wave Elastography |
SCD | Skin to Capsule Distance |
SWD | Shear Wave Dispersion |
DAX | Deep Abdominal Probe |
NAFLD | Non Alcoholic Fatty Liver Disease |
NASH | Non Alcoholic Steatohepatitis. |
| [1] | Rinella ME, Lazarus JV, Ratziu V, et al. A multisociety Delphi consensus statement on new fatty liver disease nomenclature. J Hepatol. 2023; 79(6): 1542-1556. |
| [2] | Younossi ZM, Golabi P, Paik JM, Henry A, Van Dongen C, Henry L. The global epidemiology of nonalcoholic fatty liver disease (NAFLD) and nonalcoholic steatohepatitis (NASH): a systematic review. Hepatology. 2023; 77(4): 1335-1347. |
| [3] | Araújo AR, Bellentani S, Tiribelli C, Rosso N, Bedogni G. Global epidemiology of non-alcoholic fatty liver disease/non-alcoholic steatohepatitis: What we need in the future. Liver International. 2018; Suppl 38 1(S1): 47-51. |
| [4] | Eslam M, Newsome PN, Sarin SK, et al. A new definition for metabolic dysfunction-associated fatty liver disease: An international expert consensus statement. J Hepatol. 2020; 73(1): 202-209. |
| [5] | Shiha G, Korenjak M, Eskridge W, et al. Redefining fatty liver disease: an international patient perspective. Lancet Gastroenterol Hepatol. 2021; 6(1): 73-79. |
| [6] | Henry L, Paik J, Younossi ZM. Review article: the epidemiologic burden of non-alcoholic fatty liver disease across the world. Alimentary Pharmacology & Therapeutics. 2022; 56(6): 942-956. |
| [7] | Wong SW, Chan WK. Epidemiology of non-alcoholic fatty liver disease in Asia. Indian Journal of Gastroenterology. 2020; 39(1): 1-8. |
| [8] | Riazi K, Azhari H, Charette JH, et al. The prevalence of noncirrhotic nonalcoholic fatty liver disease-associated hepatocellular carcinoma in the United States. J Clin Gastroenterol. 2022; 56(4): 343-352. |
| [9] | Huang DQ, El-Serag HB, Loomba R. Global epidemiology of NAFLD-related HCC: trends, predictions, risk factors and prevention. Nat Rev Gastroenterol Hepatol. 2021; 18(4): 223-238. |
| [10] | Sanyal AJ, Van Natta ML, Clark J, et al. Prospective study of outcomes in adults with nonalcoholic fatty liver disease. N Engl J Med. 2021; 385(17): 1559-1569. |
| [11] | Hagström H, Nasr P, Ekstedt M, et al. Fibrosis stage but not NASH predicts mortality and time to development of severe liver disease in biopsy-proven NAFLD. J Hepatol. 2017; 67(6): 1265-1273. |
| [12] | Rockey DC, Caldwell SH, Goodman ZD, Nelson RC, Smith AD. Liver biopsy. Hepatology. 2009; 49(3): 1017-1044. |
| [13] | Sigrist RMS, Liau J, Kaffas AE, Chammas MC, Willmann JK. Ultrasound elastography: review of techniques and clinical applications. Theranostics. 2017; 7(5): 1303-1329. |
| [14] | Ferraioli G, Wong VW, Castera L, et al. Liver ultrasound elastography: an update to the world federation for ultrasound in medicine and biology guidelines and recommendations. Ultrasound Med Biol. 2018; 44(12): 2419-2440. |
| [15] | Barr RG, Ferraioli G, Palmeri ML, et al. Elastography assessment of liver fibrosis: Society of Radiologists in Ultrasound consensus conference statement. Radiology. 2015; 276(3): 845-861. |
| [16] | Honda Y, Yoneda M, Imajo K, Nakajima A. Elastography techniques for the assessment of liver fibrosis in non-alcoholic fatty liver disease. International Journal of Molecular Sciences. 2020; 21(11): 4039. |
| [17] | Attia D, Manns MP, Potthoff A, et al. Liver stiffness measurement using acoustic radiation force impulse elastography in overweight and obese patients. Alimentary Pharmacology & Therapeutics. 2016; 44(4): 366-379. |
| [18] | Nogami A, Ogawa Y, Kirikoshi H, et al. Diagnostic comparison of vibration-controlled transient elastography and MRI techniques in overweight and obese patients with NAFLD. Scientific Reports. 2022; 12(1): 21267. |
| [19] | Bauer DJM, Nixdorf L, Dominik N, et al. The deep abdominal ultrasound transducer (DAX) increases the success rate and diagnostic accuracy of shear wave elastography for liver fibrosis assessment in patients with obesity-A prospective biopsy-controlled study. Alimentary Pharmacology & Therapeutics. 2024; 60(1): 70-82. |
| [20] | Kalaiyarasi K, Jee Keem L, Sanchalika A, et al. Transient Elastography Is the Best-Performing Non-Invasive Test of Liver Fibrosis in Obese Asian Patients with Non-Alcoholic Fatty Liver Disease: A Pilot, Cross-Sectional Study. Medicina (Kaunas, Lithuania). 2024; 60(1): 169. |
| [21] | Chen Y, Liao WF, Lu SN, et al. Diagnostic accuracy of transient elastography and acoustic radiation force impulse for staging hepatic fibrosis in patients with chronic hepatitis B. PLoS One. 2022; 17(1): e0262613. |
| [22] | Lee SM, Chang W, Kang HJ, et al. Comparison of four different Shear Wave Elastography platforms according to abdominal wall thickness in liver fibrosis evaluation: a phantom study. Med Ultrason. 2019; 21(1): 22-29. |
| [23] | Zhang Y, Li MX, Chen H, et al. Liver fibrosis imaging: A clinical review of ultrasound and magnetic resonance elastography. J Magn Reson Imaging. 2020; 51(1): 25-42. |
| [24] | Kennedy P, Wagner M, Castéra L, et al. Quantitative elastography methods in liver disease: current evidence and future directions. Radiology. 2018; 286(3): 738-763. |
| [25] | Barr RG, Wilson SR, Rubens D, Garcia-Tsao G, Ferraioli G. Update to the society of radiologists in ultrasound liver elastography consensus statement. Radiology. 2020; 296(2): 263-274. |
| [26] | Dietrich CF, Bamber J, Berzigotti A, et al. EFSUMB guidelines and recommendations on the clinical use of liver ultrasound elastography, update 2017 (long version). Ultraschall Med. 2017; 38: e16-47. |
| [27] | Ferraioli G, de Silvestri A, Reiberger T, et al. Adherence to quality criteria improves concordance between transient elastography and ElastPQ for liver stiffness assessment -- A multicenter retrospective study. Dig Liver Dis. 2018; 50(10): 1056-1061. |
| [28] | Ferraioli G, De Silvestri A, Lissandrin R, et al. Evaluation of inter-system variability in liver stiffness measurements. Ultraschall Med. 2019; 40: 64-75. |
| [29] | Qu Y, Li M, Hamilton G, et al. Average liver stiffness from multiple two-dimensional shear wave elastography measurements: a more accurate estimate than single measurement. J Clin Med. 2022; 11(12): 3371. |
| [30] | Rout G, Kedia S, Nayak B, et al. Controlled attenuation parameter for assessment of hepatic steatosis in Indian patients. J Clin Exp Hepatol. 2021; 11(5): 531-538. |
| [31] | Paternostro R, Reiberger T, Bucsics T. Elastography-based screening for esophageal varices in patients with advanced chronic liver disease. World J Gastroenterol. 2019; 25(3): 308-329. |
| [32] | Petta S, Sebastiani G, Vigano M, et al. Monitoring occurrence of liver-related events and survival by transient elastography in patients with nonalcoholic fatty liver disease and compensated advanced chronic liver disease. Clin Gastroenterol Hepatol. 2021; 19(4): 806-815. |
| [33] | Herrmann E, de Lédinghen V, Cassinotto C, et al. Assessment of biopsy-proven liver fibrosis by two-dimensional shear wave elastography: An individual patient data-based meta-analysis. Hepatology. 2018; 67(1): 260-272. |
| [34] | Papatheodoridi M, Hiriart JB, Lupsor-Platon M, et al. Refining the Baveno VI elastography criteria for the definition of compensated advanced chronic liver disease. J Hepatol. 2021; 74(5): 1109-1116. |
| [35] | Mózes FE, Lee JA, Selvaraj EA, et al. Diagnostic accuracy of non-invasive tests for advanced fibrosis in patients with NAFLD: an individual patient data meta-analysis. Gut. 2022; 71(5): 1006-1019. |
| [36] | Wang J, Malik N, Yin M, et al. Magnetic resonance elastography is accurate in detecting advanced fibrosis in autoimmune hepatitis. World J Gastroenterol. 2017; 23(5): 859-868. |
| [37] | Lee SM, Kim MJ, Yoon JH, et al. Comparison of point and 2-dimensional shear wave elastography for the evaluation of liver fibrosis. Ultrasonography. 2020; 39(3): 288-97. |
| [38] | Lee SM, Lee JM, Kang HJ, et al. Liver fibrosis staging with a new 2D-shear wave elastography using comb-push technique: Applicability, reproducibility, and diagnostic performance. PLoS One. 2017; 12: e0177264. |
| [39] | Gilligan LA, Trout AT, Bennett P, Dillman JR. Repeatability and agreement of shear wave speed measurements in phantoms and human livers across 6 ultrasound 2-Dimensional shear wave elastography systems. Invest Radiol. 2020; 55: 191-9. |
| [40] | Park CC, Nguyen P, Hernandez C, et al. Magnetic resonance elastography vs transient elastography in detection of fibrosis and noninvasive measurement of steatosis in patients with biopsy-proven nonalcoholic fatty liver disease. Gastroenterology. 2017; 152(3): 598-607. |
| [41] | Ozturk A, Grajo JR, Dhyani M, et al. Principles of ultrasound elastography. Abdom Radiol (NY). 2018; 43(4): 773-785. |
| [42] | Hwang J, Yoon HM, Jung AY, et al. Comparison of 2-dimensional shear wave elastographic measurements using ElastQ imaging and supersonic shear imaging: phantom study and clinical pilot study. J Ultrasound Med. 2020; 39: 311-21. |
| [43] | Cassinotto C, Lapuyade B, Mouries A, et al. Non-invasive assessment of liver fibrosis with impulse elastography: comparison of Supersonic Shear Imaging with ARFI and Fibro Scan (R). J Hepatol. 2014; 61: 550-557. |
| [44] | Gatos I, Drazinos P, Yarmenitis S, et al. Comparison of sound touch elastography, shear wave elastography and vibration-controlled transient elastography in chronic liver disease assessment using liver biopsy as the "reference standard". Ultrasound Med Biol. 2020; 46: 959-71. |
| [45] | Huang R, Jiang N, Yang R, et al. Fibroscan improves the diagnosis and monitoring of hepatic fibrosis in chronic hepatitis B patients. Exp Ther Med. 2016; 12(5): 3328-3334. |
| [46] | Ferraioli G, Tinelli C, Dal Bello B, et al. Accuracy of real-time shear wave elastography for assessing liver fibrosis in chronic hepatitis C: a pilot study. Hepatology. 2012; 56(6): 2125-2133. |
| [47] | Jiang W, Huang S, Teng H, et al. Diagnostic accuracy of point shear wave elastography and transient elastography for staging hepatic fibrosis in patients with non-alcoholic fatty liver disease: a meta-analysis. BMJ Open. 2018; 8(8): e021787. |
| [48] | Xiao G, Zhu S, Xiao X, et al. Comparison of laboratory tests, ultrasound, or magnetic resonance elastography to detect fibrosis in patients with nonalcoholic fatty liver disease: A meta-analysis. Hepatology. 2017; 66(5): 1486-1501. |
| [49] | Bota S, Herkner H, Sporea I, et al. Meta-analysis: ARFI elastography versus transient elastography for the evaluation of liver fibrosis. Liver Int. 2013; 33(8): 1138-1147. |
| [50] | Friedrich-Rust M, Poynard T, Castera L. Critical comparison of elastography methods to assess chronic liver disease. Nat Rev Gastroenterol Hepatol. 2016; 13(7): 402-411. |
| [51] | Imajo K, Kessoku T, Honda Y, et al. Magnetic resonance imaging more accurately diagnoses hepatic fibrosis than FibroScan or alanine aminotransferase in patients with nonalcoholic fatty liver disease. Gastroenterology. 2016; 150(3): 626-637. |
| [52] | Loomba R, Wolfson T, Ang B, et al. Magnetic resonance elastography predicts advanced fibrosis in patients with nonalcoholic fatty liver disease: a prospective study. Hepatology. 2014; 60(6): 1920-1928. |
| [53] | Wildman-Tobriner B, Middleton MM, Moylan CA, et al. Association between magnetic resonance imaging-proton density fat fraction and liver histology features in patients with nonalcoholic fatty liver disease or nonalcoholic steatohepatitis. Gastroenterology. 2018; 155(5): 1428-1435. |
| [54] | Tang A, Desai A, Hamilton G, et al. Accuracy of MR imaging-estimated proton density fat fraction for classification of dichotomized histologic steatosis grades in nonalcoholic fatty liver disease. Radiology. 2015; 274(2): 416-425. |
| [55] | Jang JK, Choi SH, Lee JS, et al. Diagnostic performance of shear wave elastography for predicting esophageal varices in patients with compensated liver cirrhosis. J Ultrasound Med. 2021; 40(8): 1597-1606. |
| [56] | Garcovich M, Veraldi S, Di Stasio E, et al. Liver stiffness in pediatric patients with fatty liver disease: diagnostic accuracy and reproducibility of shear-wave elastography. Radiology. 2017; 283(3): 820-827. |
| [57] | Thiele M, Detlefsen S, Sevelsted Møller L, et al. Transient and 2-dimensional shear-wave elastography provide comparable assessment of alcoholic liver fibrosis and cirrhosis. Gastroenterology. 2016; 150(1): 123-133. |
| [58] | Palmeri ML, Wang MH, Rouze NC, et al. Noninvasive evaluation of hepatic fibrosis using acoustic radiation force-based shear stiffness in patients with nonalcoholic fatty liver disease. J Hepatol. 2011; 55(3): 666-672. |
| [59] | Venkatesh SK, Yin M, Ehman RL. Magnetic resonance elastography of liver: technique, analysis, and clinical applications. J Magn Reson Imaging. 2013; 37(3): 544-555. |
| [60] | Arena U, Vizzutti F, Corti G, et al. Acute viral hepatitis increases liver stiffness values measured by transient elastography. Hepatology. 2008; 47(2): 380-384. |
| [61] | Millonig G, Reimann FM, Friedrich S, et al. Extrahepatic cholestasis increases liver stiffness (FibroScan) irrespective of fibrosis. Hepatology. 2008; 48(5): 1718-1723. |
| [62] | Simkin P, Rattansingh A, Liu K, et al. Reproducibility of 2 liver 2-dimensional shear wave elastographic techniques in the fasting and postprandial states. J Ultrasound Med. 2019; 38: 1739-45. |
| [63] | Ryu H, Ahn SJ, Yoon JH, Lee JM. Reproducibility of liver stiffness measurements made with two different 2-dimensional shear wave elastography systems using the comb-push technique. Ultrasonography. 2019; 38: 246-54. |
| [64] | Mulabecirovic A, Vesterhus M, Gilja OH, Havre RF. In Vitro Comparison of Five Different Elastography Systems for Clinical Applications, Using Strain and Shear Wave Technology. Ultrasound Med Biol. 2016; 42: 2572-2588. |
| [65] | Yoon JH, Lee JM, Woo HS, et al. Staging of hepatic fibrosis: comparison of magnetic resonance elastography and shear wave elastography in the same individuals. Hepatology. 2013; 58(6): 2173-2186. |
| [66] | Leung VY, Shen J, Wong VW, et al. Quantitative elastography of liver fibrosis and spleen stiffness in chronic hepatitis B carriers: comparison of shear-wave elastography and transient elastography with liver biopsy correlation. Radiology. 2013; 269(3): 910-918. |
| [67] | Sporea I, Bota S, Peck-Radosavljevic M, et al. Acoustic Radiation Force Impulse elastography for fibrosis evaluation in patients with chronic hepatitis C: an international multicenter study. Eur J Radiol. 2012; 81(12): 4112-4118. |
| [68] | Chalasani N, Younossi Z, Lavine JE, et al. The diagnosis and management of nonalcoholic fatty liver disease: Practice guidance from the American Association for the Study of Liver Diseases. Hepatology. 2018; 67(1): 328-357. |
| [69] | European Association for the Study of the Liver (EASL); European Association for the Study of Diabetes (EASD); European Association for the Study of Obesity (EASO). EASL-EASD-EASO Clinical Practice Guidelines for the management of non-alcoholic fatty liver disease. J Hepatol. 2016; 64(6): 1388-1402. |
| [70] | Ferraioli G, Filice C, Castera L, et al. WFUMB guidelines and recommendations for clinical use of ultrasound elastography: Part 3: liver. Ultrasound Med Biol. 2015; 41(5): 1161-1179. |
| [71] | Shiina T, Nightingale KR, Palmeri ML, et al. WFUMB guidelines and recommendations for clinical use of ultrasound elastography: Part 1: basic principles and terminology. Ultrasound Med Biol. 2015; 41(5): 1126-1147. |
| [72] | Castera L, Friedrich-Rust M, Loomba R. Noninvasive assessment of liver disease in patients with nonalcoholic fatty liver disease. Gastroenterology. 2019; 156(5): 1264-1281. |
| [73] | Sanyal AJ, Chalasani N, Kowdley KV, et al. Pioglitazone, vitamin E, or placebo for nonalcoholic steatohepatitis. N Engl J Med. 2010; 362(18): 1675-1685. |
| [74] | Ratziu V, Harrison SA, Francque S, et al. Elafibranor, an agonist of the peroxisome proliferator-activated receptor-α and -δ, induces resolution of nonalcoholic steatohepatitis without fibrosis worsening. Gastroenterology. 2016; 150(5): 1147-1159. |
| [75] | Friedman SL, Neuschwander-Tetri BA, Rinella M, Sanyal AJ. Mechanisms of NAFLD development and therapeutic strategies. Nat Med. 2018; 24(7): 908-922. |
| [76] | Buzzetti E, Pinzani M, Tsochatzis EA. The multiple-hit pathogenesis of non-alcoholic fatty liver disease (NAFLD). Metabolism. 2016; 65(8): 1038-1048. |
| [77] | Kleiner DE, Brunt EM, Van Natta M, et al. Design and validation of a histological scoring system for nonalcoholic fatty liver disease. Hepatology. 2005; 41(6): 1313-1321. |
| [78] | Bedossa P, Poitou C, Veyrie N, et al. Histopathological algorithm and scoring system for evaluation of liver lesions in morbidly obese patients. Hepatology. 2012; 56(5): 1751-1759. |
| [79] | Papatheodoridi M, Rigamonti C, Calvaruso V, et al. EASL position paper on non-invasive tests to evaluate liver disease severity and prognosis – 2021 update. J Hepatol. 2021; 75(3): 659-689. |
| [80] | Newsome PN, Sasso M, Deeks JJ, et al. FibroScan-AST (FAST) score for the non-invasive identification of patients with non-alcoholic steatohepatitis with significant activity and fibrosis: a prospective derivation and global validation study. Lancet Gastroenterol Hepatol. 2020; 5(4): 362-373. |
APA Style
Kapoor, A., Kapur, A. (2025). Evaluation of Liver Stiffness in Obesity: A Comparison of Canon Aplio i800 2d-Shear Wave Elastography and Siemens Sequoia Point Shear Wave Elastography. International Journal of Gastroenterology, 9(1), 58-70. https://doi.org/10.11648/j.ijg.20250901.110
ACS Style
Kapoor, A.; Kapur, A. Evaluation of Liver Stiffness in Obesity: A Comparison of Canon Aplio i800 2d-Shear Wave Elastography and Siemens Sequoia Point Shear Wave Elastography. Int. J. Gastroenterol. 2025, 9(1), 58-70. doi: 10.11648/j.ijg.20250901.110
@article{10.11648/j.ijg.20250901.110,
  author = {Atul Kapoor and Aprajita Kapur},
  title = {Evaluation of Liver Stiffness in Obesity: A Comparison of Canon Aplio i800 2d-Shear Wave Elastography and Siemens Sequoia Point Shear Wave Elastography
},
  journal = {International Journal of Gastroenterology},
  volume = {9},
  number = {1},
  pages = {58-70},
  doi = {10.11648/j.ijg.20250901.110},
  url = {https://doi.org/10.11648/j.ijg.20250901.110},
  eprint = {https://article.sciencepublishinggroup.com/pdf/10.11648.j.ijg.20250901.110},
  abstract = {Introduction: Accurate assessment of liver fibrosis is essential for clinical management of patients with chronic liver disease. This study aimed to compare the diagnostic performance and agreement between two different ultrasound elastography systems, Canon Aplio i800 (2D-SWE) and Siemens Sequoia (pSWE), in an obese population with various liver pathologies and to identify factors influencing measurement discrepancies. Methods: In this prospective cross-sectional study, 89 adult patients with an increased risk of fatty liver disease underwent liver stiffness measurements using the Canon Aplio i800 (2D-SWE) and Siemens Sequoia (pSWE) systems. Patients were categorized into fibrosis stages (F0-F4) according to the established cut-off values. Agreement between systems was assessed using correlation coefficients, Bland-Altman analysis, and Cohen's kappa. Regression analysis was performed to identify the factors influencing measurement variability. Results: The study included 63 males and 25 females (mean age, 52 years; mean BMI: 29.5 kg/m²). The overall correlation between systems was moderate (r=0.68, 95% CI: 0.54-0.77), with a stronger correlation in F4 patients (r=0.575) than in non-F4 patients (r=0.237). For the F4 classification, both systems showed excellent sensitivity (97.5%), but Sequoia demonstrated superior specificity (100% vs. 79.6%) and overall accuracy (98.9% vs. 87.9%). The mean difference between measurements was -1.44 kPa overall, with larger discrepancies in F4 patients (-5.79 kPa) than in non-F4 patients (0.60 kPa). Multivariate analysis identified the skin-to-capsule distance and shear wave dispersion as the most significant factors affecting measurement variability, particularly for the Aplio system. Conclusion: Although both systems demonstrated high diagnostic performance for advanced fibrosis, the Sequoia system showed superior specificity and accuracy in the obese population. Measurements between systems are not directly interchangeable, particularly in patients with advanced fibrosis, increased subcutaneous fat, or liver inflammation. The Society of Radiologists in Ultrasound "rule of four" remains appropriate for liver stiffness classification, but system-specific considerations are necessary for accurate clinical interpretation.
},
 year = {2025}
}
TY  - JOUR
T1  - Evaluation of Liver Stiffness in Obesity: A Comparison of Canon Aplio i800 2d-Shear Wave Elastography and Siemens Sequoia Point Shear Wave Elastography

AU  - Atul Kapoor
AU  - Aprajita Kapur
Y1  - 2025/06/23
PY  - 2025
N1  - https://doi.org/10.11648/j.ijg.20250901.110
DO  - 10.11648/j.ijg.20250901.110
T2  - International Journal of Gastroenterology
JF  - International Journal of Gastroenterology
JO  - International Journal of Gastroenterology
SP  - 58
EP  - 70
PB  - Science Publishing Group
SN  - 2640-169X
UR  - https://doi.org/10.11648/j.ijg.20250901.110
AB  - Introduction: Accurate assessment of liver fibrosis is essential for clinical management of patients with chronic liver disease. This study aimed to compare the diagnostic performance and agreement between two different ultrasound elastography systems, Canon Aplio i800 (2D-SWE) and Siemens Sequoia (pSWE), in an obese population with various liver pathologies and to identify factors influencing measurement discrepancies. Methods: In this prospective cross-sectional study, 89 adult patients with an increased risk of fatty liver disease underwent liver stiffness measurements using the Canon Aplio i800 (2D-SWE) and Siemens Sequoia (pSWE) systems. Patients were categorized into fibrosis stages (F0-F4) according to the established cut-off values. Agreement between systems was assessed using correlation coefficients, Bland-Altman analysis, and Cohen's kappa. Regression analysis was performed to identify the factors influencing measurement variability. Results: The study included 63 males and 25 females (mean age, 52 years; mean BMI: 29.5 kg/m²). The overall correlation between systems was moderate (r=0.68, 95% CI: 0.54-0.77), with a stronger correlation in F4 patients (r=0.575) than in non-F4 patients (r=0.237). For the F4 classification, both systems showed excellent sensitivity (97.5%), but Sequoia demonstrated superior specificity (100% vs. 79.6%) and overall accuracy (98.9% vs. 87.9%). The mean difference between measurements was -1.44 kPa overall, with larger discrepancies in F4 patients (-5.79 kPa) than in non-F4 patients (0.60 kPa). Multivariate analysis identified the skin-to-capsule distance and shear wave dispersion as the most significant factors affecting measurement variability, particularly for the Aplio system. Conclusion: Although both systems demonstrated high diagnostic performance for advanced fibrosis, the Sequoia system showed superior specificity and accuracy in the obese population. Measurements between systems are not directly interchangeable, particularly in patients with advanced fibrosis, increased subcutaneous fat, or liver inflammation. The Society of Radiologists in Ultrasound "rule of four" remains appropriate for liver stiffness classification, but system-specific considerations are necessary for accurate clinical interpretation.

VL  - 9
IS  - 1
ER  -
Department of Ultrasonography, Advanced Diagnostics and Institute of Imaging, Amritsar, India
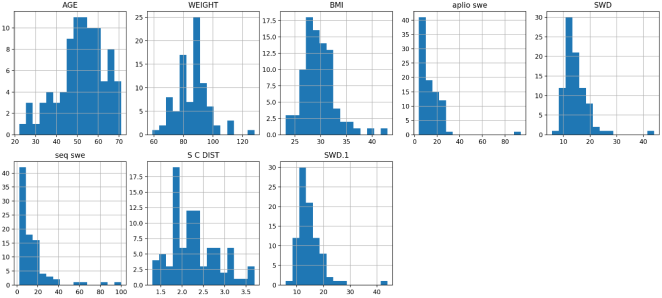
Figure 1. Histogram plots of demographic and elastographic variables by Aplio and Sequioa.
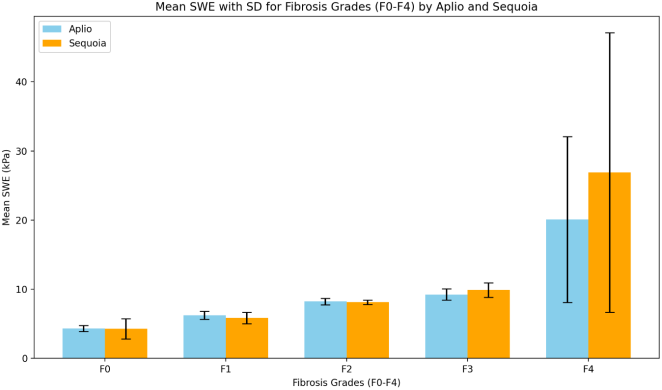
Figure 2. Box plot distribution of fibrosis grades by Aplio and Sequioa.
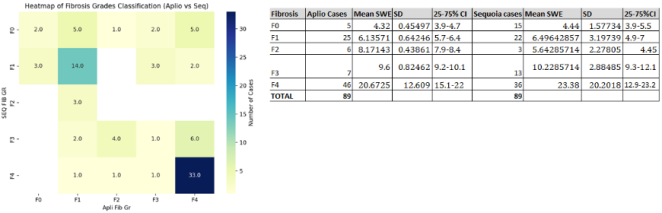
Figure 3. Heat map of fibrosis grade classification by Aplio and Sequoia and the mean SWE along with standard deviation and 95% confidence interval chart.
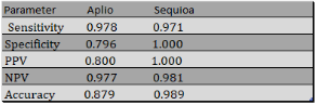
Figure 4. Area under curve analysis for F4 vs non F4 grades by Aplio and Sequoia along with the diagnostic analysis table.
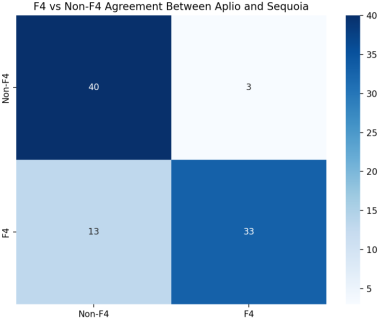
Figure 5. Heat map matrix of the correlation of F4 vs non F4 cases of Aplio and Sequoia.
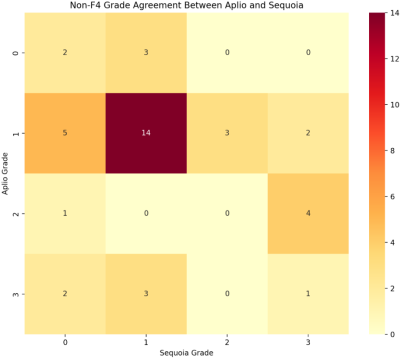
Figure 6. Heat map matrix of correlation of Non F4 cases of Aplio and Sequoia.
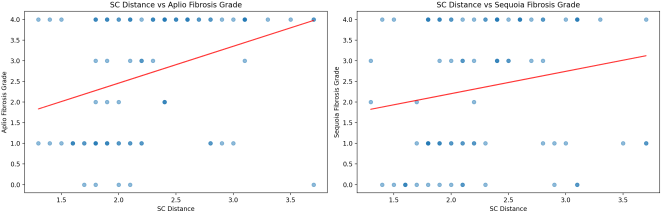
Figure 7. Regression plots of SC distance for Aplio and Sequoia showing R2 of 0.11 and 0.03, respectively, with p-values of 0.001 and 0.07.
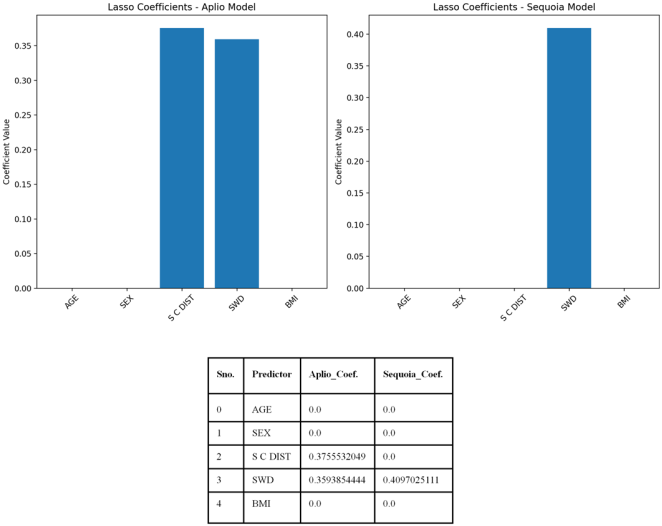
Figure 8. Lasso regression coefficients of various predictors with Aplio and Sequoia with a bar chart.
Information

