Abstract
Wheel profile optimization has improved the performance between the wheel tread and rail on freight railways, which are primarily made up of tangent tracks and large curved tracks. However, it is impossible to overlook the flange wear brought on by the sharp curves that run along the tracks and toward the yards. This paper aims at analyzing how different parameters like curve radius, superelevation and curving speed after a given distance of operation, such as 20000 km influence wear along the curve during operation. A multifaceted research approach combining modeling and data analysis techniques was required to fully understand freight wheel wear in curves. Mathematical models estimated stresses and wear rate based on curve geometry, speed, and loading conditions. Simulations examined complex interactions between influential factors. The results show that when the above distance is run under different curve radius creep, the wear volume increases from 6.8 mm to 3.7 mm as the radius increases from 600 to 1200 m, especially on the outside wheels. Wear increased from 6.6 to 7.8 mm as the speed increased from 40 to 100 km/hr. after a distance of 20000 km. Increasing the superelevation from 80 to 140 mm reduced wear due to improved curves from 7.1 to 6.7 mm after 20.00 km, and a significant decrease in wear volume from 8.9 to 2.3 mm outside wheels after a 20.00 km operational distance.
Keywords
Multi-body Analysis, A Chard Law, Wear Model, Curved Track, Superelevation
1. Introduction
The Railway history in Ethiopia can be traced way back a century with the construction of a 784 Km railway in 1917 linking the capital Addis Ababa with the port of Djibouti
| [1] | R. Pankhurst, “The Franco-Ethiopian railway and its history,” Ethiop. Obs., vol. 6, no. 4, pp. 342–379, 1963. |
[1]
but the operation was phased out (disrupted) due to the absence of maintenance and repair. The line had reached Akaki, only 23 kilometers from the capital city by 1915, and two years later came to Addis Ababa itself
. This marked the official commercial opening of the 784 km long railway, although the Station of Addis Ababa was not inaugurated until 3 December 1929. The Ethio-Djibouti Standard Gauge Railway (EDR) was established in April 2017 to better logistics and transportation connectivity between the two countries. This project was expected to be able to drive the economic growth of Ethiopia. This is because the import-export of Ethiopian commodities was wholly dependent on the port of Djibouti. This can be said because at least 95% of Ethiopia’s Import & Export trade transits through the Port of Djibouti with only limited trade through Port Sudan
| [3] | M. Kozicki, “The history of railway in Ethiopia and its role in the economic and social development of this country,” Stud. Dep. African Lang. Cult., no. 49, 2015. |
| [4] | T. Jendel and M. Berg, “Prediction of Wheel Profile Wear, Vehicle System Dynamics” vol. 3114, no. March, 2016, https://doi.org/10.1080/00423114.2002.11666258 |
[3, 4]
.
The freight railways are mainly composed of tangent tracks and large curved tracks, and the performance between the wheel tread and rail has improved by wheel profile optimization
| [5] | A. Zmitrowicz, “WEAR PATTERNS AND LAWS OF WEAR – A REVIEW Alfred Zmitrowicz,” no. 1803, pp. 219–253, 2006. |
| [6] | J. Tunna, J. Sinclair, and J. Perez, “Proceedings of the Institution of Mechanical Engineers, Part F : Journal of Rail and Rapid Transit,” 2007, https://doi.org/10.1243/0954409JRRT72 |
[5, 6]
. However, the sharp curves exist along the tracks and towards the yards, and the flange wear caused by it cannot be ignored
| [7] | X. Jin, “Research Progress of High-Speed Wheel – Rail Relationship,” 2022. |
[7]
. The main reason for wheel flange wear is due to stress concentration caused by the contact between the wheel flange and the rail gauge corner. A large wheel flange force under a sharp curve of 1,200m for a normal section and 800m for a difficult section will inevitably cause severe wheel flange wear and side rail wear which becomes the decisive factor for rail replacement on a curved track
| [8] | Y. Ye, Y. Sun, S. Dongfang, D. Shi, and M. Hecht, optimizing wheel profiles and suspensions for railway vehicles operating on specific lines to reduce wheel wear: a case study. The Author(s), 2021. https://doi.org/10.1007/s11044-020-09722-4 |
[8]
.
Wheel/rail wear problems have become serious, especially in terms of circular wheel wear and hollow tread wear
. Severe wheel tread wear causes an increase in wheel flange height and running resistance; it can also affect vehicle stability and ultimately can lead to derailment. Once a wheel is worn or otherwise damaged, it must be reprofiled to recover the standard profile of the wheel flange and tread. Reprofiling is expensive, and the amount of metal removed from the tread surface during the cutting process is often greater than the amount of metal lost to wear
| [9] | S. Jung-won, K. Seok-jin, J. Hyun-kyu, and L. Chan-woo, “ce pt us,” Tribol. Trans., 2019, https://doi.org/10.1080/10402004.2019.1588446 |
| [10] | Y. Lu, Y. Yang, J. Wang, and B. Zhu, “Optimization and Design of a Railway Wheel Profile Based on Interval Uncertainty to Reduce Circular Wear,” vol. 2020, 2020. |
| [11] | H. Tobias, P. Stief, J. Dantan, A. Etienne, and A. Siadat, “curve based online assessment for Wear based online assessment.,” Procedia CIRP, vol. 88, pp. 312–317, 2019, https://doi.org/10.1016/j.procir.2020.05.054 |
| [12] | S. Yaseen and T. Wani, “Design and Analysis of a Railway Bogie Truck,” Int. J. Ignited Minds, vol. 01, no. 06, pp. 13–19, 2014. |
| [13] | W. Rail and I. Optimization, Wheel/Rail Interface Optimization. |
| [14] | S. Iwnicki, Handbook of Railway Vehicle Dynamics. |
| [15] | W. Zhai, J. Gao, P. Liu, and K. Wang, “Reducing rail side wear on heavy-haul railway curves based on wheel-rail dynamic interaction,” Veh. Syst. Dyn., vol. 52, no. SUPPL. 1, pp. 440–454, 2014, https://doi.org/10.1080/00423114.2014.906633 |
| [16] | K. Wang, C. Huang, W. Zhai, P. Liu, and S. Wang, “Progress on wheel-rail dynamic performance of railway curve negotiation,” J. Traffic Transp. Eng., vol. 1, no. 3, pp. 209–220, 2014, https://doi.org/10.1016/S2095-7564(15)30104-5 |
| [17] | P. D. Hargreaves, “Queensland University of Technology School of Engineering Systems DEVELOPMENT OF AN INTEGRATED MODEL FOR ASSESSMENT OF OPERATIONAL RISKS IN Associate Supervisor,” 2007. |
| [18] | J. Wang, X. Chen, X. Li, and Y. Wu, “In fl uence of heavy haul railway curve parameters on rail wear,” EFA, vol. 57, pp. 511–520, 2015, https://doi.org/10.1016/j.engfailanal.2015.08.021 |
| [19] | M. S. Sichani, On Efficient Modelling of Wheel-Rail Contact in Vehicle Dynamics Simulation. 2016. |
| [20] | B. Dirks, Simulation and measurement of wheel on rail fatigue and wear. 2015. |
| [21] | A. Ekberg, “Rolling contact Fatigue of Railway wheels. pdf.” 2016. |
| [22] | K. Tatsumi, T. Mineyasu, and H. Minoru, “Development of SP3 Rail with High Wear Resistance and Rolling Contact Fatigue Resistance for Heavy Haul Railways,” vol. 16, no. 16, pp. 32–37, 2011. |
| [23] | Intergovernmental Organisation for International Carriage by Rail, “Status: IN FORCE APTU Uniform Rules (Appendix F to COTIF 1999) Uniform Technical Prescriptions (UTP) relating to the Subsystem Rolling Stock FREIGHT WAGONS,” vol. 06, no. December 2010, pp. 2011–2013, 2012. |
| [24] | A. Sladkowski and M. Sitarz, “Analysis of wheel – rail interaction using FE software,” vol. 258, no. December 2003, pp. 1217–1223, 2005, https://doi.org/10.1016/j.wear.2004.03.032 |
[9-24]
.
Several types of research studies have been made on the wear of railways under different curve parameters. Taylor and Wu 2020
| [25] | P. Taylor and H. Wu, “Vehicle System Dynamics: International Journal of Vehicle Mechanics and Effects of wheel and rail profiles on vehicle performance,” no. February 2014, pp. 37–41, 2007, https://doi.org/10.1080/00423110600875393 |
[25]
, calculated vehicle curving performances with different wheel and rail profiles and predict the evolution trend of the wheel and rail wear. J. Wang et al. 2015
| [17] | P. D. Hargreaves, “Queensland University of Technology School of Engineering Systems DEVELOPMENT OF AN INTEGRATED MODEL FOR ASSESSMENT OF OPERATIONAL RISKS IN Associate Supervisor,” 2007. |
[17]
found that a high-order transition curve and extending the transition curve length can improve the railway vehicle's driving performance on the curve and reduce the curve rail wear.
Dirks 2015
| [20] | B. Dirks, Simulation and measurement of wheel on rail fatigue and wear. 2015. |
[20]
studied the measurement of the wheel on rail fatigue and wear using the wear and rail contact fatigue (RCF) models and the objectives were to gain insight into the causes of the wear and RCF damage and also obtain an overview of the existing wear and WRC models. He found the highest wear on rails depends on whether the rail is located in a curve or on a straight track and it exists on the outer rail of the curve on the gauge corner.
Ye et al. 2021
| [8] | Y. Ye, Y. Sun, S. Dongfang, D. Shi, and M. Hecht, optimizing wheel profiles and suspensions for railway vehicles operating on specific lines to reduce wheel wear: a case study. The Author(s), 2021. https://doi.org/10.1007/s11044-020-09722-4 |
[8]
used Hertz’s theory to solve the wheel-rail normal contact problem and FASTSIM to solve the tangential contact problem. Different wear modeling approaches were discussed, mainly based on the proportionality of wear with the energy dissipated at the contact. To be able to compare data and numerical results, a smoothing procedure was applied to the updated wheel profile.
Stuart L. 2021
provided a model of wheel wear based on the relationship between longitudinal and lateral primary suspension stiffness and the coefficient of friction at the center plate between the wagon body and the bolster, and they discovered a significant increase in wheel wear with increasing longitudinal primary suspension stiffness.
Telliskivi and Olofsson in 2015
| [26] | T. Tomioka, T. Takigami, and Y. Suzuki, “Numerical analysis of three-dimensional flexural vibration of railway vehicle car body,” Veh. Syst. Dyn., vol. 44, no. SUPPL. 1, pp. 272–285, 2006, https://doi.org/10.1080/00423110600871301 |
[26]
pointed out that the matching of worn wheel and rail profiles would easily lead to the contact between wheel flange and the inner side of the rail, which intensified the rail side wear.
1.1. Modelling of Wheel Wear
Current models attempt to quantify wear index, with most theories assuming wear is proportional to energy dissipated within the contact patch. Material loss is also proportional to frictional energy dissipated in the contact patch (Tγ), which is expressed as the sum of creepage and creep force for lateral, longitudinal, and spin components. Models assume the material loss is proportional to the frictional energy dissipated in the contact patch (Tγ). Tγ is expressed as the sum of the products of the creepage and creep force for the lateral, longitudinal, and spin components, as illustrated in Equation
1.
Where are lateral and longitudinal creep force respectively, and is spin creep moment. are lateral and longitudinal creepages, and is spin creepage, the spin creepage contribution is dismissed; the result is called the wear number.
1.2. Calculation of Wear Loss
The Archard's wear model
| [27] | W. ZHONG, W. J. Wang, and Q. Y. Liu, “Effect of curve radius on rolling contact fatigue properties of rails,” J. Southwest Jiaotong Univ., vol. 44, no. 2, pp. 254–257, 2009. |
| [28] | P. Turabimana and C. Nkundineza, “Development of an On-Board Measurement System for Railway Vehicle Wheel Flange Wear,” 2020. |
| [29] | J. F. Archard and P. R. S. L. A, “Elastic deformation and the laws of friction,” Proc. R. Soc. London. Ser. A. Math. Phys. Sci., vol. 243, no. 1233, pp. 190–205, 1957, https://doi.org/10.1098/rspa.1957.0214 |
| [30] | I. A. Soldatenkov, “Evolution of contact pressure during wear of the coating in a thrust sliding bearing,” J. Frict. Wear, vol. 31, no. 2, pp. 102–106, 2010, https://doi.org/10.3103/S1068366610020029 |
[27-30]
is based on the assumption that the volume of removed material is proportional to the dissipated energy. The dissipation of energy is the work done by frictional forces so wear is only present in the sliding part of the contact. This model is derived using the theory of asperity contact and was first done by Ekberg in 2016
| [21] | A. Ekberg, “Rolling contact Fatigue of Railway wheels. pdf.” 2016. |
[21]
. The Archard equation for the wear volume is shown by Equation
2 as follows.
The wear volume is proportional to both the normal force, , and the sliding distance, is the hardness constant of the softer material and is a wear constant normally ranging from to . The magnitude of the loading, the material, and the local friction are typically the factors influencing .
The total wear depth of wheel (e) is represented by wheel wear depth per unit of mileage. αi and βj are used to represent the weights of curve W
m and speed V
n, respectively. The wear depth per unit of mileage can be expressed by the Equation
3.
,k=l, r(3)
where
is the lateral coordinate across the wheel profile, and
and
are the wear depth of the left and right wheels of the unit mileage, respectively. The maximum wear depth per unit of mileage
of left and right rail pairs is calculated in the following Equation
4.
(4)
2. Methodology
The wheel profile of a rail vehicle interacts with the rail at varying speeds, causing contact with the rail. The wheel's position and size change with each revolution, influenced by factors like vehicle suspension, track design, and rail profiles. Simulation is crucial for predicting wear.
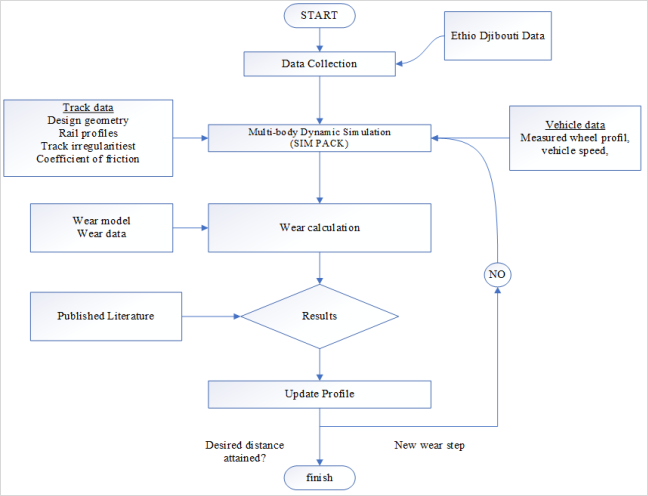
Due to simulation time constraints, it is generally not possible to simulate all contacts occuring between a certain wheel and the rails for a vehicle operating an entire railway network. An important task is therefore to find ways of selecting representative track parts and conditions. The methodology is here based on a load collective concept, where the load collective is a set of dynamic time-domain simulations that is chosen to expose the wheel to contacts with the rails that it is likely to encounter in reality. The load collective design process is discussed in Section 3. In
Figure 1 the methodology flow chart of the present tool is shown.
The rigid model of a freight train was used to simulate wear on the vehicle system, including car body, bogie frames, and wheelsets. The Archard wear model was used to study the effects of curve radius, superelevation, and rail cant on wear. Simulation analysis was conducted on different wear degrees of wheel-rail profiles, concluding the influence of the law of wear tread on dynamic performance. The Ethio-Djibouti vehicle model is developed using commercial multi-body simulation software SIMPACK and the Archard wear model. The multibody model exchanges data with the Archard model, evaluating contact points, wheel-rail contact forces, and creepages. The removed material depth and distribution are obtained, and the wheel profile is updated for new wear calculations.
Figure 1. Wear analysis flow chart.
In this research, wheel wear prediction involves an iterative coupling between an Ethio-Djibouti vehicle model developed using commercial multi-body simulation (MBS) software SIMPACK and Archard wear model. In
Figure 1, the flow chart of the iterative process is demonstrated, During the simulations, the multibody model continuously exchanges data at each time step with the Archard model, passing the wheelset variables' contact points, the wheel-rail contact forces, and the creepages, which are evaluated through the FASTSIM algorithm. Once the multibody simulations are completed, the removed material depth and its distribution along the wheel profile are obtained. Finally, the wheel profile will be updated and used for new wear calculations.
The SIMPACK software offers the Archard wear model to calculate wear depth and wear distribution along wheel profiles. The Archard wear model is a function of the sliding distance, normal force, and hardness of the material. The wear volume of the material worn away is proportional to the product of the sliding distance and the normal force and inversely proportional to the hardness of the worn material. The sliding distance and normal force, which are input to the Archard model to calculate wear depth, were obtained through vehicle modeling and dynamics calculations based on the FASTSIM algorithm.
To apply the wear model in SIMPACK, first define a result element of the Archard law for each wheel whose wear is to be determined, and the value of wear coefficients is filled based on the wear map which is summarized in
Table 1.
Table 1.
SIMPACK wear coefficients inputs | [22] | K. Tatsumi, T. Mineyasu, and H. Minoru, “Development of SP3 Rail with High Wear Resistance and Rolling Contact Fatigue Resistance for Heavy Haul Railways,” vol. 16, no. 16, pp. 32–37, 2011. |
Wear coefficients | Value |
(k1) Mild 1 | 0.0005 |
(k4) Mild 2 | 0.0005 |
(k3) Severe | 0.0035 |
(k1) Seizure | 0.035 |
The hardness of the material (N/𝑚2) | 3000000000 |
Relative velocity limit mild1-severe | 0.2 |
Relative velocity limit severe-mild2 | 0.7 |
Relative hardness limit | 0.8 |
Wear coefficients are usually constant. However, there are three wear regimes: mild wear, severe wear, and seizure, each with its own set of wear coefficients. Mild wear is oxidative, resulting in the characteristic brown powder visible all along a train track. Small metal flakes peel away from the base material as a result of severe wear. Seizures destroy the material surface. When certain parameters change, such as when the relative velocity or pressure exceeds or falls below a given value, the transitions between wear regimes occur abruptly.
3. Results and Discussion
The simulated wheel wear result will be visualized by evaluating the wear depth influence of different parameters like curve radius, curving speed, superelevation, and rail cant on wear along different curves will be addressed. The results of the first wheelset that is to say the right and left wheels will be analyzed and the third wheelset will be analyzed for some scenarios.
3.1. Effect of Curve Radius
The curve radius in the simulations varied from 800 to 1200 m and the super-elevation values ranged from 0.06 to 0.03m, which represent the narrowest and the largest curve, respectively. The speed of the train was 60 km/h for all the curves considered. The track has got curves of up to 600m but for a better analysis, narrow curves were considered because they bring out the maximum impact of the cases considered.
The vehicle is assumed to run on a straight track first, then on a bloss transition curve before entering a circular curve, and then on a bloss transition curve and straight line in the final stage, with the total distance corresponding to the radius shown in
Table 2.
Table 2. Sebeta to Meiso phase 1 project curve length.
Curve Radius (m) | Length (m) |
600 | 190 |
800 | 180 |
1000 | 140 |
1200 | 120 |
At the same safe curving speed v = 60 km/h, with a balanced rail cant gradient of 1/40 track curves of 600m, 800m, 100m, and 1200m were analysed and their corresponding superelevation was calculated according to the Equation
5 below.
(5)
The simulation analysis conducted under the corresponding characteristic curves is shown in
Table 3.
Table 3. Ride comfort index due to vehicle speed with overload passenger’s carrying load and two polygonized wheels.
Curve Radius Variation | Calculated superelevation (m) |
600m | 0.06 |
800m | 0.05 |
1000m | 0.04 |
1200m | 0.03 |
Using the above parameters four simulations were carried out and the corresponding longitudinal creep forces and derailment coefficient were recorded.
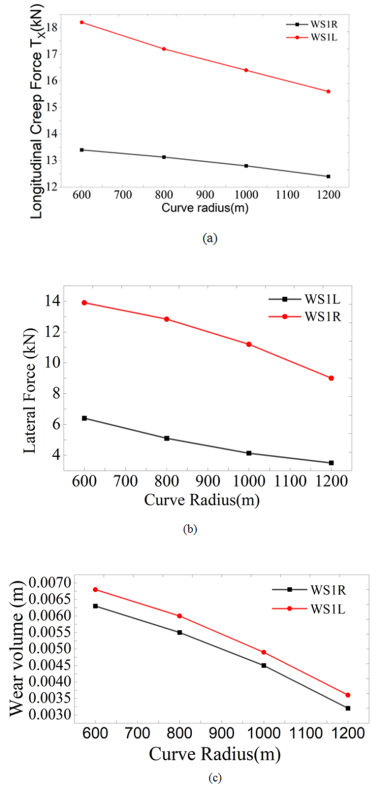
Figure 2. Effect of curve radius on wear.
The lateral forces and longitudinal creep forces are very high on the left wheel of the leading wheelset when the curve radius is small which indicates there are high stresses on small curves which also leads to high wear volumes removal of 6.8mm. However, as the curve radius increases from 600m to 1200m the wheel-rail lateral force, longitudinal creep forces, and wear volume reduce accordingly as seen in
Figure 2a and
2b.
Figure 2c above observed that the creep forces of the left wheel are higher (18.5kN).
3.2. Effect of Curving Speed
Using a curving peed of 40, 60, 80 and 100 km/respectively when the vehicle passes the center of the curved track some of the compared to that of the right wheel (13.5kN) this is because as a train enters the curve, wheel–rail interaction is intensified by ‘irregularity’ (railway alignment design), and the wear increases. As the train pulls out of the curve, the influence of ‘irregularity’ on the wheel–rail interaction decreases and the wear is alleviated.
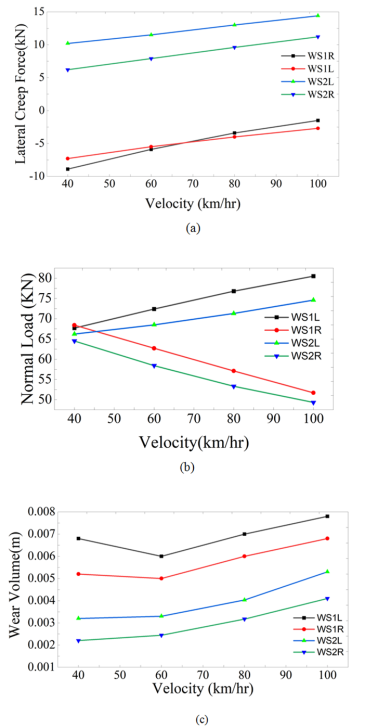
Figure 3. Effects of speed on wear on curved track.
From
Figure 3, the difference between the normal loads of the left and right wheels increases with increasing curving speed. This is mainly caused by the increasing of the centrifugal force of the vehicle due to the increased curving speed. When the speed increases from 40 to 100 km/h, the total lateral creep force of the leading wheelset (WS1L) increases hence leading to an increase in wear volume of 7.8mm. The lateral force is caused by thAe curved track, and in the opposite direction of the Y-axis. A common trend can be found where the wear first increases and then decreases. This tendency is the result of the fluctuation of wheel–rail forces throughout the curve.
The rail wear caused by the outside wheels (WS1L and WS2L) decreases with the speed increasing from 40 to 60 km/hr and increases from 60 to 100 km/h. The wear caused by wheels (WS1R and WS2R) grows with increasing speed. For the cases of the different speeds varied, the rail wear volume caused by WS1L is the largest and continues to increase with further increasing the speed. But, the increase of the curving speed is limited by the super-elevation of the curve track. Otherwise, the difference between the normal loads on the left and right wheels of the same wheelset further increases.
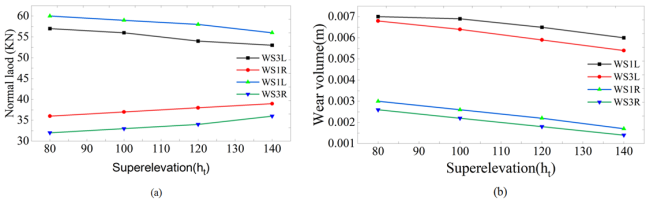
3.3. Effect of Superelevation of Wear
In the efforts of improving wear along the curve, optimizing the sizes of the track is a good measure. Analysis was carried out when the curving speed is v=60 km/h. The super-elevation ht is selected as 80, 100, and 120mm, respectively.
From
Figure 4b on reducing ht the WS1L and WS3L or the outside wheels of the leading wheelset dominate the wear as seen from the high loads experienced that lead to a high wear volume of 7.1mm and 6.7mm respectively. This is because of the centrifugal force that pushes the wheelset outward hence increasing the creep forces and wear. However, the normal loads of the left wheels (WS1L and WS3L) decrease linearly with increasing ht hence reducing the wear depth to around 7.1mm and 6.7mm respectively. Increasing ht is beneficial to the safe curving of the vehicle and the equilibrium use of rail life in service since less wear volumes are experienced as it increases.
Figure 4. Effect of super elevation on wear.
3.4. Validation
The work carried out by Li et al.
| [19] | M. S. Sichani, On Efficient Modelling of Wheel-Rail Contact in Vehicle Dynamics Simulation. 2016. |
[19]
was used to validate the result. The wear depth in the contact patch was based on Archard's model and extensive field measurements of the wheel/rail profile were carried out on the curves of the on different curves but the main analysis was carried out on the 500m curve radius because its wear is more serious than the rest. The field results indicated that a max wear depth of 9mm was realized after a distance of 200,000km which is close to the results of 6.8mm obtained when the curve radius used was 600m and a running distance of 20,000km These differences are mainly induced by many factors such as track irregularities, friction coefficient, longitudinal slop, traction, braking, etc.
4. Conclusions
Computer based simulations play an important role in investigating wheel rail wear in curves. Advanced multi-body dynamics software allows virtual analysis of factors like rail cant, radius, speed. These simulations utilize wear and contact mechanics models to estimate stresses and wear progression. However, simulation results need validation through physical experiments. Laboratory testing utilizes wheel-rail test rigs under controlled conditions to measure wear, forces. Field trials are also essential to evaluate wear in real world conditions on commercial tracks. Combining modeling, lab tests and field trials provides important insights into fundamental wear mechanisms and the influence of operational and environmental conditions.
The study unequivocally shows that for freight trains, wheel wear rates increase exponentially with tighter curve radii, insufficient cant, and higher curving speeds. Increasing cant past equilibrium results in diminishing returns. Wear can be decreased with optimal speed restriction and the best cant deficiency based on traction and radius. In order to reduce wheel-rail wear in curves, the validated wear prediction model offers a valuable tool for traffic management and railway maintenance planning.
Abbreviations
RRD | Rolling Radius Difference |
FCG | Fatigue Crack Growth |
MBS | Multibody System |
MBD | Multi Body Dynamics |
EN | European Standard |
DOF | Degrees Of Freedom |
COF | Coefficient of Friction |
Author Contributions
Mazuri Erasto Lutema: Conceptualization, Formal Analysis, Funding acquisition, Investigation, Methodology, Software, Validation, Visualization, Writing – original draft, Writing – review & editing
Tindiwensi Edison: Conceptualization, Data curation, Formal Analysis, Funding acquisition, Methodology, Project administration, Software, Validation, Visualization, Writing – review & editing
Funding
The authors declare that no funding was received for this research.
Data Availability Statement
The datasets used and/or analyzed during the current study are available from the corresponding author on reasonable request.
Conflicts of Interest
The authors declare no conflicts of interest.
References
| [1] |
R. Pankhurst, “The Franco-Ethiopian railway and its history,” Ethiop. Obs., vol. 6, no. 4, pp. 342–379, 1963.
|
| [2] |
Global Infrastructure Hub, “Addis Ababa – Djibouti Railway,” Glob. Infrastruct. Hub, no. January 2018, pp. 72–77, 2020, [Online]. Available:
https://www.gihub.org/resources/showcase-projects/addis-ababa-djibouti-railway/
|
| [3] |
M. Kozicki, “The history of railway in Ethiopia and its role in the economic and social development of this country,” Stud. Dep. African Lang. Cult., no. 49, 2015.
|
| [4] |
T. Jendel and M. Berg, “Prediction of Wheel Profile Wear, Vehicle System Dynamics” vol. 3114, no. March, 2016,
https://doi.org/10.1080/00423114.2002.11666258
|
| [5] |
A. Zmitrowicz, “WEAR PATTERNS AND LAWS OF WEAR – A REVIEW Alfred Zmitrowicz,” no. 1803, pp. 219–253, 2006.
|
| [6] |
J. Tunna, J. Sinclair, and J. Perez, “Proceedings of the Institution of Mechanical Engineers, Part F : Journal of Rail and Rapid Transit,” 2007,
https://doi.org/10.1243/0954409JRRT72
|
| [7] |
X. Jin, “Research Progress of High-Speed Wheel – Rail Relationship,” 2022.
|
| [8] |
Y. Ye, Y. Sun, S. Dongfang, D. Shi, and M. Hecht, optimizing wheel profiles and suspensions for railway vehicles operating on specific lines to reduce wheel wear: a case study. The Author(s), 2021.
https://doi.org/10.1007/s11044-020-09722-4
|
| [9] |
S. Jung-won, K. Seok-jin, J. Hyun-kyu, and L. Chan-woo, “ce pt us,” Tribol. Trans., 2019,
https://doi.org/10.1080/10402004.2019.1588446
|
| [10] |
Y. Lu, Y. Yang, J. Wang, and B. Zhu, “Optimization and Design of a Railway Wheel Profile Based on Interval Uncertainty to Reduce Circular Wear,” vol. 2020, 2020.
|
| [11] |
H. Tobias, P. Stief, J. Dantan, A. Etienne, and A. Siadat, “curve based online assessment for Wear based online assessment.,” Procedia CIRP, vol. 88, pp. 312–317, 2019,
https://doi.org/10.1016/j.procir.2020.05.054
|
| [12] |
S. Yaseen and T. Wani, “Design and Analysis of a Railway Bogie Truck,” Int. J. Ignited Minds, vol. 01, no. 06, pp. 13–19, 2014.
|
| [13] |
W. Rail and I. Optimization, Wheel/Rail Interface Optimization.
|
| [14] |
S. Iwnicki, Handbook of Railway Vehicle Dynamics.
|
| [15] |
W. Zhai, J. Gao, P. Liu, and K. Wang, “Reducing rail side wear on heavy-haul railway curves based on wheel-rail dynamic interaction,” Veh. Syst. Dyn., vol. 52, no. SUPPL. 1, pp. 440–454, 2014,
https://doi.org/10.1080/00423114.2014.906633
|
| [16] |
K. Wang, C. Huang, W. Zhai, P. Liu, and S. Wang, “Progress on wheel-rail dynamic performance of railway curve negotiation,” J. Traffic Transp. Eng., vol. 1, no. 3, pp. 209–220, 2014,
https://doi.org/10.1016/S2095-7564(15)30104-5
|
| [17] |
P. D. Hargreaves, “Queensland University of Technology School of Engineering Systems DEVELOPMENT OF AN INTEGRATED MODEL FOR ASSESSMENT OF OPERATIONAL RISKS IN Associate Supervisor,” 2007.
|
| [18] |
J. Wang, X. Chen, X. Li, and Y. Wu, “In fl uence of heavy haul railway curve parameters on rail wear,” EFA, vol. 57, pp. 511–520, 2015,
https://doi.org/10.1016/j.engfailanal.2015.08.021
|
| [19] |
M. S. Sichani, On Efficient Modelling of Wheel-Rail Contact in Vehicle Dynamics Simulation. 2016.
|
| [20] |
B. Dirks, Simulation and measurement of wheel on rail fatigue and wear. 2015.
|
| [21] |
A. Ekberg, “Rolling contact Fatigue of Railway wheels. pdf.” 2016.
|
| [22] |
K. Tatsumi, T. Mineyasu, and H. Minoru, “Development of SP3 Rail with High Wear Resistance and Rolling Contact Fatigue Resistance for Heavy Haul Railways,” vol. 16, no. 16, pp. 32–37, 2011.
|
| [23] |
Intergovernmental Organisation for International Carriage by Rail, “Status: IN FORCE APTU Uniform Rules (Appendix F to COTIF 1999) Uniform Technical Prescriptions (UTP) relating to the Subsystem Rolling Stock FREIGHT WAGONS,” vol. 06, no. December 2010, pp. 2011–2013, 2012.
|
| [24] |
A. Sladkowski and M. Sitarz, “Analysis of wheel – rail interaction using FE software,” vol. 258, no. December 2003, pp. 1217–1223, 2005,
https://doi.org/10.1016/j.wear.2004.03.032
|
| [25] |
P. Taylor and H. Wu, “Vehicle System Dynamics: International Journal of Vehicle Mechanics and Effects of wheel and rail profiles on vehicle performance,” no. February 2014, pp. 37–41, 2007,
https://doi.org/10.1080/00423110600875393
|
| [26] |
T. Tomioka, T. Takigami, and Y. Suzuki, “Numerical analysis of three-dimensional flexural vibration of railway vehicle car body,” Veh. Syst. Dyn., vol. 44, no. SUPPL. 1, pp. 272–285, 2006,
https://doi.org/10.1080/00423110600871301
|
| [27] |
W. ZHONG, W. J. Wang, and Q. Y. Liu, “Effect of curve radius on rolling contact fatigue properties of rails,” J. Southwest Jiaotong Univ., vol. 44, no. 2, pp. 254–257, 2009.
|
| [28] |
P. Turabimana and C. Nkundineza, “Development of an On-Board Measurement System for Railway Vehicle Wheel Flange Wear,” 2020.
|
| [29] |
J. F. Archard and P. R. S. L. A, “Elastic deformation and the laws of friction,” Proc. R. Soc. London. Ser. A. Math. Phys. Sci., vol. 243, no. 1233, pp. 190–205, 1957,
https://doi.org/10.1098/rspa.1957.0214
|
| [30] |
I. A. Soldatenkov, “Evolution of contact pressure during wear of the coating in a thrust sliding bearing,” J. Frict. Wear, vol. 31, no. 2, pp. 102–106, 2010,
https://doi.org/10.3103/S1068366610020029
|
Cite This Article
-
APA Style
Lutema, M. E., Edison, T. (2025). Wear Analysis of Freight Train Within Different Curve Parameters. International Journal of Industrial and Manufacturing Systems Engineering, 10(1), 1-8. https://doi.org/10.11648/j.ijimse.20251001.11
 Copy
|
Copy
|
 Download
ACS Style
Lutema, M. E.; Edison, T. Wear Analysis of Freight Train Within Different Curve Parameters. Int. J. Ind. Manuf. Syst. Eng. 2025, 10(1), 1-8. doi: 10.11648/j.ijimse.20251001.11
Copy
|
Download
AMA Style
Lutema ME, Edison T. Wear Analysis of Freight Train Within Different Curve Parameters. Int J Ind Manuf Syst Eng. 2025;10(1):1-8. doi: 10.11648/j.ijimse.20251001.11
Copy
|
Download
-
@article{10.11648/j.ijimse.20251001.11,
  author = {Mazuri Erasto Lutema and Tindiwensi Edison},
  title = {Wear Analysis of Freight Train Within Different Curve Parameters},
  journal = {International Journal of Industrial and Manufacturing Systems Engineering},
  volume = {10},
  number = {1},
  pages = {1-8},
  doi = {10.11648/j.ijimse.20251001.11},
  url = {https://doi.org/10.11648/j.ijimse.20251001.11},
  eprint = {https://article.sciencepublishinggroup.com/pdf/10.11648.j.ijimse.20251001.11},
  abstract = {Wheel profile optimization has improved the performance between the wheel tread and rail on freight railways, which are primarily made up of tangent tracks and large curved tracks. However, it is impossible to overlook the flange wear brought on by the sharp curves that run along the tracks and toward the yards. This paper aims at analyzing how different parameters like curve radius, superelevation and curving speed after a given distance of operation, such as 20000 km influence wear along the curve during operation. A multifaceted research approach combining modeling and data analysis techniques was required to fully understand freight wheel wear in curves. Mathematical models estimated stresses and wear rate based on curve geometry, speed, and loading conditions. Simulations examined complex interactions between influential factors. The results show that when the above distance is run under different curve radius creep, the wear volume increases from 6.8 mm to 3.7 mm as the radius increases from 600 to 1200 m, especially on the outside wheels. Wear increased from 6.6 to 7.8 mm as the speed increased from 40 to 100 km/hr. after a distance of 20000 km. Increasing the superelevation from 80 to 140 mm reduced wear due to improved curves from 7.1 to 6.7 mm after 20.00 km, and a significant decrease in wear volume from 8.9 to 2.3 mm outside wheels after a 20.00 km operational distance.},
 year = {2025}
}
Copy
|
Download
-
TY  - JOUR
T1  - Wear Analysis of Freight Train Within Different Curve Parameters
AU  - Mazuri Erasto Lutema
AU  - Tindiwensi Edison
Y1  - 2025/06/25
PY  - 2025
N1  - https://doi.org/10.11648/j.ijimse.20251001.11
DO  - 10.11648/j.ijimse.20251001.11
T2  - International Journal of Industrial and Manufacturing Systems Engineering
JF  - International Journal of Industrial and Manufacturing Systems Engineering
JO  - International Journal of Industrial and Manufacturing Systems Engineering
SP  - 1
EP  - 8
PB  - Science Publishing Group
SN  - 2575-3142
UR  - https://doi.org/10.11648/j.ijimse.20251001.11
AB  - Wheel profile optimization has improved the performance between the wheel tread and rail on freight railways, which are primarily made up of tangent tracks and large curved tracks. However, it is impossible to overlook the flange wear brought on by the sharp curves that run along the tracks and toward the yards. This paper aims at analyzing how different parameters like curve radius, superelevation and curving speed after a given distance of operation, such as 20000 km influence wear along the curve during operation. A multifaceted research approach combining modeling and data analysis techniques was required to fully understand freight wheel wear in curves. Mathematical models estimated stresses and wear rate based on curve geometry, speed, and loading conditions. Simulations examined complex interactions between influential factors. The results show that when the above distance is run under different curve radius creep, the wear volume increases from 6.8 mm to 3.7 mm as the radius increases from 600 to 1200 m, especially on the outside wheels. Wear increased from 6.6 to 7.8 mm as the speed increased from 40 to 100 km/hr. after a distance of 20000 km. Increasing the superelevation from 80 to 140 mm reduced wear due to improved curves from 7.1 to 6.7 mm after 20.00 km, and a significant decrease in wear volume from 8.9 to 2.3 mm outside wheels after a 20.00 km operational distance.
VL  - 10
IS  - 1
ER  -
Copy
|
Download