Geomagnetic exploration techniques largely determine the subsurface geometry and spatial distribution of rock magnetization and have been used to delineate the geometry and potential zones for economic mineralization. This study used outcrops and ground magnetic data collected over parts of Hawal Massif, northeastern Nigeria to determine the subsurface spatial distribution of rock magnetization and potential bearing zones for local mineralization. The geological investigation shows that the Hawal Massif is predominantly underlain by the Precambrian Basement rocks that include granites, gneisses and diorites. These rock units are largely affected by tensile and shear fractures. The latter largely trends in the NE-SW and NW-SE directions. The results also demonstrate that the geometry and potential targets for local mineralization consistently correlate with positive local maxima in total magnetic intensity (TMI) anomalies - those recording residual magnetic values between 180 nT and 350 nT. These zones of local total magnetic intensity (TMI) maxima occurred around Chicago, Jalingo Maiha and Dumo areas and thus represent potential target zones for local mineralization. Consequently, recognizing the effectiveness of ground magnetic data is crucial, as it provides information on the geometry and potential bearing zones for local mineralization, a parameter directly affecting selection of sites for detailed geological mapping, mineral resource assessment and mining activities.
This is an Open Access article, distributed under the terms of the Creative Commons Attribution 4.0 International License (http://creativecommons.org/licenses/by/4.0/), which permits unrestricted use, distribution and reproduction in any medium or format, provided the original work is properly cited.
Ground Magnetic Data, Magnetization, Mineralization, Magnetic Anomalies, Basement Rock, NE Nigeria
1. Introduction
Rocks-related mineralization such as rare earth elements (REEs) and precious metals is critical to present technological development. Localization of these mineralization zones are diverse and complex and have been one of the main targets of the mining industry. However, geomagnetic exploration technique provides the means to delineate magnetic contacts and mineralization zones of the earth's crust that are characterized by unusual (anomalous) magnetizations
[17]
Hsu, S. K., Sibuet J. C., &. Shyu C. T. (1996). High resolution detection of geological boundaries from potential field anomalies: An enhanced analytic signal technique. Geophysics, 61, 373-386.
[18]
Maunde, A. (2026). Modelling the subsurface geometries of dyke body through ground magnetic derivatives response. Journal of Geology and Mining Research. Vol. 17(1), pp. 3-14,
Pilkington, M., & P. Keating, (2004). Contact mapping from gridded magnetic data – a comparison of techniques: Exploration Geophysics, 35, 306-311.
[17, 18, 23]
. These anomalous zones might be associated with local mineralization or to the subsurface structures that have a bearing on the location of mineral deposits
[6]
Blakely R. J. (1995). Potential Theory in Gravity and Magnetic Applications. Cambridge Univ. Press, New York.
[7]
Clark D, A., Emerson D, W. (1991). Notes on rock magnetisation in applied geophysical studies. Exploration Geophysics 22(4): 547-555.
[9]
Dunlop D., ¨Ozdemir, ¨O. (1997). Rock Magnetism: Fundamentals and frontiers. Cambridge University Press. 573 p.
[6, 7, 9]
.
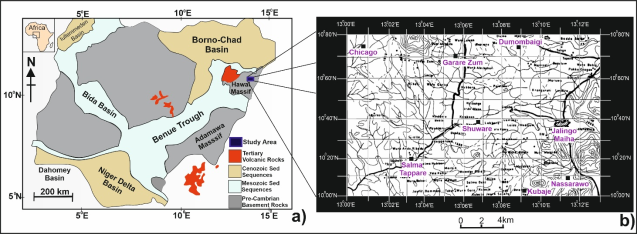
Hawal Massif falls within the northeastern sector of the Nigerian Basement Complex (Figure 1a). The Massif is bounded by the Cenozoic Chad Basin to the north, to the south and west by the Mesozoic Yola arm sequence of the Upper Benue trough and the Cameroun Republic to the east (Figure 1a). This Massif comprises metamorphic rocks, intruded by Pan African granitoids
[10]
Ekwueme B. N. (1990). Petrology of southern Obudu plateau, Bamenda Massif Southern Nigeria. In: Rocci. G. and Deschamps M (Eds). Recent data in African earth Scs. CIFEG occasional publications 22, 155-158.
[10]
. The latter evolved during the Pan African orogeny (600 ± 150 Ma). which involved intrusion, uplift, fractionation, faulting and high-level magmatism resulting in granitic intrusion
[19]
McCurry P. (1970). The geology of Precambrian to lower Palaeozoic rocks of northern Nigeria- a review in Kogbe C. A (Ed), Geology of Nigeria, Elizabethan press, Lagos. 15-39.
[19]
. Tertiary volcanic rocks such as basalts and pyroclastic materials linked to the Cameroun Volcanic line are also common but not mappable in the Hawal Massif.
Magnetic anomalies are always broader than the body causing them, this creates problems of anomaly interference and makes delineation of the individual sources difficult. Also, an anomaly due to a deep, large body can “mask” a shallow, less magnetic body. The solution is to calculate anomaly derivatives such as the vertical (VDR) and horizontal (XDR) derivatives of the magnetic fields to isolate and/or separate these anomalies for interpretation
[11]
Fairhead J. D., Green C. M., Verduzco B., & MacKenzie. (2004). A new set of magnetic field derivatives for mapping mineral prospects: ASEG 17th Geophys. Conf. and Exhibit., Sydney 2004., Extended Abstract.
[18]
Maunde, A. (2026). Modelling the subsurface geometries of dyke body through ground magnetic derivatives response. Journal of Geology and Mining Research. Vol. 17(1), pp. 3-14,
. Therefore, this paper uses outcrops and high-quality ground magnetic data acquired over parts of Hawal Massif, NE Nigeria to investigate the geology and potential bearing zones for local mineralization.
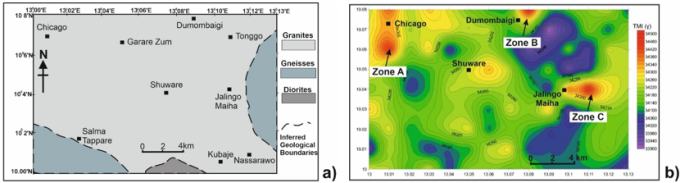
Figure 1. Simplified geological map of Nigeria showing the major rock units and location of the study area (Blue square) in the Hawal Massif, NE Nigeria. b) Regular gridded topographic map of the study area showing coordinates and localities.
2. Data and Methods
2.1. Ground Magnetic Field Mapping
Ground magnetic field mapping over the parts of Hawal Massif was carried out using a G856AX Proton procession magnetometer, silver compass, GPS and a regular grided topographic map of the study area (Figure 1b). The grided topographic map and compass/GPS were used to locate sampling points and navigate the study area. Whereas the G-856AX Proton procession magnetometer was used to measure the Total Magnetic Field Intensity (TMI) along the regular gridded points on the topographic map of the study area.
Fourteen (14) north-south parallel profile lines at 1.8 km interval and another nine (9) east-west parallel profile lines at 1.8 km interval were spread across the study area, giving a regular gridded survey area of 1.8 km by 1.8 km (Figure 1b). Therefore, the survey covered a total area of about 23.4 km by 14.4 km (337 km2), falling between Latitudes 10000'00’’N–10008'00’’N and Longitudes 13000'00’’E - 13013'00’’E of the Hawal Massif (Figure 1b).
Magnetic base stations readings were established at the first station of each profile lines and revisited after every 1.0 hour to make a loop during the survey exercises. At each station point along the profile lines, total magnetic field intensity (TMI), time and geological elements such as structures and lithologies were recorded across the study area (Figures 2 to 4).
2.2. Magnetic Data Processing
(1)
Where:
is the absolute value of geomagnetic total field measured during the survey exercise using Proton Magnetometer.
is derived from public domain software mathematical model. Inputs are latitude, longitude, height and date of the observation point. Full field components are outputted from the International Geomagnetic Reference Field (IGRF) and,
The transient variations, which are removed by recording their effects at based stations using Proton Magnetometer of the same sensitivity as used to measure .
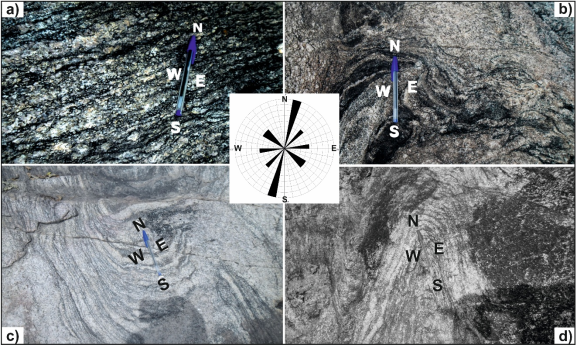
Figure 2. Structural features and trends on the mapped Gneisses. a) Banded Gneisses, approximately trending in the NNE-SSW direction. b) Banded Gneisses with dominant N-S axial fold trends. c) Open folded banded Gneisses, striking 760 SW with N-S axial trend. d) Isoclinal folded Gneisses, striking at 800 NE with NNE-SSW trends.
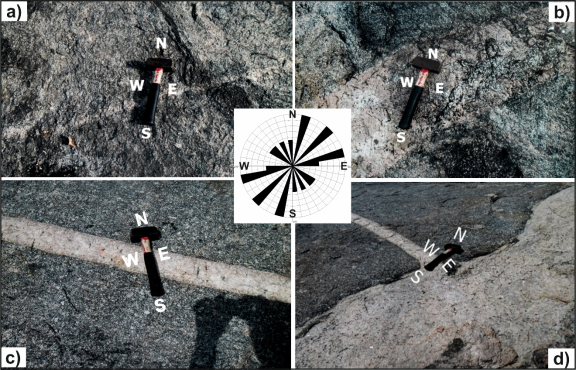
Figure 3. Structural features and trends on the mapped rock units. a) Quartzo-Feldspartic vein trending approximately in the E-W direction with 2 cm wide on gneisses. b) 30 cm wide of Pegmatite dyke cross-cutting Gneisses and approximately trending in the NE-SW direction. c) 10 cm wide of Pegmatite vein cross cutting Granites, approximately trending in the NW-SE direction. d) Pegmatite veins cross-cutting Granites in the N-S and E-W directions.
Therefore, the magnetic field data collected were subjected to drift correction. The International Geomagnetic reference field (IGRF) was computed using March 2012 as at the date the data were acquired from the field. These were carried out by subtracting the IGRF values from the magnetic field data. Finally, the total magnetic field intensity (TMI) recorded along the gridded survey area were contoured as shown in Figure 5a.
The total magnetic intensity map acquired in Figure 5a was subjected to both regional and residual separation. The regional magnetic fields are due to deep seated structures passing through the study area. Whereas the residual magnetic field is due to the localized structures in the study area and thus can be expressed as the Total field minus the regional field. It should be noted that similar studies have been conducted in other regions of the world. Using the local component of the geomagnetic field, buried magmatic bodies are being identified and their spatial positions determined in the intermontane basins of Azerbaijan
[15]
Gadirov V. G., (2024). Deep geological models of the ultra-deep well area Saatly DW-1 based on complex geophysical data. Geodynamics 1 (36) 63-73.
Vagif Gadirov, Ekrem Kalkan, Adil Ozdemir, Avaz Mammadov, Ali Novruzov, Kamran Gadirov, (2026). Gravity and magnetic exploration for unconventional oil and gas traps in buried volcanic formations. International Journal of Earth Sciences Knowledge and Applications 8 (1), 53-63.
Furthermore, the resultant residual data in Figure 6b was subjected to first horizontal Eqn. (2) and first vertical Eqn. (3) derivatives (Figures 7 and 8). These transformations enhance or isolate features better prior to qualitative and quantitative analysis
[11]
Fairhead J. D., Green C. M., Verduzco B., & MacKenzie. (2004). A new set of magnetic field derivatives for mapping mineral prospects: ASEG 17th Geophys. Conf. and Exhibit., Sydney 2004., Extended Abstract.
[18]
Maunde, A. (2026). Modelling the subsurface geometries of dyke body through ground magnetic derivatives response. Journal of Geology and Mining Research. Vol. 17(1), pp. 3-14,
Where: XDR is the horizontal gradient derivative, x is the distance along profile, T is horizontal Total Magnetic Intensity (TMI) measured in the field.
(3)
Where: VDR is the vertical gradient derivative, z is the depth along profile, T is horizontal Total Magnetic Intensity (TMI) measured in the field.
The vertical derivative (vertical gradient) is a good method for resolving anomalies over individual structures in total magnetic intensity data and importantly suppresses the regional content of the data (Fairhead et al., 2004). It also makes anomalies smaller in width and matches more closely to the causative body (Figure 8).
3. Results
3.1. Lithologic Rock Units
The geological outcrops and map in Figures 2 to 5a highlights the major structural features and rock distributions in the study area. The latter include granites, gneisses (commonly banded) and diorites (Figure 5a). The granites are widely spread and occupy more than 75% of the total mapped area. These rocks are highly weathered and fractured, with textures ranging from fine- to coarse-grained granites. However, some porphyritic textures are also observed on the granites. They are generally leucocratic, ranging in colour from greyish to pinkish (Figures 3c, d and 4a, b, d).
Two major outcrops of gneisses occur in the southwest and eastern margins of the mapped area (Figure 5a). The gneisses are of high-grade metamorphism with medium to coarse grained textures. The rock shows clear leucocratic (light) and melanocratic (dark) bands (Figure 2c) but ill-defined in some parts (Figure 2a). The exposure of diorite occurs as pockets of intrusion toward the southern margin of the mapped area (Figure 5a). They are dark in colour with fine to medium grained texture. Pegmatites occur in the form of veins/dykes. The veins/dykes cut across both the granites and gneisses (Figure 3).
Pockets of unmappable basalts occur in the study area. They are dark in colour and mainly of pyroclastic materials, with vesicles filled with a variety of amygdals, giving amygdaloidal structure which is characteristic of eruptive volcanoes and thus occur in small area overlaying the granites. The basalts are highly weathered, leading to laterization of the basalts. Laterites were observed at side of the road, close to a river channel. Large flakes of muscovite along with large crystals of quartz forming pockets in the pegmatites were also observed in the mapped area.
3.2. Structural Features
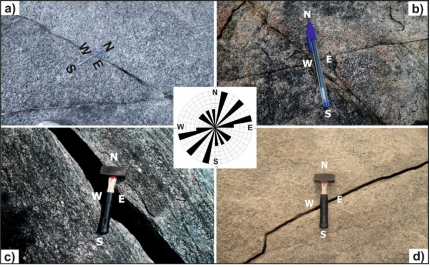
The structural features observed in the mapped area include folds, faults, foliations, fractures and veins/dykes (Figures 2 to 4). Isoclinal, open and symmetric folding were also observed on the gneisses, with dominant axial trending in the NNE-SSW (Figure 2). Several numbers of faults and fractures were recorded that trend in the NE-SW and NW-SE directions on both the granites and gneisses (Figure 4c, d). Fractures with large opening (11.5cm) have been observed on the gneisses and trend in the NW-SE direction, and another trending in the NE-SW over granites (Figure 4c, d).
Joints are also common and have irregular trends. Orthogonal joints occur mostly on granites and trending approximately in the NW-SE and E-W direction cross cutting each other (Figure 4b). Numerous veins and dikes have been mapped; these are fractures with space in between the fracture walls filled with minerals mostly quartz and feldspar forming quartz veins and quartzo-feldspathic veins and pegmatite vein and dikes (Figure 3). Pegmatite dykes are commonly found as intrusive into the gneiss. One of these dykes’ trends NE -SW direction and measures 30 cm wide (Figure 3b).
Quartzo-feldspartic veins of about 2 cm wide have been observed on the gneisses (Figure 3a). The dykes and veins mark the last phase of intrusive activities in the area. Therefore, the general structural trends in the study area are NNE-SSW and NE-SW, followed by E-W and NW-SE as shown in the insert generalized rose diagrams in Figures 2 to 4.
Figure 4. Structural features and orientation. a) E-W trending joint on Coarse grained granites. b) Orthogonal cross-cutting joints on Granites, striking in the NW-SE and E-W directions. c) NE-SW trending fracture with large opening of about 11.5 cm wide on Gneisses. d) Fracture on Granites with opening of 2 cm wide and approximately trending in the NE-SW direction.
3.3. Rock Magnetizations
Magnetic imaging shows that the Hawal Massif is characterized by its anomalous/irregular spatial distribution of magnetizations (Figures 5a and 6). Three (3) major local zones (A to C), having well-defined positive magnetic anomalies were identified in the mapped area (Figures 5b to 8).
Zone A occurs toward the northwest margin of the study area around Chicago, having high positive residual magnetizations between 160 nT and 320 nT (Figure 6b). The zone can be traced on the TMI map for at least 4.5 km along strike, developing a positive magnetic anomaly with up to 320 nT in relief, thus revealing high magnetization zone (Figure 6). This zone covers at least 1.9 km by 2.0 km and forms a linear NW-SE trend (Figure 6b). Zone B extends outside of the study area towards the northern margin around Dumombaigi (Figure 6). On the TMI map, the zone can be trace for at least 1.8 km by 0.9 km in the mapped area, developing a positive magnetic anomaly of 340 nT in relief (Figure 6b).
Zone C occurs toward the eastern side of the mapped area around Maiha Jalingo village, having high positive residual magnetizations between 180 nT to 340 nT (Figure 6b).
The zone can be traced on the TMI map for at least 3.6 km along strike, developing a positive magnetic anomaly with up to 340 nT in relief, thus also revealing high magnetization zone (Figure 6). This zone covers at least 3.6 km by 2.2 km and forms a linear E-W trend (Figure 6b). Compared to Zones A and B, it comprises a much broader, longer amplitude (Figures 6b and 10).
In the TMI and residual maps, the maximum amplitudes range between 180 to 350 nT. Residual magnetic map in Figures 6b, 7a and 8a shows contour lines with negative magnetic lows of about -180 nT and positive magnetic high of about +350 nT. Intermediate magnetic residual anomalies are found in the central part of the study area. Areas of occurrence of zero or negative anomalies are more prominent in the northeastern and northwestern regions (Figures 6b, 7a and 8a).
Figure 5. a) Geological map of the study area showing rocks distributions that include Granites, Gneisses and Diorites, b) Total Magnetic Intensity (TMI) map associated with spatial distributions of rocks magnetization in the study area, with high magnetizations anomalies around Zones A to C.
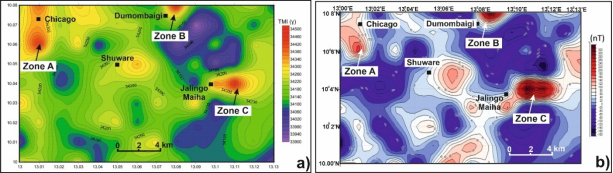
Figure 6. a) Total Magnetic Intensity (TMI) and b) Residual magnetic maps of the study area associated with geometry and spatial distributions of rocks magnetization. Areas of high magnetizations rocks were identified as Zones A to C
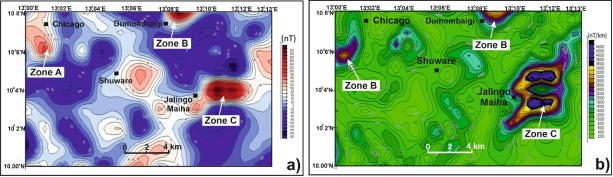
Figure 7. a) Residual magnetic and b) horizontal derivative maps of the study area associated with spatial distributions of rocks magnetization. Zones A to C are identified as local areas of high rock magnetizations.
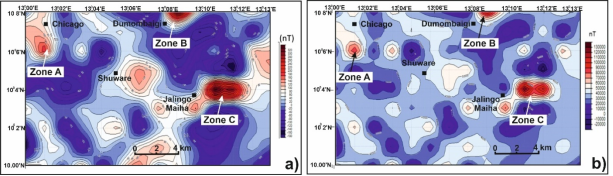
Figure 8. a) Residual magnetic and b) vertical derivative maps of the study area highlighting the spatial variations of rocks magnetization. Zones A to C are identified as zones of high rock magnetizations.
4. Discussion
4.1. Geological Settings of Hawal Massif
Hawal Massif consists of high-grade metamorphic and extensive igneous rocks with pockets of Tertiary magmatism (volcanic rocks)
[16]
Grant N. K., & Martin C. (1972). Integration of Aeromagnetic anomalies by use of characteristics curves, Geophysics No 31. 135-148.
[16]
(Figures 1b to 4). The volcanics are believed to be the extensions of the Cameroon volcanic line into Nigeria
[12]
Fitton J. G. (1980). The Benue Trough and Cameroon line- A migrating rift system in West Africa. Earth and planetary Science Letters 51. 132-138.
[13]
Fitton J. G. (1982). Active versus passive continental rifting; evidence from west Africa rift system. Techtono physics, 94, 473-481.
[14]
Fitton J. G., & Dunlop H. M. (1985). The Cameroon line, West Africa and its bearing on the origin of oceanic and continental alkali basalt, earth and planetary science letter 72, 23-38.
[20]
Moreau C., Regnoult J. M., Deruelle B., & Robineu, B. (1987). A New Tectonic model for the Cameroon line, central Africa. Tectonic Physics, 139, 317-334.
[12-14, 20]
. Gneisses are the oldest rock units in the Hawal Massif. The gneiss is strongly foliated and banded, and in some places, they give impressions of quartzo-feldspathic and pegmatitic dykes and veins (Figures 2 and 3). The gneisses show imprints of shearing, folding and faulting
[2]
Bassey N. E. (2005). Selective structural geological mapping and interpretation of Landsat and aeromagnetic data over Hawal Basement complex NE. Nigeria Unpublished PhD Thesis. Abubakar Tafawa Balewa University Bauchi.
[3]
Bassey N. E. (2006). Brittle Deformational features of Michika Area, Hawal Basement Complex, N. E Nigeria. Global Jour. of Geol. Sciences Vol. 5 (1 and 2) 51-54.
[2, 3]
(Figures 2 and 4). Whereas pegmatites commonly occur as intrusive cross-cutting the gneisses (Figure 3). The gneisses are intruded by granites of pan-African orogeny
[2]
Bassey N. E. (2005). Selective structural geological mapping and interpretation of Landsat and aeromagnetic data over Hawal Basement complex NE. Nigeria Unpublished PhD Thesis. Abubakar Tafawa Balewa University Bauchi.
[3]
Bassey N. E. (2006). Brittle Deformational features of Michika Area, Hawal Basement Complex, N. E Nigeria. Global Jour. of Geol. Sciences Vol. 5 (1 and 2) 51-54.
[2, 3]
. Granites consist of fine to coarse grained and porphyritic texture (Figure 4). Extensive shearing and faulting affected the granites and also intruded by pegmatitic veins (Figure 3c, d). Tertiary basalts occur as extensive flows within the granites. The basalts are unconformably overlaying the Basement rocks
[3]
Bassey N. E. (2006). Brittle Deformational features of Michika Area, Hawal Basement Complex, N. E Nigeria. Global Jour. of Geol. Sciences Vol. 5 (1 and 2) 51-54.
[4]
Bassey N. E. (2012). Digital Filtering of Aeromagnetic Maps for Lineaments Detection in Hawal Basement Complex of Hawal Area, NE Nigeria. Vol. 48(1). 1-11.
[3, 4]
.
Field, Landsat, SLAR, and aerial photographic studies indicate that the structural features in the Hawal Massif primarily resulted from the NW-SE compressional forces, with dominant structures striking in the NNE-SSW directions. However, most of these structural features have been overprinted or obliterated by later events
[8]
Dada S. S. (2006). Proterozoic evolution of Nigeria. In Basement Complex of Nigeria and its mineral resources (A tribute to Prof. M. A. O. Rahaman) O. Oshin (editor). Pp. 29-44.
[8]
.
[19]
McCurry P. (1970). The geology of Precambrian to lower Palaeozoic rocks of northern Nigeria- a review in Kogbe C. A (Ed), Geology of Nigeria, Elizabethan press, Lagos. 15-39.
[24]
Rahaman M. A. (1976). A review of the Basement complex of SW Nigeria. In Kogbe C. A. (editor) Elizabeth Pub. Co. Lagos. Pp14-58.
[25]
Rahaman, M. A. 1988, recent advances in the study of the basement complex in Nigeria. In: P. O. Oluyide (coordinator). Precambrian Geology of Nigeria. Geol. Surv. Nig. Pub. Pp. 11-43.
[19, 24, 25]
revealed that the dominant structures in the Nigerian Basement Complex were developed during the pan-African orogeny when the pre-existing structures were obliterated.
[22]
Oluyide, P. O. (1988), Structural Trends in the Nigerian Basement Complex, Precambrian geology of Nigeria, Geo. Surv. of Nigeria, 93-98.
[22]
showed that the most prominent structural grains in the Nigerian Basement Complex are N-S planer structures with relicts of E-W, NE-SW and NW-SE preserved.
Furthermore,
[3]
Bassey N. E. (2006). Brittle Deformational features of Michika Area, Hawal Basement Complex, N. E Nigeria. Global Jour. of Geol. Sciences Vol. 5 (1 and 2) 51-54.
[3]
analyzed satellite imagery from the Hawal Massif and revealed that the structural features are dominantly trending in the NE-SW, NE, NW-SE and E-W directions.
[4]
Bassey N. E. (2012). Digital Filtering of Aeromagnetic Maps for Lineaments Detection in Hawal Basement Complex of Hawal Area, NE Nigeria. Vol. 48(1). 1-11.
[4]
carried out Digital filtering of geomagnetic maps to detect lineament in the part of Hawal Massif and revealed several lineaments to be trending in the NE-SW, NW-SE and N-S directions.
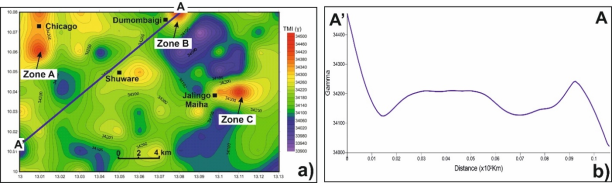
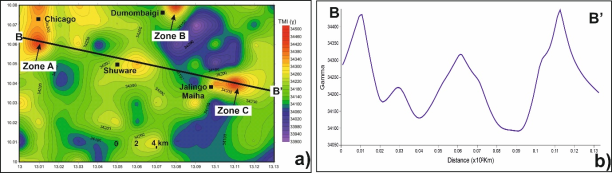
Figure 9. a) Total Magnetic Intensity (TMI) map and b) a graph of the change in magnetization of rocks along profile A’-A.
4.2. Localization of Potential Zones for Mineralization
In general, fractures exhibit contrast in magnetic susceptibility due to oxidation of magnetite or hematite and or in-filling of a fracture by intrusive bodies whose magnetic susceptibility is different from that of the host rock
[21]
Odia E. B. (1989). Regional magnetic lineament in the Younger Granites province of northern Nigeria. Journal of mining and geology, 25 (1&2). 233-240.
[21]
. The magnetic anomalies represent geological structures that appear as elliptical closures on the total magnetic intensity (TMI) map (Figure 5b).
In the study area, the total magnetic field intensity (TMI) and residual anomaly maps reveal three (3) regions that are characterized by significant positive magnetic anomalies (Figure 6). These regions are Zones A, B and C, which occur around Chicago, Dumombaigi and Maiha Jalingo respectively (Figure 6). The zones (A to C) developed a positive residual magnetic anomaly with up to 350 nT in relief, thus revealing high magnetization zones and potential target for local mineralization in the study area (Figure 6).
Furthermore, these zones (A to C) with high magnetic anomalies between 180 nT and 350 nT can be related to the presence of basic rocks intrusions and represent potential targets for local mineralization (Figures 5 to 10). Region with low magnetic anomalies between 0 and -180 nT are linked to poor magnetic minerals and presence of acidic igneous rocks and thus represent poor target for local occurrence of magnetic minerals (Figures 5 to 10). Considering the regional geological studies on the Nigerian northeastern and Northern Cameroon Basement Complex, the presence of anomalous rock magnetizations is also linked to the occurrence of basalts, trachyte’s and trachybasalts
[1]
Avbovbo A. A., Ayoola E, O., & Osahon G. A. (1986). Depositional and structural Styles in Chad Basin of Northeastern Nigeria. A. A. P. G Bulletin 70 (12); 1787-1789.
[3]
Bassey N. E. (2006). Brittle Deformational features of Michika Area, Hawal Basement Complex, N. E Nigeria. Global Jour. of Geol. Sciences Vol. 5 (1 and 2) 51-54.
[5]
Bassey N. E., Ezeigbo H. I., & Kwache J. B. (1999). A hydrogeological study of Duhu Area (Sheet 135), NE Nigeria on the basis of aeromagnetic data. Water Resources, 10; 26-30.
[20]
Moreau C., Regnoult J. M., Deruelle B., & Robineu, B. (1987). A New Tectonic model for the Cameroon line, central Africa. Tectonic Physics, 139, 317-334.
[1, 3, 5, 20]
. Areas of occurrence of zero or negative residual anomalies are linked to the presence of granites and gneisses
[3]
Bassey N. E. (2006). Brittle Deformational features of Michika Area, Hawal Basement Complex, N. E Nigeria. Global Jour. of Geol. Sciences Vol. 5 (1 and 2) 51-54.
Figure 10. a) Total Magnetic Intensity (TMI) map and b) a graph of the change in magnetization of rocks along profile A’-A.
5. Conclusion
The field geological mapping and ground magnetic survey over the parts of Hawal Massif, NE Nigeria resulted in the following conclusions:
a) Outcrops studies show that the Hawal Massif is predominantly underlain by the Precambrian Basement rocks that include granites, gneisses and diorites. These rocks are affected by joints and shear fractures that are oriented in the NE-SW, NW-SE, N-S and E-W directions.
b) The Total Magnetic Field Intensity (TMI) over the parts of Hawal Massif produced clearest anomalies that shows the subsurface spatial distributions of rocks magnetization. An enigmatic feature of the magnetic anomalies is the consistent shape of their anomaly along strike lengths, often showing a consistent direction of magnetization.
c) The positive and negative magnetic anomalies are due to the difference in lithological units, structural features and susceptibility variations. The positive magnetic anomalies are due to the presence of rocks magnetization. Therefore, the areas with positive magnetic anomalies such as Chicago, Dumombaigi and Maiha Jalingo are potential target for magnetic mineral exploration. Recognizing the power of ground magnetic survey is crucial, as it provides information on the geometry and localization of magnetic minerals, a parameter directly affecting the selection of mining sites for further economic investigations.
Abbreviations
TMII
Total Magnetic Intensity
VDR
Vertical Derivative
XDR
Horizontal Derivative
IGRFR
International Geomagnetic Reference Field (IGRF)
Acknowledgments
Modibbo Adama University, Yola is greatly acknowledged and thanked for the provision of the magnetic survey equipment (Proton Magnetometer).
The data supporting the findings of this study are available within the paper.
Conflicts of Interest
The authors declare that they have no known competing financial interests or personal relationships that could have appeared to influence the work reported in this paper.
References
[1]
Avbovbo A. A., Ayoola E, O., & Osahon G. A. (1986). Depositional and structural Styles in Chad Basin of Northeastern Nigeria. A. A. P. G Bulletin 70 (12); 1787-1789.
[2]
Bassey N. E. (2005). Selective structural geological mapping and interpretation of Landsat and aeromagnetic data over Hawal Basement complex NE. Nigeria Unpublished PhD Thesis. Abubakar Tafawa Balewa University Bauchi.
[3]
Bassey N. E. (2006). Brittle Deformational features of Michika Area, Hawal Basement Complex, N. E Nigeria. Global Jour. of Geol. Sciences Vol. 5 (1 and 2) 51-54.
[4]
Bassey N. E. (2012). Digital Filtering of Aeromagnetic Maps for Lineaments Detection in Hawal Basement Complex of Hawal Area, NE Nigeria. Vol. 48(1). 1-11.
[5]
Bassey N. E., Ezeigbo H. I., & Kwache J. B. (1999). A hydrogeological study of Duhu Area (Sheet 135), NE Nigeria on the basis of aeromagnetic data. Water Resources, 10; 26-30.
[6]
Blakely R. J. (1995). Potential Theory in Gravity and Magnetic Applications. Cambridge Univ. Press, New York.
[7]
Clark D, A., Emerson D, W. (1991). Notes on rock magnetisation in applied geophysical studies. Exploration Geophysics 22(4): 547-555.
[8]
Dada S. S. (2006). Proterozoic evolution of Nigeria. In Basement Complex of Nigeria and its mineral resources (A tribute to Prof. M. A. O. Rahaman) O. Oshin (editor). Pp. 29-44.
[9]
Dunlop D., ¨Ozdemir, ¨O. (1997). Rock Magnetism: Fundamentals and frontiers. Cambridge University Press. 573 p.
[10]
Ekwueme B. N. (1990). Petrology of southern Obudu plateau, Bamenda Massif Southern Nigeria. In: Rocci. G. and Deschamps M (Eds). Recent data in African earth Scs. CIFEG occasional publications 22, 155-158.
[11]
Fairhead J. D., Green C. M., Verduzco B., & MacKenzie. (2004). A new set of magnetic field derivatives for mapping mineral prospects: ASEG 17th Geophys. Conf. and Exhibit., Sydney 2004., Extended Abstract.
[12]
Fitton J. G. (1980). The Benue Trough and Cameroon line- A migrating rift system in West Africa. Earth and planetary Science Letters 51. 132-138.
[13]
Fitton J. G. (1982). Active versus passive continental rifting; evidence from west Africa rift system. Techtono physics, 94, 473-481.
[14]
Fitton J. G., & Dunlop H. M. (1985). The Cameroon line, West Africa and its bearing on the origin of oceanic and continental alkali basalt, earth and planetary science letter 72, 23-38.
[15]
Gadirov V. G., (2024). Deep geological models of the ultra-deep well area Saatly DW-1 based on complex geophysical data. Geodynamics 1 (36) 63-73.
Grant N. K., & Martin C. (1972). Integration of Aeromagnetic anomalies by use of characteristics curves, Geophysics No 31. 135-148.
[17]
Hsu, S. K., Sibuet J. C., &. Shyu C. T. (1996). High resolution detection of geological boundaries from potential field anomalies: An enhanced analytic signal technique. Geophysics, 61, 373-386.
[18]
Maunde, A. (2026). Modelling the subsurface geometries of dyke body through ground magnetic derivatives response. Journal of Geology and Mining Research. Vol. 17(1), pp. 3-14,
McCurry P. (1970). The geology of Precambrian to lower Palaeozoic rocks of northern Nigeria- a review in Kogbe C. A (Ed), Geology of Nigeria, Elizabethan press, Lagos. 15-39.
[20]
Moreau C., Regnoult J. M., Deruelle B., & Robineu, B. (1987). A New Tectonic model for the Cameroon line, central Africa. Tectonic Physics, 139, 317-334.
[21]
Odia E. B. (1989). Regional magnetic lineament in the Younger Granites province of northern Nigeria. Journal of mining and geology, 25 (1&2). 233-240.
[22]
Oluyide, P. O. (1988), Structural Trends in the Nigerian Basement Complex, Precambrian geology of Nigeria, Geo. Surv. of Nigeria, 93-98.
[23]
Pilkington, M., & P. Keating, (2004). Contact mapping from gridded magnetic data – a comparison of techniques: Exploration Geophysics, 35, 306-311.
[24]
Rahaman M. A. (1976). A review of the Basement complex of SW Nigeria. In Kogbe C. A. (editor) Elizabeth Pub. Co. Lagos. Pp14-58.
[25]
Rahaman, M. A. 1988, recent advances in the study of the basement complex in Nigeria. In: P. O. Oluyide (coordinator). Precambrian Geology of Nigeria. Geol. Surv. Nig. Pub. Pp. 11-43.
[26]
Vagif Gadirov, Ekrem Kalkan, Adil Ozdemir, Avaz Mammadov, Ali Novruzov, Kamran Gadirov, (2026). Gravity and magnetic exploration for unconventional oil and gas traps in buried volcanic formations. International Journal of Earth Sciences Knowledge and Applications 8 (1), 53-63.
Maunde, A., Hammaadama, Z. M., Baba, S., Bassey, N. E. (2026). Ground Magnetic Mapping and Localization of Potential Bearing Zones for Mineralization. International Journal of Mineral Processing and Extractive Metallurgy, 11(2), 20-28. https://doi.org/10.11648/j.ijmpem.20261102.11
Maunde, A.; Hammaadama, Z. M.; Baba, S.; Bassey, N. E. Ground Magnetic Mapping and Localization of Potential Bearing Zones for Mineralization. Int. J. Miner. Process. Extr. Metall.2026, 11(2), 20-28. doi: 10.11648/j.ijmpem.20261102.11
Maunde A, Hammaadama ZM, Baba S, Bassey NE. Ground Magnetic Mapping and Localization of Potential Bearing Zones for Mineralization. Int J Miner Process Extr Metall. 2026;11(2):20-28. doi: 10.11648/j.ijmpem.20261102.11
@article{10.11648/j.ijmpem.20261102.11,
  author = {Abubakar Maunde and Zarau Murtala Hammaadama and Saidu Baba and Nsikak Edet Bassey},
  title = {Ground Magnetic Mapping and Localization of Potential Bearing Zones for Mineralization},
  journal = {International Journal of Mineral Processing and Extractive Metallurgy},
  volume = {11},
  number = {2},
  pages = {20-28},
  doi = {10.11648/j.ijmpem.20261102.11},
  url = {https://doi.org/10.11648/j.ijmpem.20261102.11},
  eprint = {https://article.sciencepublishinggroup.com/pdf/10.11648.j.ijmpem.20261102.11},
  abstract = {Geomagnetic exploration techniques largely determine the subsurface geometry and spatial distribution of rock magnetization and have been used to delineate the geometry and potential zones for economic mineralization. This study used outcrops and ground magnetic data collected over parts of Hawal Massif, northeastern Nigeria to determine the subsurface spatial distribution of rock magnetization and potential bearing zones for local mineralization. The geological investigation shows that the Hawal Massif is predominantly underlain by the Precambrian Basement rocks that include granites, gneisses and diorites. These rock units are largely affected by tensile and shear fractures. The latter largely trends in the NE-SW and NW-SE directions. The results also demonstrate that the geometry and potential targets for local mineralization consistently correlate with positive local maxima in total magnetic intensity (TMI) anomalies - those recording residual magnetic values between 180 nT and 350 nT. These zones of local total magnetic intensity (TMI) maxima occurred around Chicago, Jalingo Maiha and Dumo areas and thus represent potential target zones for local mineralization. Consequently, recognizing the effectiveness of ground magnetic data is crucial, as it provides information on the geometry and potential bearing zones for local mineralization, a parameter directly affecting selection of sites for detailed geological mapping, mineral resource assessment and mining activities.},
 year = {2026}
}
TY  - JOUR
T1  - Ground Magnetic Mapping and Localization of Potential Bearing Zones for Mineralization
AU  - Abubakar Maunde
AU  - Zarau Murtala Hammaadama
AU  - Saidu Baba
AU  - Nsikak Edet Bassey
Y1  - 2026/06/15
PY  - 2026
N1  - https://doi.org/10.11648/j.ijmpem.20261102.11
DO  - 10.11648/j.ijmpem.20261102.11
T2  - International Journal of Mineral Processing and Extractive Metallurgy
JF  - International Journal of Mineral Processing and Extractive Metallurgy
JO  - International Journal of Mineral Processing and Extractive Metallurgy
SP  - 20
EP  - 28
PB  - Science Publishing Group
SN  - 2575-1859
UR  - https://doi.org/10.11648/j.ijmpem.20261102.11
AB  - Geomagnetic exploration techniques largely determine the subsurface geometry and spatial distribution of rock magnetization and have been used to delineate the geometry and potential zones for economic mineralization. This study used outcrops and ground magnetic data collected over parts of Hawal Massif, northeastern Nigeria to determine the subsurface spatial distribution of rock magnetization and potential bearing zones for local mineralization. The geological investigation shows that the Hawal Massif is predominantly underlain by the Precambrian Basement rocks that include granites, gneisses and diorites. These rock units are largely affected by tensile and shear fractures. The latter largely trends in the NE-SW and NW-SE directions. The results also demonstrate that the geometry and potential targets for local mineralization consistently correlate with positive local maxima in total magnetic intensity (TMI) anomalies - those recording residual magnetic values between 180 nT and 350 nT. These zones of local total magnetic intensity (TMI) maxima occurred around Chicago, Jalingo Maiha and Dumo areas and thus represent potential target zones for local mineralization. Consequently, recognizing the effectiveness of ground magnetic data is crucial, as it provides information on the geometry and potential bearing zones for local mineralization, a parameter directly affecting selection of sites for detailed geological mapping, mineral resource assessment and mining activities.
VL  - 11
IS  - 2
ER  -