Research Article | | Peer-Reviewed

Nutritional Characteristics of Cowpea Accessions from Peleforo Gon Coulibaly University’s Seed Bank

Received: 23 October 2024     Accepted: 11 November 2024     Published: 8 September 2025
Views:       Downloads:
Abstract

The knowledge of the varietal diversity of a species is essential in various programs for its genetic improvement. This study aimed to determine the nutritional composition of the seeds of cowpea accessions from Peleforo GON COULIBALY University’s gene bank in Korhogo. Study was conducted based on eight (8) nutritional parameters: protein, moisture and ash content, carbohydrates, lipids, reducing sugars, dry matter, and energy value. Results showed that different parameters assessed were stable within an accession, as indicated by the low coefficients of variation recorded. Additionally, seeds of the accessions from Peleforo GON COULIBALY University’s seed bank are rich in proteins, with values ranging from 22.52% to 33.07%, and in carbohydrates, with values between 38.72% and 52.73%. The lowest contents were found for reducing sugars (between 0.59% and 14.54%) and ash (between 3.17% and 5.35%). Multivariate analyses allowed for the classification of the accessions into three (3) nutritional groups. These groups were distinguished by their energy value and lipid content. Group 1, which contains 11 accessions, is characterized by a high energy value (392.93 kcal) and a high lipid content (12.08%). Group 2, with 4 accessions, has a low energy value (363.69 kcal) and a medium lipid content (9.80%). Group 3 includes 17 accessions with an average energy value (370.41 kcal) and a low lipid content (8.18%). Group 1 genotypes should benefit from a cowpea improvement programme.

Published in International Journal of Nutrition and Food Sciences (Volume 14, Issue 5)
DOI 10.11648/j.ijnfs.20251405.11
Page(s) 280-288
Creative Commons

This is an Open Access article, distributed under the terms of the Creative Commons Attribution 4.0 International License (http://creativecommons.org/licenses/by/4.0/), which permits unrestricted use, distribution and reproduction in any medium or format, provided the original work is properly cited.

Copyright

Copyright © The Author(s), 2025. Published by Science Publishing Group

Keywords

Cowpea, Seed Bank, Accessions, Nutritional Traits

1. Introduction
Cowpea (Vigna unguiculata (L.) Walp) is one of the main food and forage legumes in African, from where it originates. It is primarily cultivated in tropical regions, particularly in southern Sahara areas . It constitutes the most important legume in the tropical regions of Africa . Its cultivation plays a crucial role in nutritional balance and rural economy. It is characterized by its high protein content. Nutritionally, due to its composition of essential amino acids, it holds a prominent place as it provides significant source of protein and energy for both humans and animals in developing countries, where access to animal-derived proteins is limited . Its protein content ranges from 22% to 30% of the dry weight of seeds and leaves, and from 13% to 17% in the pods . Due to its protein richness, Vigna unguiculata (L.) Walp has been called the “meat” of the poor. It has the potential to address the significant protein deficiencies recorded in developing countries, where food shortages remain a major contemporary issue .
In Côte d’Ivoire, despite its importance, cowpea remains a marginal crop, with production around 36,310 tons per year, representing less than 2% of Africa’s production . Furthermore, the agromorphological and nutritional characteristics of local cowpea ecotypes are largely unknown. However, research conducted by Assouman et al. (2021, 2024) in northern Côte d’Ivoire has led to the establishment of a seed bank of purified cowpea genotypes at Peleforo GON COULIBALY University. Nevertheless, the biochemical characteristics of the accessions from this seed bank are not yet known. This study therefore aims to describe the nutritional characteristics of seeds of 32 cowpea genotypes from this bank.
2. Materials and Methods
2.1. Plant Material
The plant material consisted of seeds from 32 purified cowpea accessions from the Peleforo GON COULIBALY University’s seed bank established through Assouman et al. (2021) . These accessions were collected in several growing areas in the north of Côte d'Ivoire.
2.2. Assessment of the Nutritional Characteristics of Collected Cowpea Seeds
Eight biochemical and nutritional variables were measured. These were: water content (WC), lipid content (Lip), reducing sugars (RS), protein content (PC), ash content (AC), total carbohydrate content (Glu), dry matter content (DM) and energy value (EV).
2.3. Determination of Dry Matter and Lipid Content of Seeds
The water content and dry matter of the seeds were determined using AOAC method 925.40 (1997) . This consists of drying 100 seeds in an oven at 105°C for 4 hours until a constant weight is obtained. Calculations were then made using the following formulae:
DM%=m2-m0m1-m0 X 100(1)
WC%=m1-m2m0X 100(2)
DM: Dry matter expressed as a percentage, WC: water content expressed as a percentage, m1: mass of the filled capsule before drying (g), m2: mass of the filled capsule after drying (g) and m0: mass of the test sample (g).
2.4. Determination of Lipid Content in Seeds
The lipid was extracted from the seeds using the classic soxhlet method in accordance with the modified ISO/659 standard, known as the giant soxhlet. The test sample (TS) or 100g of ground seeds wrapped in cotton was placed in a stapled filter paper that had been previously weighed. Let M1 be the mass of the entire assembly (filter paper + test sample + cotton) before extraction. The filter paper containing the seeds was placed in the extractor, at the bottom of which is attached an extraction flask. The flask was placed on a heating mantle at 110°C to collect the extracted oil or lipid fraction. Then, 250 ml of hexane, the oil extraction solvent, were poured into the extractor. The extraction lasted for 8 hours, after which the stapled paper was placed in an oven at 70°C for complete solvent evaporation. The filter paper containing the defatted seeds was weighed until a constant mass was achieved (M2). The lipid content (Lip) is obtained using the following formula:
Lip %=M1-M2TS100(3)
M1: mass of the assembly (stapled filters + seed + cotton) before extraction, M2: mass of the set (stapled filters + seed + cotton) after extraction, TS: test sample (100g of flour); Lip: Lipid; %: percentage.
2.5. Determination of Reducing Sugars
Reducing sugars were quantified using the Bernfeld (1955) method with 3,5-dinitrosalicylic acid (DNS). This method involves determining the concentrations of reducing sugars from 0.5g of the sample after extraction and purification, based on a standard curve plotted against the concentration and optical density of glucose solutions of known concentrations. A THERMO SCIENTIFIC Helios Omega UV-VIS spectrophotometer (USA) was used to determine the optical densities at 546 nm of the unknown concentration sugar solutions. These optical densities, referenced against the standard curve, allow for the determination of the concentration of reducing sugars in the samples.
2.6. Determination of Protein Content in Seeds
Protein content of the seeds was determined using the KJELDAHL method. The KJELDAHL method involves first measuring the total nitrogen of the sample and then estimating the protein content. This method consists of three phases: mineralization, distillation, and titration with sodium hydroxide (0.1 N). After estimating the total nitrogen, the protein content was calculated using the formula:
Protein =(g / 100g of meal) = Nitrogen x 6.25(4)
2.7. Determination of Ash Content in Seeds
Ash Content of seeds was quantified according to AOAC (2000) . In this method, the determination was performed by mineralizing a 5g sample (P0) at 550°C for 6 hours in a muffle furnace (NABERTERM, Gmbh LT9/11/B180, Germany) until all organic matter in the sample was destroyed. The weight (P1) of ash obtained after cooling in a desiccator allows for the determination of ash content using the following formula:
Ash (%)=P0-P1 x 100P0(5)
P0 = mass of the sample, P1 = mass of ash obtained
2.8. Determination of Total Carbohydrate Content of Seeds
Total carbohydrate and starch content were determined using the formulas described by Bertrand and Thomas (1910) :
Total carbohydrates %= 100-Ash+water+ proteins+fats(6)
2.9. Estimation of Energy Value
The energy value was determined by calculation, according to the formula by Coleman (1970) , using the Atwater and Rosa (1899) coefficients as follows:
Energy Value (kcal/100 g) = [(% Glucid × 4) + (% proteins × 4) + (% Lipid × 9)](7)
3. Statistical Analysis of Data
The variability of biochemical traits was assessed through descriptive statistical parameters such as mean, standard deviation, coefficient of variation (CV), and range. To structure the cowpea accessions, a Principal Component Analysis (PCA) was performed using the Statistical Package for the Social Sciences (SPSS) version 22.0 (IBM Corp., USA) to identify the nutritional parameters that contribute to the dispersion of the cowpea accessions. Pearson correlations among agromorphological traits were revealed by a diagram using rapid and semi-automated biostatistical calculations in a simple programming language with R software.
This analysis was followed by Hierarchical Ascending Classification (HAC) using XLSTAT version 2016 to group the studied accessions based on their degree of similarity using Ward’s aggregation criteria. Finally, Mahalanobis distances between groups were calculated from a Discriminant Factor Analysis (DFA) conducted using STATISTICA version 7.1 (Statsoft, France).
4. Results
4.1. Variability of Nutritional Traits in Cowpea Accessions
The mean, minimum, maximum values, and coefficient of variation of the biochemical variables are summarized in Table 1. The variability expressed by the coefficient of variation was mostly low (CV < 20%). Some parameters had coefficients of variation (CV) greater than 15%, notably lipid content (22.12%) and reducing sugars (55.09%). Significant differences were observed between the minimum and maximum for protein (PC), carbohydrates (Glu), and reducing sugars (RS). The protein content of the seeds ranged from 22.52% to 33.07%, with a mean value of 25.20 ± 2.06%. Carbohydrates had a mean value of 47.25 ± 3.36%, varying between 38.683% and 52.91%. The lowest values were obtained for reducing sugars (between 0.59% and 14.54%) and ash (between 3.17% and 5.35%). All assessed traits significantly differentiated the accessions (p < 0.001).
Table 1. Elementary statistics for nutritional characteristics of cowpea accessions.

Parameters

Minimum

Maximum

Mean

Standard deviation

C V (%)

Prot (%)

22.52

33.07

25.31

2.16

8.53

Lip (%)

6.19

13.95

9.72

2.15

22.12

Glu (%)

38.72

52.73

47.14

3.49

7.40

Ash (%)

3.17

5.35

3.92

0.44

11.12

ReSu (%)

0.59

14.54

5.91

3.26

55.08

DM (%)

78.83

88.31

86.10

1.76

2.04

WC (%)

11.70

21.17

13.90

1.76

12.63

EV (kcal)

351.30

408.93

377.31

14.21

3.77

Prot: protein; Lip: fat; Glu: carbohydrate; Ash: ash; ReSu: reducing sugar; DM: dry matter; WC: water content; EV: energy value; %: percentage.
4.2. Identified Variability Factors Within Cowpea Accessions
A Principal Component Analysis (PCA) was conducted to identify the factors explaining variability among the cowpea accessions. Table 2 provides an estimate of the variability represented by each axis. Three axes with eigenvalues greater than 1 were retained. These three axes explain 81.44% of the variance present among the cowpea accessions.
The first axis describes 37.67% of the total variability. This axis was positively correlated with energy value (EV) and dry matter (DM). Moisture content was negatively correlated with this axis. Therefore, axis 1 reflects the energy value and dry matter of the seeds. The second axis explained 31.05% of the total variability. It was positively correlated with lipid (Lip) and protein (Prot) content and negatively correlated with carbohydrate content. This axis reflects the content of macromolecules (carbohydrates, lipids, and proteins). The third axis explained 12.71% of the total variability and defines the ash content (Ash).
Table 2. Eigenvalues and percentage variation expressed by the first four PCA axes.

Axis

Eigenvalue

Cumulative equity value

% Variance totale

Cumulative Var. (%)

1

3.01

3.01

37.67

37.67

2

2.48

5.49

31.05

68.72

3

1.01

6.50

12.71

81.43

Correlations factors x characteristics

Caractères

Axe 1

Axe 2

Axe 3

DM

0.966

-0.162

0.004

WC

-0.966

0.162

-0.004

EV

0.815

0.524

-0.014

Glu

0.141

-0.957

0.007

Lip

0.46

0.782

0.133

Prot

0.081

0.701

-0.335

ReSu

-0.211

0.599

-0.038

Ash

0.014

-0.07

0.959

Prot: protein; Lip: fat; Glu: carbohydrate; Ash: ash; ReSu: reducing sugar; DM: dry matter; MW: water content; EV: energy value; %: percentage. Figures in bold show that the correlation of the variable on the factorial axis is greater than 0.7.
4.3. Relationships Among Nutritional Parameters of Cowpea Seeds
The analysis of the diagram showing Pearson correlation among the nutritional parameters revealed two groups of traits: (i) Energy Value (EV), Lipid (Lip), and dry matter (DM), and (ii) Glucid content (Glu), ash, reducing sugars, and proteins (Figure 1).
The correlation matrix analysis showed strong and significant links between several pairs of biochemical parameters (Table 3). Accessions with high energy values exhibited high lipid content (r = 0.88; p < 0.001), high dry matter (r = 0.66; p < 0.001), and low carbohydrate levels in the seeds (r = -0.37; p = 0.040). Furthermore, accessions with high carbohydrate content in the seeds displayed low protein content (r = -0.73; p < 0.001) and low lipid content (r = -0.66; p < 0.001).
4.4. Structuring of Accessions Collected From Nutritional Parameters
A Hierarchical Ascending Classification (HAC), an Analysis of Variance (ANOVA) on the identified groups, and a Discriminant Factor Analysis (DFA) were conducted to identify and determine the nature and degree of divergence among the cowpea accessions from Peleforo GON COULIBALY University (UPGC) collection.
Dendrogram constructed from biochemical parameters’ studied allowed for the distribution of accessions into three morphological groups at a truncation of 30 Euclidean distances (Figure 2).
Group 1 consists of accessions NFE011, NOU02, NTE03, NSI01, NKO08, NTE012, NKO03, NOU05, NTE02, NBO04, and NTE015, representing 34.38% of the accessions. Group 2 is made up of 12.5% of the accessions: NKN02, NKO01, NBO013, and NSI02. Group 3 comprises 65.63% of the cowpea accessions (NBO014, NTE014, NOU011, NTE011, NKO011, NBO011, NOU06, NOU03, NFE02, NOU013, NOU04, NKN01, NBO012, NFE012, NTE013, NBO02, and NKO02). The different identified biochemical groups include accessions from various origins (administrative regions or departments).
The variance analysis conducted to differentiate the three previously identified morphological groups from the HAC revealed that energy value (EV) and lipid content (Lip) fully discriminate the groups, while carbohydrate content (Glu), dry matter (DM), and moisture content (MC) allowed for partial discrimination of the groups (Table 4).
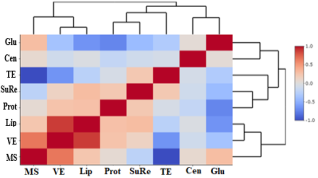
Figure 1. Pearson correlation diagram between biochemical and nutritional parameters.
Table 3. Matrix of correlations between biochemical parameters used to assess diversity of accessions.

Variables

Prot

Lip

Glu

Ash

ReSu

DM

WC

EV

Prot

0.128

˂0.001

0.310

0.217

0.742

0.742

0.150

Lip

0.275

< 0.001

0.896

0.090

0.182

0.182

< 0.001

Glu

-0.73*

-0.66*

0.825

0.016

0.099

0.099

0.040

Ash

-0.19

-0.02

0.041

0.555

0.693

0.693

0.569

ReSu

0.22

0.30

-0.42

-0.108

0.217

0.217

0.460

DM

0.06

0.24

0.30

0.07

-0.224

< 0.001

< 0.001

WC

-0.06

-0.24

-0.30

-0.07

0.22

-1.000

< 0.001

EV

0.26

0.88*

-0.37*

-0.10

0.14

0.66**

-0.66**

Prot: protein; MG: fat; Glu: carbohydrate; Cend: ash; SucRed: reducing sugar; DM: dry matter; WC: water content; EV: energy value. Values in bold indicate significant correlations at the alpha = 0.05 and 0.01 level.
Values in bold with (*) indicate significant correlations at the alpha = 0.01 level.
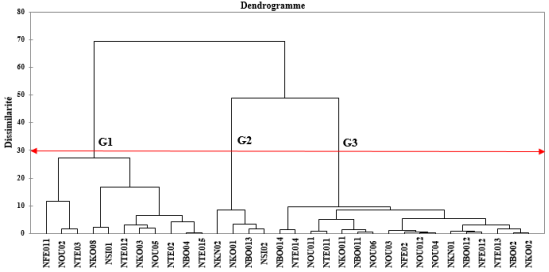
Figure 2. Structuring of collected cowpea accessions using a hierarchical ascending classification (HAC) based on biochemical and nutritional characteristics.
Table 4. Comparison of the means of nutritive traits in three groups of cowpea accessions identified from CAH.

Group

Prot (%)

Lip (%)

Glu (%)

Ash (%)

ReSu (%)

DM (%)

WC (%)

EV (kcal/100g)

G1

26.55±3.1

12.08±1.3a

44.49±2.8b

3.97±0.59

6.89±3.56

87.09±1.01a

12.91±1.01b

392.93±10.43a

G2

25.18±0.67

9.80±0.59b

43.68±2.22b

3.91±0.23

9.03±3.74

82.58±1.78b

17.42±1.78a

363.69±2.81c

G3

24.54±0.96

8.18±1.19c

49.66±1.71a

3.90±0.35

7.55±2.23

86.28±0.79a

13.72±0.79b

370.41±3.85b

F

3.48

36.37

24.16

0.07

4.73

29.74

29.74

31.64

P

0.54

˂0.001

˂0.001

0.94

0.06

˂0.001

˂0.001

˂0.001

Prot: protein; MG: fat; Glu: carbohydrate; Ash: ash; ReSu: reducing sugar; DM: dry matter; WC: water content; VE: energy value. ANOVA significance level 5% (p=0.05).
Means followed by the same letter in the same column are equal according to the Newman-Keuls test with a threshold of 5%.
4.5. Typology of Cowpea Accessions Collected by Discriminant Factor Analysis Based on Biochemical and Nutritional Parameters
The Discriminant Factor Analysis (DFA), significant according to Wilks’ Lambda test (F = 30.283; p < 0.001), revealed that two main traits allow for the discrimination of the groups established from the Hierarchical Ascending Classification (HAC). These are the Energy Value (EV) and fat content (Lip) (Table 5). Graphical representation of the canonical discriminant analysis of the accessions in the 1-2 plane of the DFA (Figure 3) indicates that the three obtained groups are not distinctly separate:
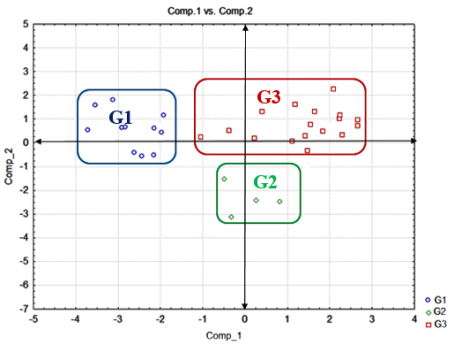
Figure 3. Representation of the different groups in the canonical discriminant plane formed by the canonical components 1 and 2 of the DFA.
Group 1 consists of accessions NFE011, NOU02, NTE03, NSI01, NKO08, NTE012, NKO03, NOU05, NTE02, NBO04, and NTE015. This group is characterized by high energy value (EV = 392.93 ± 10.43 kcal) and high lipid content (Lip = 12.08 ± 1.3%).
Group 2 contains accessions NKN02, NKO01, NBO013, and NSI02. These individuals exhibit low energy value (EV = 363.69 ± 2.81 kcal) and medium lipid content (Lip = 9.80 ± 0.59%).
Group 3 includes accessions NBO014, NTE014, NOU011, NTE011, NKO011, NBO011, NOU06, NOU03, NFE02, NOU013, NOU04, NKN01, NBO012, NFE012, NTE013, NBO02, and NKO02. These accessions present average energy value (EV = 370.41 ± 3.85 kcal) and low lipid content (Lip = 8.18 ± 1.19%).
The Mahalanobis distances presented in table 6 show that distances separating the different classes are significant (p < 0.05). Groups 1 and 2 are separated by 18.11. Next, group 2 and group 3 are separated by 17.85. Finally, group 1 and group 3 are separated by 10.93. The ranking matrix shows that all three are well classified (Table 7).
The results of the study on the nutritional diversity of 32 cowpea accessions collected in northern Côte d’Ivoire indicate that they are structured into three groups. These groups are not superimposed on geographical origins. Biochemical parameters such as energy value (EV) and fat content (Lip) of the seeds facilitated the discrimination of the revealed nutritional groups.
Table 5. Summary of discriminant analysis of nutritional characteristics.

Characters

Wilk (Lambda)

F d’exc. (2.14)

P level

Lipids

0.314275

30.02154

˂ 0.001

Energy Value

0.284922

25.90996

˂ 0.001

Table 6. Mahalanobis distances squared between the different groups.

Group 1

Group 2

Group 3

Group 1

18.11

10.93

Group 2

p˂0.001

17.85

Group 3

p˂0.001

p˂0.001

G1: Group 1; G2: Group 2; G3: Group 3
Table 7. Group reclassification matrix based on nutritional characteristics.

From /To

Group 1

Group 2

Group 3

% Correct

Group 1

11

100

Group 2

4

100

Group 3

17

100

4

7

21

100

G1: Group 1; G2: Group 2; G3: Group 3
5. Discussion
The physicochemical characterization of cowpea seeds from various accessions has enabled the development of a nutritional profile for cowpea seeds in northern Côte d’Ivoire. The variability expressed by the coefficient of variation was low for most of the parameters. This may be attributed to the fact that these accessions have been purified through prior work conducted by Assouman et al. (2024) . The different evaluated genotypes are likely pure lines.
The average ash content of the cowpea seeds in this study was 3.93%, with a variation ranging from 3.17% to 5.35%. These results are consistent with those of Herken et al. (2007) , Mebdoua (2011) , and Boye et al. (2016) . The average protein content of the studied cowpea accessions ranged between 22.52% and 33.07%. These values corroborate those reported by Mebdoua (2011) and Boye et al. (2016) . In addition to their richness in proteins, the cowpea accessions are also high in carbohydrates, further confirming that cowpea is a leguminous plant. The high carbohydrate content is supported by the findings of Huang et al. (2007) and Adebooye and Singh (2008) . This elevated level of carbohydrates and proteins clearly indicates that cowpea seeds are an energy-rich food source. Thus, the average energy value of 377.31 kcal/100g serves as an indicator of this. This value is like that obtained by Koko et al. (2016) , which is approximately 368.92 kcal/100g, and is also comparable to the energy value of 360.67±2.43 kcal/100g reported by Chinma et al. (2008) for the Akidi cultivar in Nigeria.
The various multivariate analyses conducted on the nutritional variables allowed for the classification of the accessions into three groups. These groups were distinguished solely by two nutritional parameters: energy value and lipid content. Group 1 is characterized by high lipid content and high energy value; Group 2 has low lipid content and low energy value; and Group 3 exhibits average lipid content and average energy value. These results indicate that other evaluated parameters, such as proteins, carbohydrates, reducing sugars, dry matter, and water content, vary little from one accession to another within the cowpea at Peleforo GON COULIBALY University’s collection. Furthermore, since the energy value is determined from three parameters (lipids, carbohydrates, and proteins), it can be asserted that only the lipid content differs among the cowpea groups in the collection.
6. Conclusion
The present study has facilitated the evaluation of the diversity of cowpea genotypes from Peleforo GON COULIBALY University’s gene bank across eight nutritional parameters. It has been determined that each evaluated parameter remains stable within an accession. The study also demonstrated that the cowpea seeds from this bank are rich in proteins and carbohydrates, with the lowest contents found in ash and reducing sugars. The structuring of the accessions based on nutritional parameters has led to the grouping of the different genotypes into three (3) nutritional groups. These groups were discriminated based on lipid content, which varied significantly from one group to another.
Acknowledgments
The authors would like to thank all those who contributed to the success of this study. In particular, the farmers and technicians of the university botanical garden.
Author Contributions
Assouman Jean Simon Konan: Conceptualization, Formal Analysis, Writing – original draft, Writing
Deless Edmond Thiemele: Formal Analysis
Yacouba Bakayako: Writing; review & editing
Didier Martial Yao Saraka: Conceptualization and Supervision
Nafan Darrassouba: Conceptualization and Supervision, Funding acquisition, Validation
Abbreviations

AC

Ash Content

CV

Coefficient of Variation

DFA

Discriminant Factor Analysis

DM

Dry Matter Content

EV

Energy Value

Glu

Total Carbohydrate Content

HAC

Hierarchical Ascending Classification

Lip

Lipid Content

PC

Protein Content

PCA

Principal Component Analysis

RS

Reducing Sugars

UPGC

Université Peleforo GON COULIBALY

WC

Water Content

Conflicts of Interest
The authors declare no conflicts of interest.
References
[1] Sawadogo, Evaluation de la production du niébé [Vigna unguiculata (L.) Walpers] en condition de stress hydrique: Contribution au phénotypage et à la sélection du niébé pour la résistance à la sécheresse, Mém. Fin Cycle Diplôme D’ingénieur Dév. Rural Option Agron. N-2009, Agro Juin Univ. Polytech. Bobo Dioulasso 90p, (2009).
[2] Jakai L. E. N. & Adalla C. B., 1997. Pest management... - Google Scholar, (n.d.).
[3] B. M. A. Denise, K. N. Jacob, S. D. Faustin, B. E. Kouadio, T. D. Charlotte, S. J. Gogbeu, A. Koutoua, K. N. B. Clovis, Y. S. E. Salomé, K. Y. Justin, Evaluation des composantes du rendement de 16 variétés de niébé (Vigna unguiculata (L.) Walp, Fabaceae) en provenance de quatre régions de la Côte d’Ivoire, (n.d.).
[4] S. A. Tarawali, B. B. Singh, M. Peters, S. F. Blade, Cowpea haulms as fodder, Adv. Cowpea Res. (1997) 313.
[5] C. A. Koko, M. Diomande, B. K. Kouame, E.-S. S. Yapo, J. N. Kouassi, Caractérisation physicochimique des graines de quatorze variétés de niébé (Vigna unguiculata L. Walp) de Côte d’Ivoire/ [Physiochemical characterization of seeds of fourteen varieties of cowpea (Vigna unguiculata L. Walp) from Côte d’Ivoire], Int. J. Innov. Appl. Stud. 17 (2016) 496.
[6] J. S. K. Assouman, N. Diarrassouba, S. D. M. Yao, Preliminary study on morphological diversity of cowpea accessions [Vigna unguiculata (L.) Walp.] collected in the North of Côte d’Ivoire, Int. J. Curr. Res. Biosci. Plant 8 (2021) 1–12.
[7] J. S. K. Assouman, S. D. M. Yao, E.-B. K. Zadjehi, C. Abibata, N. Diarrassouba, Test of Homogeneity and Agromorphological Characteristics of Six Cowpea Lines From the Gene Bank of the University Peleforo Gon Coulibaly of Korhogo (Côte d’Ivoire), J. Agric. Sci. Vol. 16, No. 8; 2024 (2024) 93.
[8] AOAC., Moisture in nuts and nut products. Method 925.40, Off. Methods Anal. 16th Ed. Software® Adobe E-DOCCJS (1997).
[9] L. E. N. Jackai, C. B. Adalla, Pest management practices in cowpea: a review, Adv. Cowpea Res. (1997) 240.
[10] D. Bernfeld, Analyse β et α, in methods in enzymology 1, SP Colowick end NOK, (1955).
[11] A. International, Official methods of analysis of AOAC International, AOAC international, 2000.
[12] G. Bertrand, P. Thomas, Guide pour les manipulations de chimie biologique, Dunod et Pinat, 1913.
[13] C. H. Coleman, Calculations Used, in Food Analysis, Defense Subsistence Testing Laboratory, 1968.
[14] W. O. Atwater, E. B. Rosa, A New Respiration Calorimeter and Experiments on the Conservation of Energy in the Human Body, II, Phys. Rev. Ser. I 9 (1899) 214–251.
[15] E. N. Herken, Ş. İbanoğlu, M. D. Öner, N. Bilgiçli, S. Güzel, Effect of storage on the phytic acid content, total antioxidant capacity and organoleptic properties of macaroni enriched with cowpea flour, J. Food Eng. 78 (2007) 366–372.
[16] S. MEBDOUA, Caractérisation physico-chimique de quelques populations de niébé (Vigna unguiculata L. Walp.), PhD Thesis, 2011.
[17] J. Huang, H. A. Schols, J. J. van Soest, Z. Jin, E. Sulmann, A. G. Voragen, Physicochemical properties and amylopectin chain profiles of cowpea, chickpea and yellow pea starches, Food Chem. 101 (2007) 1338–1345.
[18] H. Boyé, M. de Vivo, The environmental and social acceptability of dams, Field Actions Sci. Rep. J. Field Actions (2016).
[19] Adebooye, V. Singh, Physico-chemical properties of the flours and starches of two cowpea varieties (Vigna unguiculata (L.) Walp), Innov. Food Sci. Emerg. Technol. 9 (2008) 92–100.
[20] C. E. Chinma, I. C. Alemede, I. G. Emelife, Physicochemical and functional properties of some Nigerian cowpea varieties., (2008).
Cite This Article
  • APA Style

    Konan, A. J. S., Thiemele, D. E., Bakayako, Y., Saraka, D. M. Y., Darrassouba, N. (2025). Nutritional Characteristics of Cowpea Accessions from Peleforo Gon Coulibaly University’s Seed Bank. International Journal of Nutrition and Food Sciences, 14(5), 280-288. https://doi.org/10.11648/j.ijnfs.20251405.11

    Copy | Download

    ACS Style

    Konan, A. J. S.; Thiemele, D. E.; Bakayako, Y.; Saraka, D. M. Y.; Darrassouba, N. Nutritional Characteristics of Cowpea Accessions from Peleforo Gon Coulibaly University’s Seed Bank. Int. J. Nutr. Food Sci. 2025, 14(5), 280-288. doi: 10.11648/j.ijnfs.20251405.11

    Copy | Download

    AMA Style

    Konan AJS, Thiemele DE, Bakayako Y, Saraka DMY, Darrassouba N. Nutritional Characteristics of Cowpea Accessions from Peleforo Gon Coulibaly University’s Seed Bank. Int J Nutr Food Sci. 2025;14(5):280-288. doi: 10.11648/j.ijnfs.20251405.11

    Copy | Download

  • @article{10.11648/j.ijnfs.20251405.11,
      author = {Assouman Jean Simon Konan and Deless Edmond Thiemele and Yacouba Bakayako and Didier Martial Yao Saraka and Nafan Darrassouba},
      title = {Nutritional Characteristics of Cowpea Accessions from Peleforo Gon Coulibaly University’s Seed Bank
    },
      journal = {International Journal of Nutrition and Food Sciences},
      volume = {14},
      number = {5},
      pages = {280-288},
      doi = {10.11648/j.ijnfs.20251405.11},
      url = {https://doi.org/10.11648/j.ijnfs.20251405.11},
      eprint = {https://article.sciencepublishinggroup.com/pdf/10.11648.j.ijnfs.20251405.11},
      abstract = {The knowledge of the varietal diversity of a species is essential in various programs for its genetic improvement. This study aimed to determine the nutritional composition of the seeds of cowpea accessions from Peleforo GON COULIBALY University’s gene bank in Korhogo. Study was conducted based on eight (8) nutritional parameters: protein, moisture and ash content, carbohydrates, lipids, reducing sugars, dry matter, and energy value. Results showed that different parameters assessed were stable within an accession, as indicated by the low coefficients of variation recorded. Additionally, seeds of the accessions from Peleforo GON COULIBALY University’s seed bank are rich in proteins, with values ranging from 22.52% to 33.07%, and in carbohydrates, with values between 38.72% and 52.73%. The lowest contents were found for reducing sugars (between 0.59% and 14.54%) and ash (between 3.17% and 5.35%). Multivariate analyses allowed for the classification of the accessions into three (3) nutritional groups. These groups were distinguished by their energy value and lipid content. Group 1, which contains 11 accessions, is characterized by a high energy value (392.93 kcal) and a high lipid content (12.08%). Group 2, with 4 accessions, has a low energy value (363.69 kcal) and a medium lipid content (9.80%). Group 3 includes 17 accessions with an average energy value (370.41 kcal) and a low lipid content (8.18%). Group 1 genotypes should benefit from a cowpea improvement programme.
    },
     year = {2025}
    }
    

    Copy | Download

  • TY  - JOUR
    T1  - Nutritional Characteristics of Cowpea Accessions from Peleforo Gon Coulibaly University’s Seed Bank
    
    AU  - Assouman Jean Simon Konan
    AU  - Deless Edmond Thiemele
    AU  - Yacouba Bakayako
    AU  - Didier Martial Yao Saraka
    AU  - Nafan Darrassouba
    Y1  - 2025/09/08
    PY  - 2025
    N1  - https://doi.org/10.11648/j.ijnfs.20251405.11
    DO  - 10.11648/j.ijnfs.20251405.11
    T2  - International Journal of Nutrition and Food Sciences
    JF  - International Journal of Nutrition and Food Sciences
    JO  - International Journal of Nutrition and Food Sciences
    SP  - 280
    EP  - 288
    PB  - Science Publishing Group
    SN  - 2327-2716
    UR  - https://doi.org/10.11648/j.ijnfs.20251405.11
    AB  - The knowledge of the varietal diversity of a species is essential in various programs for its genetic improvement. This study aimed to determine the nutritional composition of the seeds of cowpea accessions from Peleforo GON COULIBALY University’s gene bank in Korhogo. Study was conducted based on eight (8) nutritional parameters: protein, moisture and ash content, carbohydrates, lipids, reducing sugars, dry matter, and energy value. Results showed that different parameters assessed were stable within an accession, as indicated by the low coefficients of variation recorded. Additionally, seeds of the accessions from Peleforo GON COULIBALY University’s seed bank are rich in proteins, with values ranging from 22.52% to 33.07%, and in carbohydrates, with values between 38.72% and 52.73%. The lowest contents were found for reducing sugars (between 0.59% and 14.54%) and ash (between 3.17% and 5.35%). Multivariate analyses allowed for the classification of the accessions into three (3) nutritional groups. These groups were distinguished by their energy value and lipid content. Group 1, which contains 11 accessions, is characterized by a high energy value (392.93 kcal) and a high lipid content (12.08%). Group 2, with 4 accessions, has a low energy value (363.69 kcal) and a medium lipid content (9.80%). Group 3 includes 17 accessions with an average energy value (370.41 kcal) and a low lipid content (8.18%). Group 1 genotypes should benefit from a cowpea improvement programme.
    
    VL  - 14
    IS  - 5
    ER  - 

    Copy | Download

Author Information
  • Abstract
  • Keywords
  • Document Sections

    1. 1. Introduction
    2. 2. Materials and Methods
    3. 3. Statistical Analysis of Data
    4. 4. Results
    5. 5. Discussion
    6. 6. Conclusion
    Show Full Outline
  • Acknowledgments
  • Author Contributions
  • Abbreviations
  • Conflicts of Interest
  • References
  • Cite This Article
  • Author Information