A stepped spillway is a hydraulic structure built at storage and detention dams to discharge flood water that cannot be safely kept in the reservoir. It was created to minimize the kinetic energy that would have otherwise produced dangerous scour at the natural river bed beneath the spillway. They discharge this energy in floodwater using their stepping nature. Several studies show the detrimental consequences of falling water's kinetic energy on the river bed underneath the structure. Only a handful of these studies, however, have evaluated the impact of energy losses caused by stepped spillways with channel slopes 26.6° or less. As a result, there are gaps in the rules and recommendations for designers of stepped spillways with channel slopes below 26.6°. Furthermore, the existing models for forecasting energy dissipation in stepped spillways for channels of all slopes include a parameter, the friction factor, f, which is difficult to estimate with precision, leading to its subjective estimation by those involved in the stepped spillway design. The goal of this study is not only to provide designers with design recommendations and information for stepped spillways with channel slopes below 26.6°, but also to eliminate the 'troublesome' frictional factor; f. Using phase-detection intrusive probes, air-water flow tests were carried out in nappe, transitional, and skimming flows on a stepped spillway with channel slope below 26.6° in a large facility. New expressions for evaluating energy losses in stepped spillways with slopes 26.6° or less are developed. Regarding energy dissipation, the data from the latest models compare well with the measured data, with high coefficients of correlation that range between 0.95 and 0.99. All of the measured data and the estimated data are in good agreement. The models are simple to use.
| Published in | Journal of Civil, Construction and Environmental Engineering (Volume 10, Issue 1) |
| DOI | 10.11648/j.jccee.20251001.12 |
| Page(s) | 16-26 |
| Creative Commons |
This is an Open Access article, distributed under the terms of the Creative Commons Attribution 4.0 International License (http://creativecommons.org/licenses/by/4.0/), which permits unrestricted use, distribution and reproduction in any medium or format, provided the original work is properly cited. |
| Copyright |
Copyright © The Author(s), 2025. Published by Science Publishing Group |
Stepped Spillway, Energy Dissipation, Nappe Flow, Skimming Flow
DH | Hydraulic Diameter (m) |
dw | Equivalent Clear Water Flow Depth (m) |
dc | Critical Flow Depth (m) |
g | Gravity Constant (m/s2) |
H | Total Head (m) |
Hdam | Dam Height (m) |
Hmax | Maximum Upstream Head (m) Above Chute Toe Hmax = Hdam + 3/2×dc |
Hres | Residual Head (m) |
h | Vertical Step Height (m) |
I | Horizontal Step Length (m) |
qw | Water Discharge Per Unit Width (m2/s) |
Re | Reynolds Number Defined in Terms of the Hydraulic Diameter: Re = ρw×Uw×DH/μw |
Uw | Mean Flow Velocity (m/s): Uw = qw/d |
Uw | Average Mean Flow Velocity (m/s) for Stepped Spillway |
W | Channel Width (m) |
Y90 | Characteristic Depth (m) Where the Void Fraction Is -90% |
D | Distance (m) Measured Normal to the Invert (or Channel Bed) |
ΔH | Total Head Loss (m): ∆H = Hmax – Hres |
θ | Angle Between Pseudo-bottom Formed by the Step Edges and the Horizontal |
c | Critical Flow Conditions |
max | Maximum Value |
mean | Mean Signal Component |
w | Water Properties |
| [1] | Beitz E, Lawless M. Hydraulic Model Study for darn on GHFL 3791 lsaac River al Burton Gorge. Water Resources Commission Report, Ref. No. REP/24.1, Sept., Brisbane, Australia; 1992. |
| [2] | Bindo M, Gautier J, Lacrotx F. The Stepped Spillway of: Vl"Bah Darn. lntl Water Power and Dam Construction. 1993; 1-5(1): 35-36. |
| [3] | Boes R, Hager WH. Two-phase flow characteristics of stepped spillways. J. Hydraul. Eng. ASCE. 2003a; 129(9): 661-670. |
| [4] | Boes RM. Scale effects in modeling two-phase stepped spillway flow. In Proc. Intl. Workshop on Hydraulics of Stepped Spillways, Minor HE and Hager WH, eds. Steenwijk, The Netherlands: A. A. Balkema. 2000: 53-60. |
| [5] | Bung D, Schlenkhoff A. Prediction of oxygen transfer in self-aerated skimming flow on embankment stepped spillways, 33rd IAHR World Congress. Vancouver, Canada 123 Author's personal copy Environ Fluid Mech; 2009. |
| [6] | Bung DB. Zur selbstbelüfteten Gerinneströmung auf Kaskaden mit gemäßigter Neigung. PhD Thesis, Lehr- und Forschungsgebiet Wasserwirtschaft und Wasserbau, Bergische Universitaet Wuppertal, Germany (in German); 2009. |
| [7] | Carosi G, Chanson H. Air-water time and length scales in skimming flow on a stepped spillway. Application to the spray characterisation. Report No. CH59/06, Division of Civil Engineering, the University of Queensland, Brisbane, Australia, July; 2006. |
| [8] | Chamani R, Rajaratnam N. Jet Flow on Stepped Spillways. J. Hydraul. Engg. ASCE 1994; 120(2): 254–259. |
| [9] | Chanson H, Carosi G. Advanced post-processing and correlation analyses in high-velocity air– water flows. Environ Fluid Mech. 2007; 7(6): 495–508. |
| [10] | Chanson H, Toombes L. Air–water flows down stepped chutes: turbulence and flow structure observations. Int J Multiph Flow. 2002a; 28(11): 1737–1761. |
| [11] | Chanson H, Toombes L. Energy dissipation and air entrainment in stepped storm waterway: experimental study. J Irrig Drain Eng ASCE. 2002b; 128(5): 305–315. |
| [12] | Chanson H, Toombes L. Supercritical Flow at an Abrupt Drop: Flow Patterns and Aeration”. Can. J. Civil Eng. 1998; 25(5): 956–966. |
| [13] | Chanson H. The hydraulics of stepped chutes and spillways. Balkema, Lisse. 2001: 418. |
| [14] | Chanson H. Air bubble entrainment in open channels. Flow structure and bubble size distributions. Int J Multiph Flow. 1997a; 23(1): 193–203. |
| [15] | Chanson H. Air–water flow measurements with intrusive phase-detection probes. Can we improve their interpretation? J Hydraul Eng ASCE. 2002; 128(3): 252–255. |
| [16] | Chanson H. Measuring air–water interface area in supercritical open channel flow. Water Res. 1997b; 31(6): 1414–1420. |
| [17] | Chanson, H. 1994a. Hydraulics of skimming flows over stepped channels and spillways. Journal of Hydraulic Research, 32(3): 445-460. |
| [18] | Chanson, H. 1994b. Comparison of energy dissipation between nappe and skimming flow regimes on stepped chutes. Journal of Hydraulic Research, 32(2): 213-218. |
| [19] | Degouite G, Peyras L, Royet P. Skimming Flow in Stepped Spillways - Discussion. Jl of Hyd. Engrg., ASCE. 1992; 118(1): 111-114. |
| [20] | Essery ITS, Horner MW. The hydraulic design of stepped spillways, Rep. 33, Construction Industry Research and Information Assoc., London, U. K; 1971. |
| [21] | Felder S, Chanson H. Air–water flow properties in step cavity down a stepped chute. Int J Multiph Flow. 2011; 37(7): 732–745. |
| [22] | Felder S, Chanson H. Energy dissipation and flow resistance on flat slope stepped spillways. 5th IAHR International Symposium on Hydraulic Structures, Brisbane, Australia, 25-27 June 2014. Brisbane, Australia: The University of Queensland; 2014. |
| [23] | Felder S, Chanson H. Energy dissipation, flow resistance and gas-liquid interfacial area in skimming flows on moderate-slope stepped spillways. Environ Fluid Mech. 2009a; 9(4): 427–441. |
| [24] | Felder S, Chanson H. Turbulence, dynamic similarity and scale effects in high-velocity free surface flows above a stepped chute. Exp Fluids. 2009b; 47(1): 1–18. |
| [25] | Felder S. Air–water flow properties on stepped spillways for embankment dams: aeration, energy dissipation and turbulence on uniform, non-uniform and pooled stepped chutes. PhD Thesis, The University of Queensland, Australia; 2013. |
| [26] | Gonzalez CA. An experimental study of free-surface aeration on embankment stepped chutes. PhD Thesis, Department of Civil Engineering, The University of Queensland, Brisbane, Australia; 2005. |
| [27] | Guenther P, Felder S, Chanson H. Flow aeration, cavity processes and energy dissipation on flat and pooled stepped spillways for embankments. Environ Fluid Mech. 2013; 13(5): 503–525. |
| [28] | Ohtsu I, Yasuda Y, Takahashi M (2004) Flow characteristics of skimming flows in stepped channels. J Hydraulic Eng ASCE 130(9): 860–869. |
| [29] | Ozueigbo, O, Agunwamba J, New Equations for Energy Dissipation down a Stepped Spillway. Journal of Engineering Research and Reports 23(4): 1-14, 2022; Article no. JERR. 90654 ISSN: 2582-2926, |
| [30] | Peyras L, Royet P, Degoutte G. Flow and Energy Dissipation over Stepped Gabion Weirs." Jl of Hyd. Engrg. ASCE. 1992; 118(5): 707-717. |
| [31] | Rajaratnam N. Skimming flow in stepped spillways. J. Hydr. Engrg., ASCE. 1990; 116(4): 587-591. |
| [32] | Sorensen, RM. 1985. Stepped spillway hydraulic model investigation. Journal of Hydraulic Engineering, 111(12): 1461-1472. |
| [33] | Stefan Felder, Hubert Chanson (2014). Aeration and air–water mass transfer on stepped chutes with embankment dam slopes, Environ Fluid Mech; 2014. |
| [34] | Stephenson, D. (1991). "Energy Dissipation down Stepped Spillways." International Water Power & Dam Construction, Sept., pp. 27-30. |
| [35] | Takahashi, M., Yasuda, Y., and Ohtsu, I. (2008). Flow Patterns and Energy Dissipation over Various Stepped Chutes. Discussion. Jl of Irrigation and Drainage Engineering, ASCE, Vol. 134, No. 1, pp. 114-116. |
APA Style
Ozueigbo, O., Agunwamba, J. (2025). New Energy Loss Expression for Stepped Spillways with Channel Slopes 26.6° and Below. Journal of Civil, Construction and Environmental Engineering, 10(1), 16-26. https://doi.org/10.11648/j.jccee.20251001.12
ACS Style
Ozueigbo, O.; Agunwamba, J. New Energy Loss Expression for Stepped Spillways with Channel Slopes 26.6° and Below. J. Civ. Constr. Environ. Eng. 2025, 10(1), 16-26. doi: 10.11648/j.jccee.20251001.12
AMA Style
Ozueigbo O, Agunwamba J. New Energy Loss Expression for Stepped Spillways with Channel Slopes 26.6° and Below. J Civ Constr Environ Eng. 2025;10(1):16-26. doi: 10.11648/j.jccee.20251001.12
@article{10.11648/j.jccee.20251001.12,
  author = {Okechukwu Ozueigbo and Jonah Agunwamba},
  title = {New Energy Loss Expression for Stepped Spillways with Channel Slopes 26.6° and Below},
  journal = {Journal of Civil, Construction and Environmental Engineering},
  volume = {10},
  number = {1},
  pages = {16-26},
  doi = {10.11648/j.jccee.20251001.12},
  url = {https://doi.org/10.11648/j.jccee.20251001.12},
  eprint = {https://article.sciencepublishinggroup.com/pdf/10.11648.j.jccee.20251001.12},
  abstract = {A stepped spillway is a hydraulic structure built at storage and detention dams to discharge flood water that cannot be safely kept in the reservoir. It was created to minimize the kinetic energy that would have otherwise produced dangerous scour at the natural river bed beneath the spillway. They discharge this energy in floodwater using their stepping nature. Several studies show the detrimental consequences of falling water's kinetic energy on the river bed underneath the structure. Only a handful of these studies, however, have evaluated the impact of energy losses caused by stepped spillways with channel slopes 26.6° or less. As a result, there are gaps in the rules and recommendations for designers of stepped spillways with channel slopes below 26.6°. Furthermore, the existing models for forecasting energy dissipation in stepped spillways for channels of all slopes include a parameter, the friction factor, f, which is difficult to estimate with precision, leading to its subjective estimation by those involved in the stepped spillway design. The goal of this study is not only to provide designers with design recommendations and information for stepped spillways with channel slopes below 26.6°, but also to eliminate the 'troublesome' frictional factor; f. Using phase-detection intrusive probes, air-water flow tests were carried out in nappe, transitional, and skimming flows on a stepped spillway with channel slope below 26.6° in a large facility. New expressions for evaluating energy losses in stepped spillways with slopes 26.6° or less are developed. Regarding energy dissipation, the data from the latest models compare well with the measured data, with high coefficients of correlation that range between 0.95 and 0.99. All of the measured data and the estimated data are in good agreement. The models are simple to use.},
 year = {2025}
}
TY  - JOUR
T1  - New Energy Loss Expression for Stepped Spillways with Channel Slopes 26.6° and Below
AU  - Okechukwu Ozueigbo
AU  - Jonah Agunwamba
Y1  - 2025/01/22
PY  - 2025
N1  - https://doi.org/10.11648/j.jccee.20251001.12
DO  - 10.11648/j.jccee.20251001.12
T2  - Journal of Civil, Construction and Environmental Engineering
JF  - Journal of Civil, Construction and Environmental Engineering
JO  - Journal of Civil, Construction and Environmental Engineering
SP  - 16
EP  - 26
PB  - Science Publishing Group
SN  - 2637-3890
UR  - https://doi.org/10.11648/j.jccee.20251001.12
AB  - A stepped spillway is a hydraulic structure built at storage and detention dams to discharge flood water that cannot be safely kept in the reservoir. It was created to minimize the kinetic energy that would have otherwise produced dangerous scour at the natural river bed beneath the spillway. They discharge this energy in floodwater using their stepping nature. Several studies show the detrimental consequences of falling water's kinetic energy on the river bed underneath the structure. Only a handful of these studies, however, have evaluated the impact of energy losses caused by stepped spillways with channel slopes 26.6° or less. As a result, there are gaps in the rules and recommendations for designers of stepped spillways with channel slopes below 26.6°. Furthermore, the existing models for forecasting energy dissipation in stepped spillways for channels of all slopes include a parameter, the friction factor, f, which is difficult to estimate with precision, leading to its subjective estimation by those involved in the stepped spillway design. The goal of this study is not only to provide designers with design recommendations and information for stepped spillways with channel slopes below 26.6°, but also to eliminate the 'troublesome' frictional factor; f. Using phase-detection intrusive probes, air-water flow tests were carried out in nappe, transitional, and skimming flows on a stepped spillway with channel slope below 26.6° in a large facility. New expressions for evaluating energy losses in stepped spillways with slopes 26.6° or less are developed. Regarding energy dissipation, the data from the latest models compare well with the measured data, with high coefficients of correlation that range between 0.95 and 0.99. All of the measured data and the estimated data are in good agreement. The models are simple to use.
VL  - 10
IS  - 1
ER  -
Department of Civil Engineering, University of Nigeria, Nsukka, Nigeria
Research Fields: Civil Engineering, Water Resources, Environmental Analysis, Soil Erosion
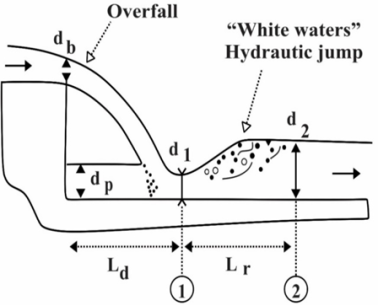
Figure 1. Nappe flow regime (Flow at a drop structure).
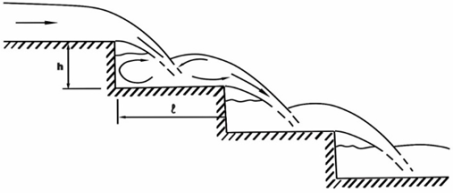
Figure 2. Nappe flow with partially developed hydraulic jump.
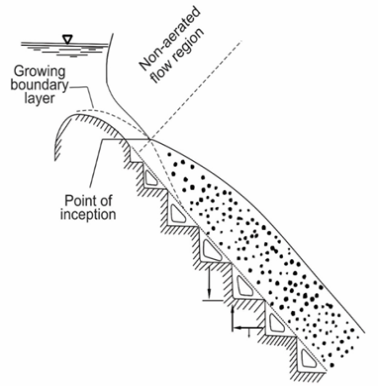
Figure 3. Skimming flow regime - Sorensen [32].
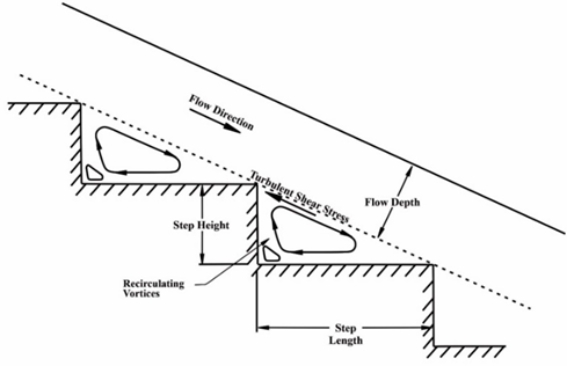
Figure 4. Skimming flow regime with uniform flow conditions.
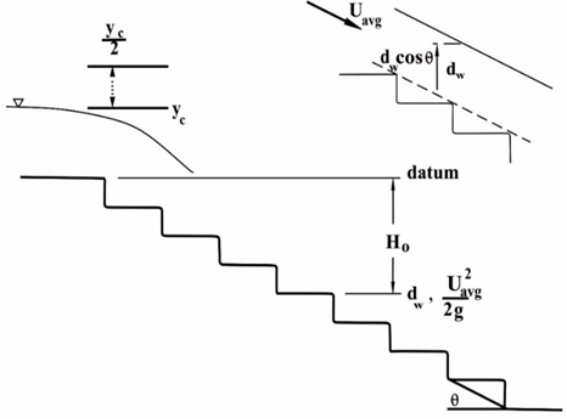
Figure 5. Arrangement of the spillway with the definition of the variables.
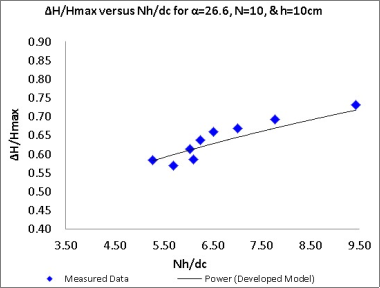
Figure 6.
∆H/Hmax as a function of Nh/dc for qw = (0.073 - 0.249 m2/s) & Re = (2.92 × 10⁵ - 9.96 × 10⁵), dc/h, of (0.80 - 1.85)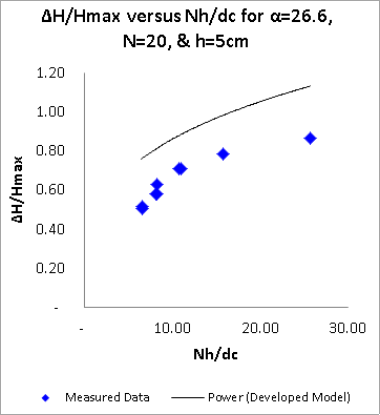
Figure 7.
∆H/Hmax as a function of Nh/dc between 4.00 and 10.00, qw = (0.020 - 0.227) m2/s & Re = (8.0 × 10⁴ - 9.08 × 10⁵), flow rate dc/h, of (0.69 - 3.30). For 𝜽 = 26.6°, N = 20, h (cm) = 5.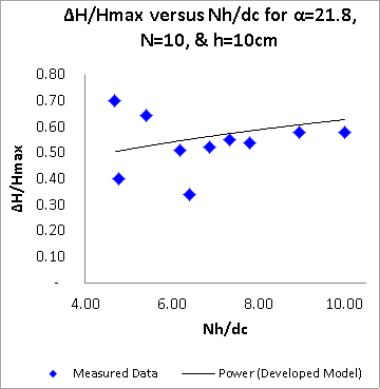
Figure 8. ∆H/Hmax as a function of Nh/dc between 5.00 and 12.00, qw = (0.095 - 0.180) m2/s, Re = (3.80 × 10⁵ - 7.20 × 10⁵), flow rate, dc/h, of (1.00 - 1.57). For 𝜽 = 21.8°, N = 10, h (cm) = 10.
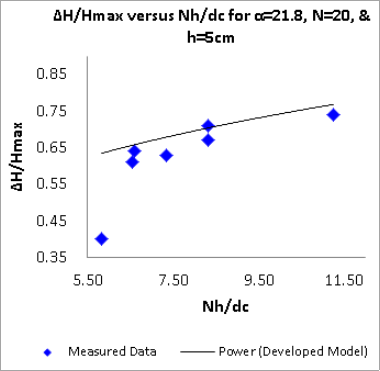
Figure 9. ∆H/Hmax as a function of Nh/dc between 5.50 and 11.00, qw = (0.059 - 0.158) m2/s, Re = (2.36 × 10⁵ - 6.32 × 10⁵), and flow rate, dc/h, of (0.80 - 1.85). For 𝜽 = 21.8°, N = 20, h (cm) = 5.
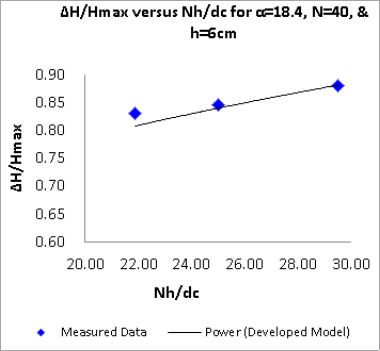
Figure 10. ∆H/Hmax as a function of Nh/dc between 21.00 and 30.00, qw = (0.059 - 0.158) m2/s, Re = (2.36 × 10⁵ - 6.32 × 10⁵), flow rate, dc/h, of (0.80 - 1.85). For 𝜽 = 15.9°, N = 18, h (cm) = 6.
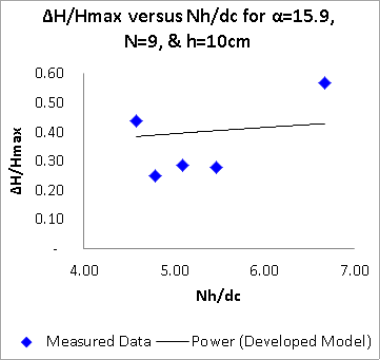
Figure 11. ∆H/Hmax as a function of Nh/dc for 𝜽 = 15.9°, N = 9, h (cm) = 10, qw = (0.069 - 0.188) m2/s, Re = (2.76 × 10⁵ - 7.52 × 10⁵), dc/h = (0.78 - 1.53).
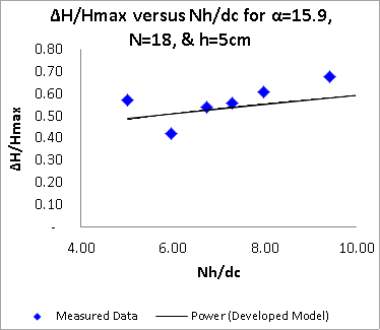
Figure 12. ∆H/Hmax as a function of Nh/dc between 4.50 and 6.60, qw = (0.069 - 0.188) m2/s, Re = (2.76 × 10⁵ - 7.52 × 10⁵), flow rate, dc/h, of (0.78 - 1.53). For 𝜽 = 15.9°, N = 9, h (cm) = 1.

Figure 13. ∆H/Hmax as a function of Nh/dc between 6.25 and 8.60, qw = (0.069 - 0.188) m2/s, Re = (2.76 × 10⁵ - 7.52 × 10⁵), flow rate, dc/h, of (0.78 - 1.53). For 𝜽 = 14.6°, N = 13, h (cm) = 10.
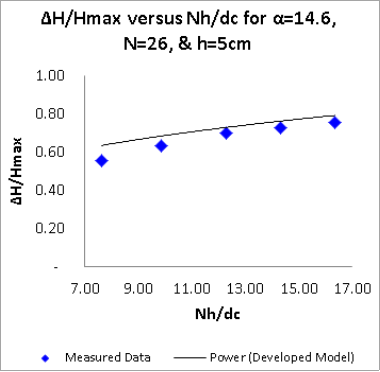
Figure 14.
∆H/Hmax as a function of Nh/dc between 6.20 and 8.00, qw = (0.05 - 0.234m2/s), Re = (2.0 × 10⁵ - 9.36 × 10⁵), & flow rate, dc/h, of (1.27 - 3.55). For 𝜽 = 14.6°, N = 26, h (cm) = 5.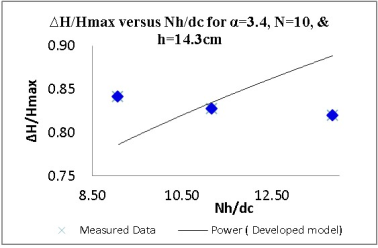
Figure 15.
∆H/Hmax as a function of Nh/dc between 8.50 and 14.00, qw = (0.035 - 0.234) m2/s, Re = (1.40 × 10⁵ - 9.36 × 10⁵), & flow rate, dc/h, of (1.0 - 3.55). For 𝜽 = 8.9°, N = 21, h (cm) = 3/6.Information

