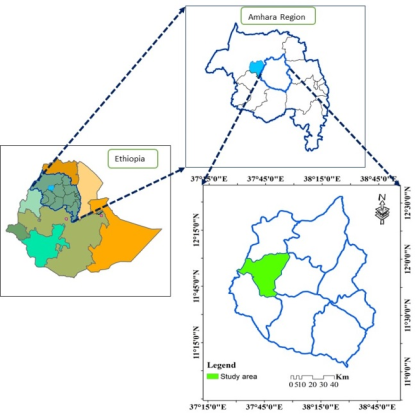
Rice (Oryza sativa L.) is increasingly becoming an important food crop in Ethiopia. However, the average rice productivity in Ethiopia is estimated at 2.8 t ha-1 which is much lower than the world average, 4.6 t ha-1. Its productivity is challenged due to a lack of appropriate and location-specific agronomic practices like the application of optimum doses of nitrogen fertilizer and the use of optimum seeding rates. Thus, a field experiment was conducted in Fogera district in South Gondar Zone, Northwestern Ethiopia during the 2021 main cropping season to determine the optimum dose of N level and seeding rate. The treatments comprised factorial combinations of four levels of N (134, 184, 234 and 284 kg ha-1) and four different seeding rates (60, 80, 100, and 120 kg ha-1). The experiment was laid out in a randomized complete block design and replicated thrice. All data on phenology, vegetative growth yield and yield-related parameters were collected and measured following scientific standards of each parameter. Those data were subjected to analysis of variance using the general linear model (GLM) procedures of SAS 9.0 version system. Economic analysis was also carried out by following CIMMYT partial budget analysis procedures. The analysis result showed the main effects of both, different levels of nitrogen and different rate of seeding, and their interactions showed highly significant effect on the number of both total and effective tillers, grain filling, panicle length, phonological parameters, totals spikelet’s, thousands seed weight, grain yield, biological yield and straw yield. Application of 184 kg N ha-1 level with a seeding rate 100 kg ha-1 gave the maximum grain yield (6,641 kg ha-1), the highest number of effective tillers per m2 (792) and filled grains per panicle (95.34). Furthermore, the highest net return of ETB 118,850 with acceptable marginal rate of return (2,313%) was also obtained from the application of 184 kg N ha-1 level and a seeding rate 100 kg ha-1. From the current research experiment, it is possible to conclude that increasing seeding rate beyond 100 kg ha-1 and N above 184 kg N ha-1 is not economical yield of rice “Selam’’ variety in the study area. Rather, use of 184 kg N ha-1 and seeding rate of 100 kg ha-1 is promising for Lowland Rice (Selam) variety production under the rain fed condition in Fogera Plains and similar agro-ecologies of rain-fed growing area of Ethiopia for better economic and agronomic advantage.
| Published in | Journal of Chemical, Environmental and Biological Engineering (Volume 8, Issue 2) |
| DOI | 10.11648/j.jcebe.20240802.12 |
| Page(s) | 52-65 |
| Creative Commons |
This is an Open Access article, distributed under the terms of the Creative Commons Attribution 4.0 International License (http://creativecommons.org/licenses/by/4.0/), which permits unrestricted use, distribution and reproduction in any medium or format, provided the original work is properly cited. |
| Copyright |
Copyright © The Author(s), 2024. Published by Science Publishing Group |
Nitrogen Rate, Seed Rate, Lowland Rice, Economic Analysis
Soil Depth (0-20cm) | Particle size % | Rating | Methods | Reference | ||
|---|---|---|---|---|---|---|
Sand | Silt | Clay | ||||
19 | 15 | 69 | Heavy Clay | Bouyoucos hydrometer | [19] | |
PH 1:25 (H2O) | 5.62 | Slightly Acidic | PH Meter | [20] . | ||
O.C (%) | 2.2 | Medium | (Walkley Black) | [15] | ||
O.M (%) | 2.61 | Medium | (Walkley- Black) | [15] | ||
TN (%) | 0.21 | Medium | Macro- Kjeldahl | [21] | ||
Av.P.(ppm) | 9.85 | Medium | Bray No.1 | [16] | ||
EC (ds/m) | 0.05 | Low | Electromagnetic induction | [18] | ||
CECCmolg | 57 | High | Ammonium acetate | [22] | ||
Seed ratekg ha-1 | Natekg ha-1 | Days of 50% heading | Days to 50%Physiological Maturity | Panicle length (cm) | Plant height (cm) |
|---|---|---|---|---|---|
60 | 134 | 96j | 135k | 15.86f | 89.6fe |
184 | 102.6g | 144.6h | 21a | 98.46bdc | |
234 | 110d | 159d | 17.33e | 98.76bdc | |
284 | 118a | 174a | 21a | 108.3a | |
80 | 134 | 94k | 131l | 15gh | 93.26fed |
184 | 102hg | 142i | 19c | 103.1ba | |
234 | 107e | 152f | 16f | 103.66ba | |
284 | 116b | 170b | 19.86b | 104ba | |
100 | 134 | 93k | 129m | 14.5ih | 94.9fedc |
184 | 101h | 140j | 19c | 103.4ba | |
234 | 106e | 152f | 15.5gf | 103.63ba | |
284 | 115cb | 168c | 19.93b | 107.33a | |
120 | 134 | 90l | 124n | 13.8j | 88.66f |
184 | 98.3i | 135k | 18d | 96.93bedc | |
234 | 104f | 148g | 14ij | 101.4ac | |
284 | 114.6c | 167c | 18d | 102.8ba | |
LSD | 0.636** | 1.17** | 0.63** | 7.42 ** | |
SE | 0.58 | 0.49 | 0.14 | 19.8 | |
Mean | 104.2 | 148.3 | 17.5 | 99.6 | |
CV% | 0.73 | 0.47 | 2.17 | 4.45 |
N rate kg ha-1 | TSPP | UFGPP % |
|---|---|---|
134 | 89.13d | 15.3a |
184 | 96.34c | 5.6c |
234 | 109.39b | 8.83b |
284 | 114.87a | 11a |
LSD | 1.66*** | 1.08** |
SE | 3.98 | 1.7 |
CV% | 1.94 | 12.62 |
SRkg ha -1 | NRkg ha-1 | ET% | TT№ | NET% | FGPP % | TSW (gram) | AGDBY ton ha-1 | GY ton ha -1 |
|---|---|---|---|---|---|---|---|---|
60 | 134 | 328m | 368j | 40bc | 86.93f | 26.22g | 9.12f | 3.0k |
` | 184 | 512ji | 555g | 43becd | 94.2ab | 28.82de | 14.27.d | 4.36i |
234 | 560gf | 592fe | 32becd | 91.24b | 32.04b | 18.15cb | 5.007h | |
284 | 533.28ih | 568fg | 34.72bcd | 89.33bc | 29.67dc | 20.39b | 4.95h | |
80 | 134 | 400l | 448i | 48ba | 83.51gf | 26.91fg | 10.79e | 3.63j |
184 | 640de | 658.64d | 18.64ed | 84.21d | 30.04c | 21.08b | 5.54g | |
234 | 653dc | 696c | 43bc | 91.32b | 32.40b | 22.06ab | 6.33cd | |
284 | 578.64f | 602.64e | 24ecd | 89.33bc | 29.97c | 22.91.a | 6.31ed | |
100 | 134 | 496j | 544g | 48ba | 83.39g | 27.85fe | 11.91e | 3.73j |
184 | 792a | 808a | 16e | 95.34a | 33.86a | 21.73b | 6.64a | |
234 | 736b | 768b | 32becd | 91.38b | 32.49b | 22.75ab | 6.61a | |
284 | 624e | 648d | 24ed | 89.1b | 29.87dc | 24.09a | 6.23e | |
120 | 134 | 444.24k | 506.64h | 62.4a | 82.93h | 26g | 12.98fe | 3.66j |
184 | 554.64gfh | 586.64fe | 32becd | 93.57ab | 29.12dc | 23.9ab | 5.98f | |
234 | 666.14c | 680.64c | 14.5ecd | 90.65c | 32.72b | 26.41a | 6.51b | |
284 | 538.64gih | 600e | 61.36a | 88.18c | 29.66dc | 26.51a | 6.42cb | |
LSD | 3.04** | 3.63** | 1.04* | 1.04* | 1.1** | 0.86** | 90.15** | |
SE | 3.33 | 4.76 | 1.55 | 1.55 | 0.43 | 0.27 | 29.3. | |
Mean | 5667 | 600 | 35.65 | 4.45 | 29.85 | 19.04 | 5.31 | |
CV% | 2.57 | 2.89 | 28.01 | 1.78 | 2.21. | 6.21 | 1.01 |
SR | NR | SY ton ha-1 |
|---|---|---|
60 | 134 | 6.12m |
` | 184 | 9.91i |
234 | 13.15h | |
284 | 15.44f | |
80 | 134 | 7.16l |
184 | 15.54f | |
234 | 16.27g | |
284 | 16.60d | |
100 | 134 | 8.18k |
184 | 15.09gf | |
234 | 16.14e | |
284 | 18.40b | |
120 | 134 | 9.32j |
184 | 17.92c | |
234 | 19.90e | |
284 | 20.09a | |
LSD | 0.3296** | |
SE | 3.2916 | |
Mean | 13.97 | |
CV% | 1.42 |
SOV | df | DH | DM | PH | PL |
|---|---|---|---|---|---|
NR | 3 | 1095.68** | 3558.187** | 418.653** | 83.162** |
SR | 3 | 50.35** | 191.743** | 56.081ns | 16.754* |
NR*SR | 9 | 1.59* | 3.020** | 12.56ns | 1.143** |
Error | 30 | 0.581 | 0.498 | 19.828 | 0.145 |
SOV | Df | ET | NET | TT | FG |
|---|---|---|---|---|---|
NR | 3 | 2,153* | 20.97* | 1788** | 1,761** |
SR | 3 | 991.5** | 9.8* | 918.9** | 210.54* |
NR*SR | 9 | 89.6** | 3.29* | 86.0** | 56.2** |
Error | 3 | 3.331 | 1.55 | 4.761 | 2.659 |
SOV | df | AGBY | SY | GY | TSW |
|---|---|---|---|---|---|
NR | 3 | 79.08** | 221056457.1** | 17615815.2* | 66.4** |
SR | 3 | 6.326** | 51526245.7** | 537895859** | 8.1* |
NR*SR | 9 | 0.29ns | 4772653.1** | 287261.77** | 3.507** |
Error | 30 | 0.271 | 38965.9 | 2923.29 | 0.43 |
NR kgha-1 | SDkgha-1 | GB ETBha-1 | MP | LCFUA ETB ha-1 | CU ETB ha-1 | CSETBha-1 | TVCETB ha-1 | NBETB ha-1 | DA | MRR % |
|---|---|---|---|---|---|---|---|---|---|---|
134 | 60 | 56,800 | 10 | 1,000 | 4150 | 1680 | 6,830 | 49,970 | - | - |
80 | 69,330 | 12 | 1,2,00 | 4150 | 2240 | 7,590 | 61,740 | 1,549 | ||
100 | 71,200 | 11 | 1,300 | 4150 | 2800 | 8,050 | 63,160 | 309 | ||
120 | 71,080 | 10 | 1,000 | 4150 | 3360 | 8,110 | 62,970 | D | ||
184 | 60 | 83,390 | 15 | 1,500 | 5700 | 1680 | 8,880 | 74,510 | 1,390 | |
80 | 108,600 | 17 | 1,700 | 5700 | 2240 | 9640 | 98,960 | 3,210 | ||
100 | 129,350 | 20 | 2,000 | 5700 | 2800 | 10,500 | 118,850 | 2,313 | ||
120 | 118,340 | 17 | 1,700 | 5700 | 3360 | 10,760 | 107,580 | D | ||
234 | 60 | 97,330 | 21 | 2,100 | 7249 | 1680 | 11,029 | 86,301 | D | |
80 | 120,950 | 22 | 2,200 | 7249 | 2240 | 11,689 | 109,261 | 3,479 | ||
100 | 127,570 | 23 | 2,300 | 7249 | 2800 | 12,349 | 115,221 | 903 | ||
120 | 125,460 | 23 | 2,300 | 7249 | 3360 | 12,909 | 112,551 | D | ||
284 | 60 | 98,450 | 25 | 2,500 | 8797 | 1680 | 12,997 | 85,453 | D | |
80 | 122,860 | 27 | 2,700 | 8797 | 2240 | 13,737 | 109,123 | 3,199 | ||
100 | 123,150 | 30 | 3,000 | 8797 | 2800 | 14,597 | 108,553 | D | ||
120 | 127,710 | 30 | 3,000 | 8797 | 3360 | 15,057 | 112,653 | 891 |
ANOVA | Analysis of Variance |
TVC | Total Variable Cost |
NB | Net Benefit |
MRR | Marginal Rate of Return |
| [1] | Subedi, P., et al., Effects of Need-Based Nitrogen Management and Varieties on Growth and Yield of Dry Direct Seeded Rice. Pertanika Journal of Tropical Agricultural Science, 2019. 42(2). |
| [2] | Seyoum, M., S. Alamerew, and K. Bantte, Evaluation of upland NERICA rice (Oryza sativa L.) genotypes for grain yield and yield components along an altitude gradient in Southwest Ethiopia. Journal of Agronomy, 2011. 10(4): p. 105-111. |
| [3] | Tadesse, T., et al., Biological and Economic Response of Rice to Nitrogen and Phosphorous fertilizer applications under rainfed lowland production ecology. Academic Research Journal of Agricultural Science and Research, 2020: p. 60-9. |
| [4] | Fayisa, B. A. and G. D. Welbira, Influence of phosphorous and nitrogen fertilizer rate on grain yield of rice at Kamashi zone of Benshal-gul Gumuz region, Ethiopia. Journal of World Economic Research, 2016. 5(2): p. 8-14. |
| [5] | Gizaw, W. and D. Assegid, Trend of cereal crops production area and productivity, in Ethiopia. Journal of Cereals and Oilseeds, 2021. 12(1): p. 9-17. |
| [6] | Varambally, S., et al., Genomic loss of microRNA-101 leads to overexpression of histone methyltransferase EZH2 in cancer. science, 2008. 322(5908): p. 1695-1699. |
| [7] | Tadesse, T., A. Assaye, and D. Alemu, Ethiopia: Enriching Livelihoodswith Rice Research, 2020. |
| [8] | Hameed, F., et al., Optimizing nitrogen options for improving nitrogen use efficiency of rice under different water regimes. Agronomy, 2019. 9(1): p. 39. |
| [9] | Tyeb, A., S. Paul, and M. Samad, Performance of variety and spacing on the yield and yield contributing characters of transplanted aman rice. J. Agrofor. Environ, 2013. 7(1): p. 57-60. |
| [10] | Fazli Hameed, Junzeng Xu, Shah Fahad Rahim, Qi Wei, Rehman Khalil. and QiLiao. 2019. Optimizing Nitrogen Options for Improving Nitrogen Use Efficiency of Rice under Different Water Regimes. Agronomy Journal, 9, 39; |
| [11] | Noor, M. A. (2017) Nitrogen management and regulation for optimum NUE in maize A mini review, Soil Cro Sci pp. 70-79. |
| [12] | Asariha, M. and M. Zarabi, Phosphorus species, fractions, and leaching risk in vermicompost-amended calcareous sandy loam soil. International journal of recycling organic waste in agriculture, 2022. |
| [13] | Jackson, M., Soil chemical analysis prentice Hall. Inc., Englewood Cliffs, NJ, 1958. 498: p. 183-204. |
| [14] | Mulugeta, D. and B. Sheleme, Characterization and classification of soils along the top sequence of Kindo Koye Watershed in Southern Ethiopia. East African Journal of Sciences, 2010. 4(2): p. 65-77. |
| [15] | Walkley, A. and I. A. Black, An examination of the Degtjareff method for determining soil organic matter, and a proposed modification of the chromic acid titration method. Soil science, 1934. 37(1): p. 29-38. |
| [16] | Bray, R. H. and L. T. Kurtz, Determination of total, organic, and available forms of phosphorus in soils. Soil science, 1945. 59(1): p. 39-46. |
| [17] | Polemio, M. and J. Rhoades, Determining cation exchange capacity: A new procedure for calcareous and gypsiferous soils. Soil Science Society of America Journal, 1977. 41(3): p. 524-528. |
| [18] | Rhoades, J., Salinity: Electrical conductivity and total dissolved solids. Methods of soil analysis: Part 3 Chemical methods, 1996. 5: p. 417-435. |
| [19] | Bouyoucos, G. J., Hydrometer method improved for making particle size analyses of soils 1. Agronomy journal, 1962. 54(5): p. 464-465. |
| [20] | Kumar, R., M. Gupta, and S. Kanwar, Fate of bacterial pathogens in cattle dung slurry subjected to anaerobic digestion. World Journal of Microbiology and Biotechnology, 1999. 15: p. 335-338. |
| [21] | Lang, C. A., Simple microdetermination of Kjeldahl nitrogen in biological materials. Analytical Chemistry, 1958. 30(10): p. 1692-1694. |
| [22] | Greenbaum, R. and G. Hesse, Electrical conductivity of flowmeter tubes. BJA: British Journal of Anaesthesia, 1978. 50(4): p. 408-408. |
| [23] | Dechassa, N. and Y. E. Handiso, Effect of rates and time of nitrogen application on growth, yield, and grain protein of bread wheat (Triticum aestivum L.) in Eastern Hararghe, Ethiopia, 2014, Haramaya University. |
| [24] | Angassa, D., Effect of sowing method and seeding rate on yield and yield components of rainfed rice (Oryza sativa L.) varieties in Woliso, South-West Shoa Zone, Ethiopia, 2007, MSc. Thesis, Haramyaya University, Haramaya. |
| [25] | Bozorgi, H. R., et al., Effect of plant density on yield and yield components of rice. World Applied Sciences Journal, 2011. 12(11): p. 2053-2057. |
| [26] | Haque, M. A. and M. M. Haque, Growth, yield and nitrogen use efficiency of new rice variety under variable nitrogen rates. American Journal of Plant Sciences, 2016. 7(3): p. 612-622. |
| [27] | Sah, M. K., et al., Interaction of nitrogen doses and establishment methods in lowland rice at Parwanipur, Bara, Nepal. Archives of Agriculture and Environmental Science, 2019. 4(1): p. 113-118. |
| [28] | Wang, Y., et al., Effects of nitrogen and tiller type on grain yield and physiological responses in rice. AoB Plants, 2017. 9(2). |
| [29] | Bishaw, Z., P. C. Struik, and A. J. Van Gastel, Assessment of on-farm diversity of wheat varieties and landraces: evidence from farmers’ fields in Ethiopia. African Journal of Agricultural Research, 2014. 9(38): p. 2948-2963. |
| [30] | Dong, J., et al., Effect of different nitrogen fertilizer application strategies on rice growth and yield. Asian Agricultural Research, 2016. 8(1). |
| [31] | Iqbal, M., et al., Performance of Nitrogen Phosphorus compound fertilizer in Boro rice. International Journal of Medical Investigation, 2017. 6(1): p. 4-10. |
| [32] | Salman, D., et al., Application of nitrogen and silicon rates on morphological and chemical lodging-related characteristics in rice (Oryza sativa L.) at North of Iran. Journal of Agricultural Science, 2012. 4(6): p. 12. |
| [33] | Ghoneim, A. M., E. Gewaily, and M. M. Osman, Effects of nitrogen levels on growth, yield and nitrogen use efficiency of some newly released Egyptian rice genotypes. Open agriculture, 2018. 3(1): p. 310-318. |
| [34] | Tadesse, T., effects of sources, rates and time of application of nitrogen fertilizer on yield and yield related components of upland rice (Oryza sativa l.) In Fogera district, northwestern Ethiopia, 2020. |
| [35] | Ashebir, S., Effects of nitrogen and seed rates on grain yield, yield components and nitrogen uptake of rainfed rice (Oryza sativa L.) in Fogera, South Gondar, 2005, M. Sc. Thesis Presented to the School of Graduate Studies of Haramaya. |
| [36] | Carrizo, D. R., M. E. Lundy, and B. A. Linquist, Rice yields and water use under alternate wetting and drying irrigation: A meta-analysis. Field Crops Research, 2017. 203: p. 173-180. |
| [37] | Tadesse, T. and Z. Tadesse, Review of rice response to fertilizer rates and time of nitrogen application in Ethiopia. International Journal of Applied Agricultural Sciences, 2019. 5(6): p. 129-137. |
| [38] | Gorgy, R., Effect of transplanting spacings and nitrogen levels on growth, yield and nitrogen use efficiency of some promising rice varieties. Journal of Agricultural Research, Kafel El-shiekh University, 2010. 36(2): p. 17-30. |
| [39] | Dereje, G., T. Adisu, and A. Dimberu, Influence of seed rate and row spacing on growth and yield of tef (Eragrostis tef) production at Assosa, Benishangul-Gumuz regional State, Western Ethiopia. Adv. Crop Sci. Technol, 2018. 6: p. 1-3. |
| [40] | Aleminew, A., et al., Influence of nitrogen on the growth and use efficiency of rainfed lowland rice in northwest Ethiopia. Journal of Plant Nutrition, 2020. 43(15): p. 2243-2258. |
| [41] | Ashebir, W. and T. Tadesse, Associated factors of postpartum modern contraceptive use in Burie District, Amhara Region, Ethiopia. Journal of Pregnancy, 2020. 2020. |
| [42] | Tadesse, T., et al. Effect of seed soaking and incubation on the emergence, growth and yield of rice. in Proceedings of the 2nd Annual Regional Conference on Completed Crops Research Activities. 2007. |
| [43] | Lin, X., et al., Effect of plant density and nitrogen fertilizer rates on grain yield and nitrogen uptake of hybrid rice (Oryza sativa L.). Journal of Agricultural Biotechnology and Sustainable Development, 2009. 1(2): p. 044-053. |
| [44] | Walia, U., et al., Role of seed rate and herbicides on the growth and development of direct dry-seeded rice. Indian Journal of Weed Science, 2009. 41(1and2): p. 33-36. |
| [45] | Tadesse, Z., T. Tadesse, and H. Assega, Effect of Seedling Age at Transplanting on Yield and Yield Components of Low Land Rice in Fogera Plain, North Western Ethiopia. Results of Crop Improvement and Management Research for, 2022. |
| [46] | Program, C. E., I. Maize, and W. I. Center, From agronomic data to farmer recommendations: an economics training manual. 1988: CIMMYT. |
| [47] | CIMMYT. 1988. from Agronomic Data to Farmer Recommendations. An Economic Training Manual. Completely Revised Edition. CIMMYT, Mexico, D. F., Mexico. 79 pp. |
APA Style
Taye, Y., Ayalew, D., Abera, B. (2024). Optimum Seeding and Nitrogen Fertilizer Rates for Maximizing Yield and Sustaining Rain-Fed Lowland Rice (Oryza Sativa L.) in Fogera Plain North-western Ethiopia. Journal of Chemical, Environmental and Biological Engineering, 8(2), 52-65. https://doi.org/10.11648/j.jcebe.20240802.12
ACS Style
Taye, Y.; Ayalew, D.; Abera, B. Optimum Seeding and Nitrogen Fertilizer Rates for Maximizing Yield and Sustaining Rain-Fed Lowland Rice (Oryza Sativa L.) in Fogera Plain North-western Ethiopia. J. Chem. Environ. Biol. Eng. 2024, 8(2), 52-65. doi: 10.11648/j.jcebe.20240802.12
AMA Style
Taye Y, Ayalew D, Abera B. Optimum Seeding and Nitrogen Fertilizer Rates for Maximizing Yield and Sustaining Rain-Fed Lowland Rice (Oryza Sativa L.) in Fogera Plain North-western Ethiopia. J Chem Environ Biol Eng. 2024;8(2):52-65. doi: 10.11648/j.jcebe.20240802.12
@article{10.11648/j.jcebe.20240802.12,
  author = {Yasin Taye and Dereje Ayalew and Bayuh Abera},
  title = {Optimum Seeding and Nitrogen Fertilizer Rates for Maximizing Yield and Sustaining Rain-Fed Lowland Rice (Oryza Sativa L.) in Fogera Plain North-western Ethiopia
},
  journal = {Journal of Chemical, Environmental and Biological Engineering},
  volume = {8},
  number = {2},
  pages = {52-65},
  doi = {10.11648/j.jcebe.20240802.12},
  url = {https://doi.org/10.11648/j.jcebe.20240802.12},
  eprint = {https://article.sciencepublishinggroup.com/pdf/10.11648.j.jcebe.20240802.12},
  abstract = {Rice (Oryza sativa L.) is increasingly becoming an important food crop in Ethiopia. However, the average rice productivity in Ethiopia is estimated at 2.8 t ha-1 which is much lower than the world average, 4.6 t ha-1. Its productivity is challenged due to a lack of appropriate and location-specific agronomic practices like the application of optimum doses of nitrogen fertilizer and the use of optimum seeding rates. Thus, a field experiment was conducted in Fogera district in South Gondar Zone, Northwestern Ethiopia during the 2021 main cropping season to determine the optimum dose of N level and seeding rate. The treatments comprised factorial combinations of four levels of N (134, 184, 234 and 284 kg ha-1) and four different seeding rates (60, 80, 100, and 120 kg ha-1). The experiment was laid out in a randomized complete block design and replicated thrice. All data on phenology, vegetative growth yield and yield-related parameters were collected and measured following scientific standards of each parameter. Those data were subjected to analysis of variance using the general linear model (GLM) procedures of SAS 9.0 version system. Economic analysis was also carried out by following CIMMYT partial budget analysis procedures. The analysis result showed the main effects of both, different levels of nitrogen and different rate of seeding, and their interactions showed highly significant effect on the number of both total and effective tillers, grain filling, panicle length, phonological parameters, totals spikelet’s, thousands seed weight, grain yield, biological yield and straw yield. Application of 184 kg N ha-1 level with a seeding rate 100 kg ha-1 gave the maximum grain yield (6,641 kg ha-1), the highest number of effective tillers per m2 (792) and filled grains per panicle (95.34). Furthermore, the highest net return of ETB 118,850 with acceptable marginal rate of return (2,313%) was also obtained from the application of 184 kg N ha-1 level and a seeding rate 100 kg ha-1. From the current research experiment, it is possible to conclude that increasing seeding rate beyond 100 kg ha-1 and N above 184 kg N ha-1 is not economical yield of rice “Selam’’ variety in the study area. Rather, use of 184 kg N ha-1 and seeding rate of 100 kg ha-1 is promising for Lowland Rice (Selam) variety production under the rain fed condition in Fogera Plains and similar agro-ecologies of rain-fed growing area of Ethiopia for better economic and agronomic advantage.
},
 year = {2024}
}
TY  - JOUR
T1  - Optimum Seeding and Nitrogen Fertilizer Rates for Maximizing Yield and Sustaining Rain-Fed Lowland Rice (Oryza Sativa L.) in Fogera Plain North-western Ethiopia

AU  - Yasin Taye
AU  - Dereje Ayalew
AU  - Bayuh Abera
Y1  - 2024/08/27
PY  - 2024
N1  - https://doi.org/10.11648/j.jcebe.20240802.12
DO  - 10.11648/j.jcebe.20240802.12
T2  - Journal of Chemical, Environmental and Biological Engineering
JF  - Journal of Chemical, Environmental and Biological Engineering
JO  - Journal of Chemical, Environmental and Biological Engineering
SP  - 52
EP  - 65
PB  - Science Publishing Group
SN  - 2640-267X
UR  - https://doi.org/10.11648/j.jcebe.20240802.12
AB  - Rice (Oryza sativa L.) is increasingly becoming an important food crop in Ethiopia. However, the average rice productivity in Ethiopia is estimated at 2.8 t ha-1 which is much lower than the world average, 4.6 t ha-1. Its productivity is challenged due to a lack of appropriate and location-specific agronomic practices like the application of optimum doses of nitrogen fertilizer and the use of optimum seeding rates. Thus, a field experiment was conducted in Fogera district in South Gondar Zone, Northwestern Ethiopia during the 2021 main cropping season to determine the optimum dose of N level and seeding rate. The treatments comprised factorial combinations of four levels of N (134, 184, 234 and 284 kg ha-1) and four different seeding rates (60, 80, 100, and 120 kg ha-1). The experiment was laid out in a randomized complete block design and replicated thrice. All data on phenology, vegetative growth yield and yield-related parameters were collected and measured following scientific standards of each parameter. Those data were subjected to analysis of variance using the general linear model (GLM) procedures of SAS 9.0 version system. Economic analysis was also carried out by following CIMMYT partial budget analysis procedures. The analysis result showed the main effects of both, different levels of nitrogen and different rate of seeding, and their interactions showed highly significant effect on the number of both total and effective tillers, grain filling, panicle length, phonological parameters, totals spikelet’s, thousands seed weight, grain yield, biological yield and straw yield. Application of 184 kg N ha-1 level with a seeding rate 100 kg ha-1 gave the maximum grain yield (6,641 kg ha-1), the highest number of effective tillers per m2 (792) and filled grains per panicle (95.34). Furthermore, the highest net return of ETB 118,850 with acceptable marginal rate of return (2,313%) was also obtained from the application of 184 kg N ha-1 level and a seeding rate 100 kg ha-1. From the current research experiment, it is possible to conclude that increasing seeding rate beyond 100 kg ha-1 and N above 184 kg N ha-1 is not economical yield of rice “Selam’’ variety in the study area. Rather, use of 184 kg N ha-1 and seeding rate of 100 kg ha-1 is promising for Lowland Rice (Selam) variety production under the rain fed condition in Fogera Plains and similar agro-ecologies of rain-fed growing area of Ethiopia for better economic and agronomic advantage.

VL  - 8
IS  - 2
ER  -
Fogera National Rice Research and Training Center, Ethiopian Institute of Agricultural Research, Fogera, Ethiopia
College of Agriculture and Environmental Sciences, Bahir Dar University, Bahir Dar, Ethiopia
Information