Research Article | | Peer-Reviewed

The Impact of FinTech Adoption on Environmental Performance: The Mediation Role of Green Dynamic Capability and Green Innovation

Received: 22 April 2026     Accepted: 4 June 2026     Published: 13 August 2026
Views:       Downloads:
Abstract

Environmental sustainability is increasingly viewed as a key priority for organizations striving to align economic growth with ecological responsibility. As digital technology continues to evolve rapidly, financial technology (FinTech) has emerged as a significant enabler of efficient financial services, improved information transparency, and optimized resource allocation. However, limited research has explored the organizational mechanisms through which FinTech adoption (FA) enhances environmental performance (ENP). To fill this gap, the present research investigates the impact of FA on ENP by exploring the mediating effects of green dynamic capability (GDC) and green innovation (GI). A conceptual framework integrating these constructs is developed and empirically tested using a hybrid analytical approach. Specifically, Partial Least Squares Structural Equation Modeling (PLS-SEM) is employed to evaluate the hypothesized relationships and mediating effects among the constructs. Subsequently, Artificial Neural Network (ANN) analysis is applied to assess the predictive strength and relative importance of the significant determinants identified in the PLS-SEM stage. FA exerts both direct and indirect positive effects on ENP, with GDC and GI acting as mediating pathways. Furthermore, ANN analysis shows that GDC exerts the strongest influence on ENP, followed by GI and FA. By integrating PLS-SEM and ANN, this research offers a more in-depth analytical perspective than single-method approaches and provides deeper insights into how FA facilitates organizational environmental sustainability.

Published in Journal of Finance and Accounting (Volume 14, Issue 4)
DOI 10.11648/j.jfa.20261404.12
Page(s) 178-191
Creative Commons

This is an Open Access article, distributed under the terms of the Creative Commons Attribution 4.0 International License (http://creativecommons.org/licenses/by/4.0/), which permits unrestricted use, distribution and reproduction in any medium or format, provided the original work is properly cited.

Copyright

Copyright © The Author(s), 2026. Published by Science Publishing Group

Keywords

FinTech Adoption, Green Dynamic Capability, Green Innovation, Environmental Performance, PLS-SEM, ANN

1. Introduction
Environmental sustainability is increasingly regarded as a key issue for organizations and policymakers worldwide. This is owing to rising environmental degradation, climate change, and resource scarcity. In response to these challenges, organizations face growing pressure to integrate environmental considerations into their strategic and operational activities. Environmental performance (ENP) has therefore emerged as a key indicator of sustainable organizational development, reflecting an organization’s ability to minimize ecological impacts while maintaining long-term competitiveness .
With the swift evolution of digital technologies, the global financial ecosystem has undergone substantial transformation. Financial technology (FinTech), which integrates technologies such as big data analytics, artificial intelligence, and blockchain into financial services, has significantly improved financial accessibility, information transparency, and resource allocation efficiency. Recent studies suggest that FinTech can support sustainable development by facilitating green investments and improving the efficiency of environmentally responsible decision-making . Accordingly, FinTech adoption (FA) is increasingly recognized as a potential driver of sustainable corporate transformation.
However, FA may affect ENP in an indirect manner. From the perspective of the Dynamic Capability View (DCV), organizations must develop higher-order capabilities that facilitate the integration and reconfiguration of resources under rapidly changing environmental conditions . In this context, green dynamic capability (GDC) reflects an organization’s ability to identify environmental opportunities and mobilize green resources to support sustainability initiatives . Simultaneously, the Natural Resource-Based View (NRBV) emphasizes that environmentally oriented innovations can become key sources of sustainable competitive advantage , while Environmental Management Theory (EMT) further emphasizes the integration of environmental concerns into organizational strategies and practices. Accordingly, green innovation (GI), including environmentally friendly products and production processes, plays a role in improving environmental performance.
Although there is increasing interest in FinTech and sustainability, existing research has mainly focused on the direct effects of digital finance on environmental outcomes. Relatively little attention has been given to the internal organizational mechanisms through which FA translates into improved ENP. In particular, the mediating effects of GDC and GI remain insufficiently explored.
To address this gap, this study investigates how FA influences ENP through the mediating roles of GDC and GI. Drawing on the DCV and the NBRV, this research develops a conceptual framework linking FA, GDC, GI, and ENP. Using survey data from organizations in China, an analysis is conducted using a hybrid approach to combine Partial Least Squares Structural Equation Modeling (PLS-SEM) and Artificial Neural Network (ANN) analysis. This method enables a more thorough understanding of how FinTech adoption promotes organizational environmental sustainability.
2. Research Framework and Hypotheses Development
2.1. Research Framework
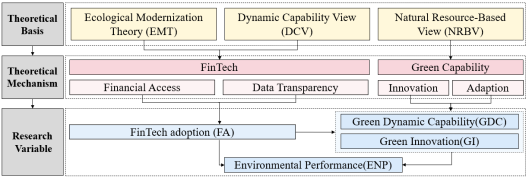
Scholars from various disciplines have studied the criteria for incorporating ENP into organizational strategies. These criteria are based on theoretical paradigms such as the DCV, the NRBV, and EMT to explain how FA enhances ENP through GDC and GI.
From the viewpoint of the DCV, dynamic capability acts as a higher-level integration ability that allows organizations to reconfigure both internal and external resources, develop new competencies, and adapt to environmental shifts, ultimately creating value and maintaining a competitive edge . However, FinTech does not directly generate environmental outcomes. Rather, it strengthens GDC, which represents an organization’s ability to identify environmental opportunities, allocate financial resources to green initiatives, and reconfigure operational processes to support sustainability goals .
The NRBV extends strategic management theory by emphasizing environmental capabilities as sources of sustained competitive advantage. Recent research highlights that companies utilizing environmental capabilities can convert financial and technological resources into GI efforts, supporting long-term sustainability performance. In this context, GDC and GI empower organizations to transform FinTech-enabled financial flexibility into the development of environmentally friendly products and the adoption of cleaner production processes.
EMT posits that technological innovation and institutional modernization can harmonize economic growth with environmental improvement, offering a useful theoretical lens for understanding organizations’ ENP . FinTech, as a form of financial innovation, facilitates green financing, reduces information asymmetry, and supports environmentally responsible decision-making. Through these mechanisms, GI becomes the pathway through which FA ultimately enhances ENP.
Accordingly, this study proposes that FA improves ENP indirectly through the sequential mediating effects of GDC and GI, as shown in Figure 1.
Figure 1. Research framework.
2.2. FA and ENP
FinTech, as an emerging paradigm within Industry 4.0, is fundamentally reshaping the financial services landscape by leveraging advanced technological solutions to support diverse business models . Beyond improving operational efficiency, FinTech also contributes to broader societal outcomes, particularly environmental sustainability. By utilizing digital platforms and data analytics, FinTech helps alleviate internal financing constraints that often limit organizations’ green investments. At the same time, it facilitates access to external incentives, such as environmental subsidies and tax rebates, through streamlined application processes and transparent data reporting. This dual financial empowerment enables organizations to allocate more resources to environmental initiatives, ultimately improving ENP . Furthermore, FinTech promotes the development of green and inclusive financial markets, expanding capital availability for environmental projects . Through technologies such as big data and artificial intelligence, FinTech can also identify inefficiencies and guide organizations toward more sustainable practices, thereby supporting environmentally responsible decision-making .
From the lens of EMT, technological advancement can decouple economic growth from environmental degradation . FinTech supports this process by improving resource allocation efficiency, enabling real-time environmental monitoring, and promoting green financial instruments. Accordingly, FA may enhance organizations’ ENP. Therefore, the hypothesis is proposed:
H1: FA has a positive influence on organizations’ ENP.
2.3. FA and GI
GI involves the development and application of new or enhanced products, services, and processes that incorporate ecological considerations to reduce environmental harm while enhancing business efficiency and competitiveness . It is broadly acknowledged as an important strategy for reducing organizations’ environmental impacts and strengthening competitive advantages . In particular, green product innovation enables organizations to differentiate themselves through environmentally friendly design features, while green process innovation improves environmental management practices, helping organizations reduce costs, minimize operational risks, and comply with environmental regulations .
FinTech can further stimulate GI by improving corporate transparency and broadening access to capital resources. By leveraging technologies like blockchain and big data, FinTech enables real-time disclosure of financial and operational information. This allows stakeholders to better monitor environmental practices and evaluate organizations’ sustainability efforts . By reducing information asymmetry, FinTech strengthens incentives for organizations to engage in environmentally responsible innovation. Moreover, FinTech provides alternative financing channels, including crowdfunding and green bonds, which support research and development investment in environmentally friendly technologies and sustainable production processes . Consequently, FA may promote GI. Therefore, the hypothesis is formulated:
H2: FA has a positive influence on GI.
2.4. FA and GDC
GDC extends the traditional concept of dynamic capabilities by offering an environmentally oriented perspective on how organizations mobilize and renew their resources. In particular, GDC reflects organizations’ ability to develop and realign both internal and external resources in ways that support ecological sustainability and enable organizations to achieve sustainable competitive advantage . Within this framework, organizations possessing strong GDCs can explore new ideas and identify emerging environmental opportunities. They are also more capable of supporting innovation and taking calculated risks toward sustainability. These capabilities also facilitate knowledge transfer and integration, allowing organizations to maintain competitiveness under uncertain conditions .
Building on this perspective, FA can further strengthen GDCs by improving organizations’ access to financial resources and enhancing information transparency. Digital financial technologies, such as big data analytics and digital platforms, reduce information asymmetry and financing constraints, enabling organizations to allocate resources more efficiently to sustainability-related initiatives. Moreover, FinTech facilitates data-driven insights and organizational learning, which help organizations identify environmental opportunities and adapt their strategies accordingly . Consequently, FA improves organizations’ ability to recognize opportunities, mobilize resources, and adapt them toward environmental sustainability. The hypothesis is thus proposed:
H3: FA has a positive influence on GDC.
2.5. GI and ENP
GI can directly improve ENP by enabling organizations to redesign their products, services, and production processes in ways that reduce ecological impacts. By adopting environmentally friendly technologies and cleaner production practices, organizations can reduce emissions and waste. This also improves resource efficiency and environmental outcomes . Moreover, GI encourages organizations to incorporate environmental considerations into their strategic and operational decisions, which helps organizations comply with environmental regulations and address growing stakeholder demands regarding sustainability . In addition, the continuous development and application of environmentally oriented technologies allow organizations to enhance resource efficiency and minimize environmental risks, ultimately leading to improved ENP . Therefore, organizations that actively engage in GI have a greater tendency to achieve superior ENP. Accordingly, the hypothesis is posited:
H4: GI has a positive influence on ENP.
2.6. GDC and ENP
GDC enables organizations to enhance their ENP by strengthening their capacity to combine and restructure resources to address sustainability challenges.
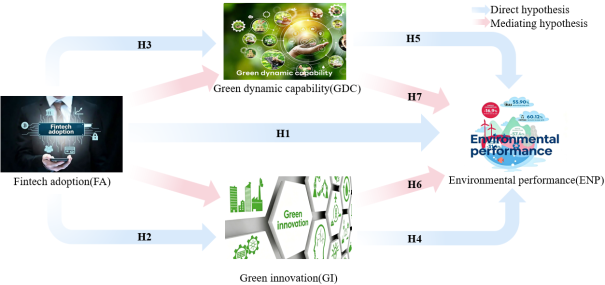
Figure 2. Conceptual framework.
Organizations with well-developed GDC can better recognize environmental risks and opportunities. They can also align resources and operations toward sustainability goals, thereby improving sustainability outcomes . In addition, GDC supports the utilization of environmentally sustainable technologies and corresponding management approaches, which help organizations reduce emissions, minimize waste generation, and enhance the efficient use of natural endowments . Through continuous learning and resource reconfiguration, organizations can also respond more effectively to changing environmental regulations and stakeholder expectations, thereby achieving higher levels of ENP . Consequently, organizations that develop stronger GDC are more likely to generate superior ENP. Therefore, the hypothesis is posited:
H5: GDC has a positive influence on ENP.
2.7. The Mediating Role of GDC and GI
Although FA may directly enhance ENP, it is unlikely to exert its influence automatically. From the perspective of the NRBV, financial and technological resources must be transformed into environmentally oriented organizational practices generating sustainability outcomes. In this regard, a crucial role in transmitting the effect of FA on ENP is played by GI. By improving access to capital and increasing information transparency, FinTech enables organizations to invest in environmentally friendly product development and cleaner production technologies . These innovation activities subsequently reduce emissions, improve resource efficiency, and enhance ecological outcomes . Therefore, GI may mediate the relationship between FA and ENP.
In addition to innovation outcomes, FA may also influence ENP through the development of GDC. Drawing on the DCV, digital financial technologies enhance organizations’ ability to sense environmental opportunities, mobilize green-oriented resources, and reconfigure organizational processes to address sustainability challenges . Such strengthened GDCs make it possible for organizations to systematically incorporate environmental factors into strategic decision-making and operational transformation, thereby improving ENP . Accordingly, GDC represents another important pathway through which FA translates into superior environmental outcomes. Based on this, the following hypotheses are formulated.
H6: GI mediates the relationship between FA and ENP.
H7: GDC mediates the relationship between FA and ENP.
Figure 2 illustrates the conceptual framework.
3. Materials and Methods
3.1. Sampling and Data Collection
This study aims to examine how FA influences the ENP of organizations in a developing country such as China. It also investigates how GDC and GI mediate the relationship between FA and ENP. Furthermore, factors such as economic strength, fiscal finance, innovation capability, and a supportive policy environment have been regarded as key contributors of FinTech development and innovation activities in China . These factors have enabled China to become a global leader, with the market size of its technology enterprises and financial institutions, particularly banks, growing steadily.
Moreover, the study collected primary data through a structured questionnaire administered to interns, employees, and business managers of organizations across China. From January to March 2026, respondents were selected using convenience sampling methods. In total, 274 questionnaires were collected, however, 20 responses were removed due to incomplete or invalid entries. Consequently, 254 valid samples were retained for the final analysis. Detailed demographic characteristics of the respondents are summarized in Table 1.
Table 1. Respondents profile.

Variables

Particular

Frequency

Percentage (%)

Gender

Male

100

39.37

Female

154

60.63

Age

<18

1

0.39

18-25

142

55.90

25-30

34

13.39

30-40

30

11.81

40-50

26

10.24

50-60

15

5.91

≥60

6

2.36

Educational qualification

Junior high school or below

5

1.97

High school

16

6.30

Junior college

32

12.60

Bachelor’s degree

168

66.14

Master’s degree or above

33

12.99

Occupation

Intern

128

50.39

Company employee

54

21.26

Government employee

32

12.60

Freelancer

17

6.69

Business manager

14

5.51

Retired

7

2.76

Others

2

0.79

Working experience

<3

148

58.27

3-6

26

10.24

6-10

20

7.87

10-15

20

7.87

≥15

40

15.75

3.2. Survey Instrument Development
The constructs examined in this study, including FA, GDC, GI, and ENP, were measured using items derived from a comprehensive review of relevant literature. Primary data were collected using structured questionnaires adapted from previously validated instruments to investigate the influence of FA on ENP, with GDC and GI serving as mediating variables. The questionnaire was divided into two parts: the first gathered respondents’ demographic details, while the second included items related to both the endogenous and exogenous variables under investigation. All items were rated on a seven-point Likert scale, ranging from 1 (strongly disagree) to 7 (strongly agree).
FA was measured using five items adapted from Tian et al. , capturing respondents’ perceptions of how their organization’s FA intentions relate to GDC, GI, and ENP. In line with prior studies, five items from Yu et al. were employed to measure GDC. GI was measured with four items drawn from Jun et al. and Tian et al. . Finally, ENP was measured through five items adapted from Rehman et al. and Tian et al. .
3.3. Data Analysis Techniques
The collected data were analyzed using a mixed-method approach that combines PLS-SEM and ANN techniques. In the first phase, PLS-SEM was implemented using SmartPLS4 to empirically test the proposed hypotheses, specifically investigating the effect of FA on ENP among organizations in China, with GDC and GI as mediating variables. Subsequently, because of the potential nonlinear relationships between the predictors and the dependent variable, an ANN analysis was performed to evaluate the normalized importance of the predictors identified from the PLS-SEM results. This neural network analysis was carried out using the ANN module in IBM SPSS.
4. Data Analysis and Results
4.1. Descriptive Statistics
An overview of the descriptive statistics for the study variables is provided in Table 2, which suggests that the mean values range from 5.311 to 5.638. These relatively high means indicate general agreement among respondents with the survey items. Standard deviations fall between 1.021 and 1.306, reflecting a moderate and consistent level of variability in responses. Skewness is observed within the interval of −1.260 to −0.634, with kurtosis varying from −0.194 to 2.291. All values are within commonly accepted thresholds for normality, with skewness remaining below 2 in absolute value and kurtosis below 7, indicating that the assumption of normality is satisfied . In summary, the data exhibit acceptable normality, with skewness and kurtosis within thresholds.
4.2. Multivariate Statistical Assumptions
Table 3 presents the results of the ANOVA test for linearity, which is conducted to assess whether existing relationships between the independent and dependent variables can be adequately represented by linear functions prior to ANN analysis. Drawing on the recommended statistical criteria , a significant linearity test (p < 0.050) combined with a non-significant deviation-from-linearity test (p > 0.050) indicates that the relationship can be treated as linear.
Table 2. Descriptive statistic.

Var.

Items

Mean

SD

Kurt

Skew

FL

VIF

α

CR

AVE

FA

FA1

5.543

1.192

1.577

-1.022

0.754

1.626

0.819

0.874

0.580

FA2

5.323

1.294

1.367

-1.090

0.768

1.674

FA3

5.504

1.200

2.291

-1.173

0.739

1.530

FA4

5.630

1.257

1.919

-1.260

0.774

1.610

FA5

5.638

1.134

2.198

-1.159

0.774

1.669

GDC

GDC1

5.421

1.226

1.092

-0.912

0.777

1.817

0.857

0.898

0.637

GDC2

5.311

1.237

0.662

-0.748

0.818

2.041

GDC3

5.465

1.142

0.526

-0.742

0.816

1.960

GDC4

5.449

1.275

0.471

-0.831

0.798

1.864

GDC5

5.488

1.229

1.321

-1.036

0.779

1.767

GI

GI1

5.343

1.306

-0.194

-0.634

0.781

1.614

0.807

0.873

0.633

GI2

5.622

1.177

1.787

-1.097

0.795

1.713

GI3

5.512

1.186

1.446

-1.003

0.790

1.552

GI4

5.512

1.125

1.364

-0.856

0.816

1.739

ENP

ENP1

5.606

1.021

1.164

-0.871

0.733

1.520

ENP2

5.583

1.027

0.732

-0.740

0.800

1.807

0.825

0.877

0.588

ENP3

5.520

1.125

1.453

-0.909

0.788

1.722

ENP4

5.559

1.144

0.876

-0.836

0.766

1.625

ENP5

5.559

1.095

1.266

-0.794

0.747

1.673

*Note: Var. = Variables, SD = Standard deviation, Kurt = Kurtosis, Skew = Skewness, FL = Factor loadings, VIF = Variance inflation factor, α = Cronbach’s alpha, CR = Composite reliability, AVE = Average variance extracted.
The results show that the linear relationships between FA and ENP (F = 129.735, p < 0.001) and between GDC and ENP (F = 166.190, p < 0.001) are statistically significant, while the deviation-from-linearity tests are not significant (p = 0.124 and p = 0.323, respectively). These findings satisfy the criteria for linearity, suggesting that FA and GDC have linear relationships with ENP.
However, for the relationship between GI and ENP, both the linearity test (F = 166.568, p < 0.001) and the deviation-from-linearity test (F = 3.080, p < 0.001) are statistically significant. The significant deviation from linearity indicates potential nonlinear patterns, which further justify the application of ANN analysis in the second stage of this study.
4.3. Measurement Model
Cronbach’s alpha (α) coefficients were initially used to assess the internal reliability of the constructs. As shown in Table 2, all α coefficients fall between 0.807 and 0.857, exceeding the commonly accepted threshold of 0.700 . This demonstrates that the measurement items possess satisfactory reliability and strong internal coherence.
Following established guidelines for evaluating reflective measurement models, several reliability and validity criteria were assessed. The standardized factor loadings for all
indicators range from 0.733 to 0.818, exceeding the recommended threshold of 0.700 , implying that the observed variables appropriately capture the underlying latent constructs. Composite reliability (CR) values range from 0.873 to 0.898, surpassing the minimum criterion of 0.700 suggested by Fornell & Larcker and Hair et al. , thereby confirming satisfactory internal consistency. Convergent validity was further examined using the average variance extracted (AVE). All constructs exhibit AVE values between 0.580 and 0.637, which are above the recommended threshold of 0.500 , thereby indicating that each construct captures more than half of the variance in its indicators.
Overall, the results demonstrate satisfactory measurement quality, with all constructs exhibiting strong internal consistency (α and CR > 0.700) and adequate convergent validity (AVE > 0.500), thereby confirming the soundness of the measurement model.
Discriminant validity was evaluated using two established methods, the Fornell-Larcker criterion and the heterotrait-monotrait (HTMT) ratio of correlations. As illustrated in Table 4, the Fornell-Larcker criterion is satisfied. The square root of AVE for each construct varies between 0.762 and 0.798 and exceeds its correlations with other constructs , thereby confirming adequate discriminant validity. Furthermore, the HTMT analysis presented in Table 5 reveals that all ratios are well below the conservative threshold of 0.850 , with values ranging from 0.696 to 0.781. Specifically, the HTMT values are 0.703 between FA and ENP, 0.768 between FA and GDC, 0.696 between FA and GI, 0.749 between GDC and ENP, 0.781 between GDC and GI, and 0.744 between GI and ENP. Since both assessment criteria yield satisfactory outcomes, it can be concluded that discriminant validity is firmly supported across all constructs examined.
Table 3. ANOVA test for linearity.

Interaction

Source

Component

SS

df

MS

F

Sig.

ENP * FA

Between

(Combined)

71.887

23

3.126

6.963

0.000

Linearity

58.239

1

58.239

129.735

0.000

Dev. from Lin.

13.648

22

0.620

1.382

0.124

Within

103.248

230

0.449

Total

175.135

253

ENP * GDC

Between

(Combined)

80.304

25

3.212

7.723

0.000

Linearity

69.123

1

69.123

166.190

0.000

Dev. from Lin.

11.181

24

0.466

1.120

0.323

Within

94.831

228

0.416

Total

175.135

253

ENP * GI

Between

(Combined)

84.468

18

4.693

12.163

0.000

Linearity

64.265

1

64.265

166.568

0.000

Dev. from Lin.

20.202

17

1.188

3.080

0.000

Within

90.668

235

0.386

Total

175.135

253

*Note: SS = Sum of squares, MS =Mean squares, df = Degrees of freedom, F= F-statistic, Sig. = Significance, Dev. from Lin. = Deviation from Linearity.
Table 4. Fornell-Larcker criterion.

ENP

FA

GDC

GI

ENP

0.767

FA

0.582

0.762

GDC

0.631

0.644

0.798

GI

0.613

0.569

0.649

0.796

Table 5. HTMT criterion.

ENP

FA

GDC

GI

ENP

FA

0.703

GDC

0.749

0.768

GI

0.744

0.696

0.781

4.4. Hypotheses Testing by PLS-SEM
After establishing the measurement model, the structural model was subsequently assessed to validate the proposed research hypotheses.
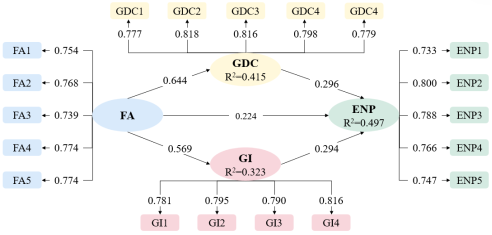
Leveraging the PLS-SEM approach, the study employed a bootstrapping resampling technique based on 5000 subsamples to test the significance of the path coefficients. Following standard practice, path coefficient significance was determined using a critical t-value of 1.960 at the 5% significance level . The structural model results, including the standardized beta (β) coefficients and their corresponding p-values, are summarized in Figure 3 and detailed in Table 6.
Figure 3. Structural model.
Consistently, all hypothesized paths were confirmed to be statistically significant, with all proposed relationships receiving empirical support. Specifically, H1, H2, and H3 were validated, revealing that FA exerts a robust positive effect on ENP (β = 0.224, p = 0.011 < 0.050), GI (β = 0.569, p =0.000 < 0.050), and GDC (β = 0.644, p = 0.000 <0.050). Additionally, H4 was confirmed, as a significant positive influence of GI on ENP is identified (β = 0.294, p = 0.003 < 0.050). H5 was also supported as expected, with a significant positive effect of GDC on ENP being observed (β = 0.296, p = 0.001 < 0.050).
Moreover, the findings from the mediation analysis confirmed the acceptance of H6 and H7. This indicates that GI and GDC function as mediators in the relationship between FA and ENP, with the mediated paths (FA → GI → ENP: β = 0.167, p = 0.008 < 0.050; FA → GDC → ENP: β = 0.190, p = 0.002 < 0.050) both demonstrating statistical significance.
Table 6. Results of mediation analysis.

Hypotheses

β

t-values

p-values

Decisions

Direct Hypotheses

H1: FA → ENP

0.224

2.543

0.011

Supported

H2: FA → GI

0.569

8.072

0.000

Supported

H3: FA → GDC

0.644

13.130

0.000

Supported

H4: GI → ENP

0.294

2.937

0.003

Supported

H5: GDC → ENP

0.296

3.305

0.001

Supported

Mediating Hypotheses

H6: FA → GI → ENP

0.167

2.641

0.008

Supported

H7: FA → GDC → ENP

0.190

3.089

0.002

Supported

*Note: ** T-value > 1.960 of significance at 5% level (two-tailed).
4.5. ANN Analysis
ANN is a highly parallel, distributed computational framework composed of interconnected processing units, designed to capture and utilize experiential patterns . ANN has been widely recognized for its superior predictive performance compared to traditional regression methods . In this study, ANN analysis was conducted using SPSS. FA, GDC, and GI, identified as significant predictors in the PLS-SEM analysis, were used as input variables, while ENP served as the output variable.
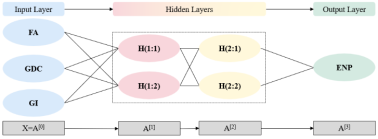
As illustrated in the model diagram, the ANN architecture consists of three input neurons (FA, GDC, and GI), two hidden layers with two neurons each, and a single output neuron (ENP). This deep network structure allows the model to capture complex nonlinear relationships between predictors and outcomes . As shown in Figure 4, the sigmoid activation function was applied to both the hidden and output layers to map the network outputs to the interval, ensuring consistency with the normalized scaling of the data. The lower part of the figure illustrates the forward propagation process, where X=A[0] denotes the input layer, while A[1], A[2], and A[3] correspond to the activation outputs of the successive hidden layers and the output layer .
To reduce the risk of overfitting and improve the generalizability of the results, a data partitioning strategy with a 9: 1 split for training and testing datasets was employed . The model’s predictive performance was evaluated through the root mean square of errors (RMSE), which quantifies the difference between predicted and observed values . The RMSE values for the training and testing datasets are reported in Table 7 as 0.108 and 0.102, respectively, with low standard deviations (0.005 and 0.017).
Figure 4. Structure of ANN model.
The ANN model exhibits strong predictive capability and robust performance , as evidenced by the low RMSE values.
Table 7 also reports the findings of the sensitivity analysis. The analysis was carried out to determine the relative contribution of each predictor by examining its normalized importance with respect to the dependent variable. Through this approach, the influence of each input variable on the model output can be assessed by observing how variations in the predictors impact the predicted values produced by the network . The findings indicate that GDC exerts the strongest influence on ENP, followed by GI, while FA shows the lowest level of importance among the three predictors.
5. Implications and Future Work
5.1. Implications
The findings offer meaningful insights for both theory and practice. From a theoretical perspective, it contributes to the literature on FinTech and environmental sustainability by integrating the DCV, the NRBV, and EMT to explain how FA enhances ENP. The findings suggest that FA not only directly improves ENP but also indirectly influences it through GDC and GI, highlighting the crucial role of organizational capabilities and innovation mechanisms in translating digital financial technologies into environmental outcomes. Furthermore, the utilization of a hybrid PLS-SEM and ANN approach extends prior sustainability research by capturing both linear and nonlinear relationships among FA, GDC, GI, and ENP .
Table 7. Values of RMSE and sensitivity analysis.

Network

RMSE (Training)

RMSE (Testing)

Total Sample

FA

GI

GDC

ANN1

0.105

0.079

254

0.587

0.859

1.000

ANN2

0.112

0.140

254

1.000

0.786

0.862

ANN3

0.104

0.086

254

1.000

0.914

1.000

ANN4

0.115

0.100

254

0.603

0.796

1.000

ANN5

0.104

0.097

254

0.451

1.000

0.994

ANN6

0.106

0.110

254

0.575

0.896

1.000

ANN7

0.107

0.098

254

0.912

0.888

1.000

ANN8

0.101

0.089

254

0.751

0.972

1.000

ANN9

0.105

0.114

254

0.965

0.993

1.000

ANN10

0.118

0.105

254

1.000

0.832

0.952

Mean

0.108

0.102

AI

0.784

0.894

0.981

SD

0.005

0.017

NI (%)

79.918

91.131

100.000

*Note: RMSE = Root mean square of errors, SD = Standard deviation, AI = Average importance, NI = Normalized importance.
From a practical perspective, this finding provides valuable guidance for managers and policymakers. Organizations should actively adopt FA to enhance financial accessibility, improve information transparency, and support data-driven environmental decision-making, while simultaneously strengthening GDC to facilitate GI activities. In addition, policymakers should promote digital financial ecosystems and supportive regulatory frameworks to encourage sustainable investments and long-term improvements in ENP .
5.2. Future Work
Notwithstanding its valuable contributions, this study has several limitations that should be noted. One limitation relates to the use of cross-sectional data collected from organizations in China, which may hinder the generalizability of the results. Future research can extend the current study by using longitudinal data or cross-country comparisons. These approaches would help examine whether the relationships among FA, GDC, GI, and ENP remain consistent across different institutional contexts.
Another limitation concerns the focus on the mediating roles of GDC and GI. These variables explain how FA influences ENP. Future research can build upon this work by introducing additional explanatory factors. Examples include green finance, digital transformation, and organizational learning. This would provide a more nuanced understanding of the underlying processes.
The effectiveness of FA in improving ENP may depend on specific contextual factors. Future studies should examine boundary conditions, including environmental regulation, institutional pressure, and organizational culture. In addition to these theoretical extensions, there is also scope for methodological improvement. Although this study adopts a hybrid PLS-SEM and ANN approach, future research can further adopt advanced techniques such as machine learning or longitudinal modeling to enhance robustness.
Abbreviations

AI

Average Importance

ANN

Artificial Neural Network

AVE

Average Variance Extracted

CR

Composite Reliability

DCV

Dynamic Capability View

Dev. from Lin.

Deviation from Linearity

df

Degrees of Freedom

EMT

Environmental Management Theory

ENP

Environmental Performance

F

F-statistic

FA

FinTech Adoption

FinTech

Financial Technology

FL

Factor Loading

GDC

Green Dynamic Capability

GI

Green Innovation

HTMT

Heterotrait-Monotrait

Kurt

Kurtosis

MS

Mean Squares

NI

Normalized Importance

NRBV

Natural Resource-Based View

PLS-SEM

Partial Least Squares Structural Equation Modeling

RMSE

Root Mean Square of Errors

SD

Standard Deviation

Sig.

Significance

Skew

Skewness

SS

Sum of Squares

Var.

Variables

VIF

Variance Inflation Factor

α

Cronbach’s Alpha

β

Standardized Beta

Acknowledgments
This work has been supported by the Undergraduate Training Program on Innovation and Entrepreneurship grant of Zhejiang University of Finance & Economics.
Author Contributions
Yiran Chen: Conceptualization, Data curation, Formal Analysis, Investigation, Methodology, Software, Visualization, Writing – original draft
Yulu Ying: Project administration, Visualization, Writing – review & editing
Data Availability Statement
All experimental data for this research have been public in the Figshare database (https://doi.org/10.6084/m9.figshare.31999269).
Conflicts of Interest
The authors declare no conflicts of interest.
References
[1] Zhang, D. Y., Mohsin, M., Rasheed, A. K., Chang, Y. H., & Taghizadeh-Hesary, F. (2021). Public spending and green economic growth in BRI region: mediating role of green finance. Energy Policy, 153, 112256.
[2] Teece, D. J. (2018). Business models and dynamic capabilities. Long range planning, 51(1), 40-49.
[3] Amui, L. B. L., Jabbour, C. J. C., de Sousa Jabbour, A. B. L., & Kannan, D. (2017). Sustainability as a dynamic organizational capability: A systematic review and a future agenda toward a sustainable transition. Journal of Cleaner Production, 142, 308-322.
[4] Hart, S. L. (1995). A natural-resource-based view of the firm. Academy of Management Review, 20(4), 986-1014.
[5] Lawson, B., & Samson, D. (2001). Developing innovation capability in organisations: a dynamic capabilities approach. International Journal of Innovation Management, 5(03), 377-400.
[6] Teece, D. J. (2007). Explicating dynamic capabilities: the nature and microfoundations of (sustainable) enterprise performance. Strategic Management Journal, 28(13), 1319-1350.
[7] Lin, Y. H., & Chen, Y. S. (2017). Determinants of green competitive advantage: The roles of green knowledge sharing, green dynamic capabilities, and green service innovation. Quality & Quantity, 51(4), 1663-1685.
[8] Omri, A., Hamza, F., & Alkahtani, N. (2025). When do innovation and renewable energy transition drive environmental sustainability?. Sustainability, 17(15), 6910.
[9] Elheddad, M., Benjasak, C., Deljavan, R., Alharthi, M., & Almabrok, J. M. (2021). The effect of the fourth industrial revolution on the environment: The relationship between electronic finance and pollution in OECD countries. Technological Forecasting and Social Change, 163, 120485.
[10] Ferraro, G., Ramponi, A., & Scarlatti, S. (2024). Fintech meets Industry 4.0: A systematic literature review of recent developments and future trends. Technology Analysis & Strategic Management, 36(8), 1911-1927.
[11] Du, P. C., Huang, S. J., Hong, Y., & Wu, W. (2022). Can FinTech improve corporate environmental, social, and governance performance? — A study based on the dual path of internal financing constraints and external fiscal incentives. Frontiers in Environmental Science, 10, 1061454.
[12] Moro-Visconti, R., Cruz Rambaud, S., & López Pascual, J. (2020). Sustainability in FinTechs: An explanation through business model scalability and market valuation. Sustainability, 12(24), 10316.
[13] Badrous, Y. M. L., Tawfik, O. I., Elmaasrawy, H. E., Srour, M. I., & Sharaf, M. A. A. (2025). Fintech adoption and commercial banks’ environmental performance: Do green accounting practices matter?. International Journal of Financial Studies, 13(2), 90.
[14] Okere, K. I., Dimnwobi, S. K., Fasanya, I. O., & Umeajaghaku, O. L. (2026). Innovation meets nature: Investigating the environmental impact of Fintech, technological innovation, and natural resource wealth in north africa. Environmental Modeling & Assessment,
[15] Guinot, J., Barghouti, Z., & Chiva, R. (2022). Understanding green innovation: A conceptual framework. Sustainability, 14(10), 5787.
[16] Dong, Q., Wu, Y. J., Lin, H., Sun, Z. B., & Liang, R. (2024). Fostering green innovation for corporate competitive advantages in big data era: The role of institutional benefits. Technology Analysis & Strategic Management, 36(2), 181-194.
[17] Chang, C. H. (2011). The influence of corporate environmental ethics on competitive advantage: The mediation role of green innovation. Journal of Business Ethics, 104(3), 361-370.
[18] Huang, J. W., & Li, Y. H. (2017). Green innovation and performance: The view of organizational capability and social reciprocity. Journal of Business Ethics, 145(2), 309-324.
[19] Rao, S. Y., Pan, Y., He, J., & Shangguan, X. M. (2022). Digital finance and corporate green innovation: quantity or quality?. Environmental Science and Pollution Research, 29(37), 56772-56791.
[20] Liu, J. M., Jiang, Y. L., Gan, S. D., He, L., & Zhang, Q. F., (2022). Can digital finance promote corporate green innovation?. Environmental Science and Pollution Research, 29(24), 35828-35840.
[21] Alsadoun, M., & Alrobai, F. S. (2024). Influence of fintech adoption on sustainable performance via mediation role of green finance and green innovation. American Journal of Business Science Philosophy, 1(1), 61-72.
[22] Maksimov, V., Wang, S. L., & Yan, S. P. (2022). Global connectedness and dynamic green capabilities in MNEs. Journal of International Business Studies, 53(4), 723-740.
[23] Jiang, W. B., Chai, H. Q., Shao, J., & Feng, T. W. (2018). Green entrepreneurial orientation for enhancing firm performance: A dynamic capability perspective. Journal of Cleaner Production, 198, 1311-1323.
[24] Xie, X. M., Huo, J. G., & Zou, H. L. (2019). Green process innovation, green product innovation, and corporate financial performance: A content analysis method. Journal of Business Research, 101, 697-706.
[25] Singh, S. K., Del Giudice, M., Chierici, R., & Graziano, D. (2020). Green innovation and environmental performance: The role of green transformational leadership and green human resource management. Technological Forecasting and Social Change, 150, 119762.
[26] Forés, B., Puig-Denia, A., Fernández-Yáñez, J. M., & Boronat-Navarro, M. (2023). Dynamic capabilities and environmental performance: All in the family. Management Decision, 61(13), 248-271.
[27] Mubeen, A., Nisar, Q. A., Patwary, A. K., Rehman, S., & Ahmad, W. (2024). Greening your business: nexus of green dynamic capabilities, green innovation and sustainable performance. Environment, Development and Sustainability, 26(9), 22747-22773.
[28] Shahzad, M., Qu, Y., Javed, S. A., Zafar, A. U., & Rehman, S. U. (2020). Relation of environment sustainability to CSR and green innovation: A case of Pakistani manufacturing industry. Journal of Cleaner Production, 253, 119938.
[29] Yan, K., Liu, N., Shi, L., Yang, L. S., & Lu, M. T. (2025). How does FinTech enable the expansion of green innovation boundaries: Evidence from the interventions of China’s environmental protection tax law. Energy Economics, 144, 108367.
[30] Tian, H., Siddik, A. B., Pertheban, T. R., & Rahman, M. N. (2023). Does fintech innovation and green transformational leadership improve green innovation and corporate environmental performance? A hybrid SEM–ANN approach. Journal of Innovation & Knowledge, 8(3), 100396.
[31] Yu, D. N., Tao, S., Hanan, A., Ong, T. S., Latif, B., & Ali, M. (2022). Fostering green innovation adoption through green dynamic capability: the moderating role of environmental dynamism and big data analytic capability. International Journal of Environmental Research and Public Health, 19(16), 10336.
[32] Jun, W., Ali, W., Bhutto, M. Y., Hussain, H., & Khan, N. A. (2021). Examining the determinants of green innovation adoption in SMEs: A PLS-SEM approach. European Journal of Innovation Management, 24(1), 67-87.
[33] Rehman, S. U., Bresciani, S., Yahiaoui, D., & Giacosa, E. (2022). Environmental sustainability orientation and corporate social responsibility influence on environmental performance of small and medium enterprises: The mediating effect of green capability. Corporate Social Responsibility and Environmental Management, 29(6), 1954-1967.
[34] Guenther, P., Guenther, M., Ringle, C. M., Zaefarian, G., & Cartwright, S. (2023). Improving PLS-SEM use for business marketing research. Industrial marketing management, 111, 127-142.
[35] Hair, J. F., Risher, J. J., Sarstedt, M., & Ringle, C. M. (2019). When to use and how to report the results of PLS-SEM. European business review, 31(1), 2-24.
[36] Cheung, G. W., Cooper-Thomas, H. D., Lau, R. S., & Wang, L. C. (2024). Reporting reliability, convergent and discriminant validity with structural equation modeling: A review and best-practice recommendations. Asia Pacific Journal of Management, 41(2), 745-783.
[37] Kline, R. B. (2016). Principles and Practice of Structural Equation Modeling (4th ed.). New York, NY: The Guilford Press.
[38] Sathyanarayana, S., & Mohanasundaram, T. (2024). Fit indices in structural equation modeling and confirmatory factor analysis: reporting guidelines. Asian Journal of Economics, Business and Accounting, 24(7), 561-577.
[39] Fornell, C., & Larcker, D. F. (1981). Evaluating structural equation models with unobservable variables and measurement error. Journal of Marketing Research, 18(1), 39-50.
[40] Forza, C., & Filippini, R. (1998). TQM impact on quality conformance and customer satisfaction: A causal model. International Journal of Production Economics, 55(1), 1-20.
[41] Haykin, S. (1994). Neural Networks: A Comprehensive Foundation. Upper Saddle River, NJ: Prentice Hall PTR.
[42] Lo, P. S., Dwivedi, Y. K., Tan, G. W. H., Ooi, K. B., Aw, E. C. X., & Metri, B. (2022). Why do consumers buy impulsively during live streaming? A deep learning-based dual-stage SEM-ANN analysis. Journal of Business Research, 147, 325-337.
[43] Leong, L. Y., Hew, T. S., Ooi, K. B., Tan, G. W. H., & Koohang, A. (2025). An SEM-ANN approach-guidelines in information systems research. Journal of Computer Information Systems, 65(6), 706-737.
[44] Alhumaid, K., Habes, M., & Salloum, S. A. (2021). Examining the factors influencing the mobile learning usage during COVID-19 pandemic: An integrated SEM-ANN method. IEEE Access, 9, 102567-102578.
[45] Liébana-Cabanillas, F., Marinković, V., & Kalinić, Z. (2017). A SEM-neural network approach for predicting antecedents of m-commerce acceptance. International Journal of Information Management, 37(2), 14-24.
[46] Leong, L. Y., Hew, T. S., Ooi, K. B., & Wei, J. (2020). Predicting mobile wallet resistance: A two-staged structural equation modeling-artificial neural network approach. International Journal of Information Management, 51, 102047.
[47] Lau, A. J., Tan, G. W. H., Loh, X. M., Leong, L. Y., Lee, V. H., & Ooi, K. B. (2021). On the way: hailing a taxi with a smartphone? A hybrid SEM-neural network approach. Machine Learning with Applications, 4, 100034.
[48] Lotfi Asl, S., Navroodi, I. H., & Kalteh, A. M. (2024). Sensitivity analysis and performance evaluation of neural networks for predicting forest stand volume–A case study: District 2, Kacha, Guilan province, Iran. Journal of Forest Science, 70(5), 209-222.
Cite This Article
  • APA Style

    Chen, Y., Ying, Y. (2026). The Impact of FinTech Adoption on Environmental Performance: The Mediation Role of Green Dynamic Capability and Green Innovation. Journal of Finance and Accounting, 14(4), 178-191. https://doi.org/10.11648/j.jfa.20261404.12

    Copy | Download

    ACS Style

    Chen, Y.; Ying, Y. The Impact of FinTech Adoption on Environmental Performance: The Mediation Role of Green Dynamic Capability and Green Innovation. J. Finance Account. 2026, 14(4), 178-191. doi: 10.11648/j.jfa.20261404.12

    Copy | Download

    AMA Style

    Chen Y, Ying Y. The Impact of FinTech Adoption on Environmental Performance: The Mediation Role of Green Dynamic Capability and Green Innovation. J Finance Account. 2026;14(4):178-191. doi: 10.11648/j.jfa.20261404.12

    Copy | Download

  • @article{10.11648/j.jfa.20261404.12,
      author = {Yiran Chen and Yulu Ying},
      title = {The Impact of FinTech Adoption on Environmental Performance: The Mediation Role of Green Dynamic Capability and Green Innovation},
      journal = {Journal of Finance and Accounting},
      volume = {14},
      number = {4},
      pages = {178-191},
      doi = {10.11648/j.jfa.20261404.12},
      url = {https://doi.org/10.11648/j.jfa.20261404.12},
      eprint = {https://article.sciencepublishinggroup.com/pdf/10.11648.j.jfa.20261404.12},
      abstract = {Environmental sustainability is increasingly viewed as a key priority for organizations striving to align economic growth with ecological responsibility. As digital technology continues to evolve rapidly, financial technology (FinTech) has emerged as a significant enabler of efficient financial services, improved information transparency, and optimized resource allocation. However, limited research has explored the organizational mechanisms through which FinTech adoption (FA) enhances environmental performance (ENP). To fill this gap, the present research investigates the impact of FA on ENP by exploring the mediating effects of green dynamic capability (GDC) and green innovation (GI). A conceptual framework integrating these constructs is developed and empirically tested using a hybrid analytical approach. Specifically, Partial Least Squares Structural Equation Modeling (PLS-SEM) is employed to evaluate the hypothesized relationships and mediating effects among the constructs. Subsequently, Artificial Neural Network (ANN) analysis is applied to assess the predictive strength and relative importance of the significant determinants identified in the PLS-SEM stage. FA exerts both direct and indirect positive effects on ENP, with GDC and GI acting as mediating pathways. Furthermore, ANN analysis shows that GDC exerts the strongest influence on ENP, followed by GI and FA. By integrating PLS-SEM and ANN, this research offers a more in-depth analytical perspective than single-method approaches and provides deeper insights into how FA facilitates organizational environmental sustainability.},
     year = {2026}
    }
    

    Copy | Download

  • TY  - JOUR
    T1  - The Impact of FinTech Adoption on Environmental Performance: The Mediation Role of Green Dynamic Capability and Green Innovation
    AU  - Yiran Chen
    AU  - Yulu Ying
    Y1  - 2026/08/13
    PY  - 2026
    N1  - https://doi.org/10.11648/j.jfa.20261404.12
    DO  - 10.11648/j.jfa.20261404.12
    T2  - Journal of Finance and Accounting
    JF  - Journal of Finance and Accounting
    JO  - Journal of Finance and Accounting
    SP  - 178
    EP  - 191
    PB  - Science Publishing Group
    SN  - 2330-7323
    UR  - https://doi.org/10.11648/j.jfa.20261404.12
    AB  - Environmental sustainability is increasingly viewed as a key priority for organizations striving to align economic growth with ecological responsibility. As digital technology continues to evolve rapidly, financial technology (FinTech) has emerged as a significant enabler of efficient financial services, improved information transparency, and optimized resource allocation. However, limited research has explored the organizational mechanisms through which FinTech adoption (FA) enhances environmental performance (ENP). To fill this gap, the present research investigates the impact of FA on ENP by exploring the mediating effects of green dynamic capability (GDC) and green innovation (GI). A conceptual framework integrating these constructs is developed and empirically tested using a hybrid analytical approach. Specifically, Partial Least Squares Structural Equation Modeling (PLS-SEM) is employed to evaluate the hypothesized relationships and mediating effects among the constructs. Subsequently, Artificial Neural Network (ANN) analysis is applied to assess the predictive strength and relative importance of the significant determinants identified in the PLS-SEM stage. FA exerts both direct and indirect positive effects on ENP, with GDC and GI acting as mediating pathways. Furthermore, ANN analysis shows that GDC exerts the strongest influence on ENP, followed by GI and FA. By integrating PLS-SEM and ANN, this research offers a more in-depth analytical perspective than single-method approaches and provides deeper insights into how FA facilitates organizational environmental sustainability.
    VL  - 14
    IS  - 4
    ER  - 

    Copy | Download

Author Information
  • Abstract
  • Keywords
  • Document Sections

    1. 1. Introduction
    2. 2. Research Framework and Hypotheses Development
    3. 3. Materials and Methods
    4. 4. Data Analysis and Results
    5. 5. Implications and Future Work
    Show Full Outline
  • Abbreviations
  • Acknowledgments
  • Author Contributions
  • Data Availability Statement
  • Conflicts of Interest
  • References
  • Cite This Article
  • Author Information