Abstract
Digital finance may reshape not only firms’ access to formal financial services but also the allocation of trade credit within supply chains. This study examines whether regional digital finance is associated with asymmetric changes in payment terms and whether supplier dependence conditions the economic consequences of such changes. Using 14,159 firm-year observations for Chinese A-share manufacturing firms from 2011 to 2021, the study matches firm-level financial, trade-credit, supply-chain concentration, and markup data with the prefecture-level Peking University Digital Financial Inclusion Index. Estimates with firm and time fixed effects show that digital finance is positively associated with the payable-period indicator but is not significantly related to the receivable-period indicator, indicating an asymmetric reallocation of trade credit toward purchasing firms. Coverage breadth and usage depth, rather than the technical digitization component alone, are primarily associated with this pattern. The payable-period indicator is positively associated with three alternative markup measures, suggesting that payment-term flexibility may support operating liquidity or reflect stronger buyer bargaining power. However, the direct association between digital finance and firm markups is sensitive to markup measurement, province-by-year fixed effects, and lagged specifications. Supplier concentration and overall supply-chain concentration significantly weaken the markup association of digital finance, whereas customer concentration has no statistically significant moderating effect. Robustness checks, leave-one-province-out estimates, and permutation tests support the contemporaneous relationships, although they do not establish definitive causality. The findings identify asymmetric trade-credit allocation as an important channel through which digital finance affects manufacturing firms and show that upstream supplier dependence limits firms’ ability to retain the resulting financial and operating advantages.
|
Published in
|
Journal of Finance and Accounting (Volume 14, Issue 5)
|
|
DOI
|
10.11648/j.jfa.20261405.11
|
|
Page(s)
|
213-225 |
|
Creative Commons
|

This is an Open Access article, distributed under the terms of the Creative Commons Attribution 4.0 International License (http://creativecommons.org/licenses/by/4.0/), which permits unrestricted use, distribution and reproduction in any medium or format, provided the original work is properly cited.
|
|
Copyright
|
Copyright © The Author(s), 2026. Published by Science Publishing Group
|
Keywords
Digital Finance, Trade Credit Allocation, Payment Terms, Supplier Dependence, Firm Markups
1. Introduction
Digital finance combines financial services with digital technologies such as mobile payments, big data credit assessment, cloud computing, and platform-based intermediation. China provides an informative setting because regional digital finance expanded rapidly after 2011, while access and usage remained uneven across cities. The Peking University Digital Financial Inclusion Index was developed to measure this variation through coverage breadth, usage depth, and the degree of digitization
| [1] | Guo, F., Wang, J., Wang, F., Kong, T., Zhang, X., Cheng, Z. Measuring China's Digital Financial Inclusion: Index Compilation and Spatial Characteristics. China Economic Quarterly. 2020, 19(4), 1401-1418. (in Chinese)
https://doi.org/10.13821/j.cnki.ceq.2020.03.12 |
[1]
. Digital finance may lower information and transaction costs, broaden access to payment and credit services, and improve the speed of financial decisions
| [2] | Ozili, P. K. Impact of Digital Finance on Financial Inclusion and Stability. Borsa Istanbul Review. 2018, 18(4), 329-340. https://doi.org/10.1016/j.bir.2017.12.003 |
| [3] | Gomber, P., Koch, J. A., Siering, M. Digital Finance and FinTech: Current Research and Future Research Directions. Journal of Business Economics. 2017, 87, 537-580.
https://doi.org/10.1007/s11573-017-0852-x |
[2, 3]
. Firm-level studies have linked regional digital finance to investment efficiency, innovation efficiency, and operating performance
| [4] | Huang, Z., Tao, Y., Luo, X., Ye, Y., Lei, T. Regional Digital Finance and Corporate Investment Efficiency in China. Applied Economics. 2023, 55(43), 5115-5134.
https://doi.org/10.1080/00036846.2022.2136616 |
| [5] | Wang, H., Liu, F. Digital Finance and Enterprise Innovation Efficiency: Evidence from China. Finance Research Letters. 2024, 59, 104709. https://doi.org/10.1016/j.frl.2023.104709 |
| [6] | Fu, S., Jiang, Y. Can Digital Finance Improve Corporate Performance? Evidence from China. Applied Economics. 2025, online first. https://doi.org/10.1080/00036846.2025.2563914 |
[4-6]
.
A less explored issue is whether digital finance changes the market position of manufacturing firms. Firm markups, defined as the ratio of price to marginal cost, summarize both efficiency-based advantages and market power. The production function approach proposed by De Loecker and Warzynski permits the estimation of markups using firm input expenditure and output elasticities
. Rising markups may reflect lower marginal costs, stronger product differentiation, or greater bargaining power, but they can also indicate weaker competition and rent extraction
| [8] | De Loecker, J., Eeckhout, J., Unger, G. The Rise of Market Power and the Macroeconomic Implications. Quarterly Journal of Economics. 2020, 135(2), 561-644.
https://doi.org/10.1093/qje/qjz041 |
| [9] | Melitz, M. J., Ottaviano, G. I. P. Market Size, Trade, and Productivity. The Review of Economic Studies. 2008, 75(1), 295-316. https://doi.org/10.1111/j.1467-937X.2007.00463.x |
[8, 9]
. Consequently, a positive relationship between digital finance and firm markups is economically ambiguous and must be interpreted together with the mechanisms through which liquidity and bargaining conditions change.
Manufacturing firms rely extensively on trade-credit. Suppliers allow buyers to delay payment, while firms may extend credit to customers through accounts receivable. Trade-credit can substitute for bank finance when information asymmetry or credit rationing limits formal borrowing
| [10] | Fazzari, S. M., Hubbard, R. G., Petersen, B. C. Financing Constraints and Corporate Investment. Brookings Papers on Economic Activity. 1988, 1988(1), 141-206.
https://doi.org/10.2307/2534426 |
| [11] | Campello, M., Graham, J. R., Harvey, C. R. The Real Effects of Financial Constraints: Evidence from a Financial Crisis. Journal of Financial Economics. 2010, 97(3), 470-487.
https://doi.org/10.1016/j.jfineco.2010.02.009 |
| [12] | Petersen, M. A., Rajan, R. G. Trade Credit: Theories and Evidence. Review of Financial Studies. 1997, 10(3), 661-691.
https://doi.org/10.1093/rfs/10.3.661 |
| [13] | Biais, B., Gollier, C. Trade Credit and Credit Rationing. Review of Financial Studies. 1997, 10(4), 903-937.
https://doi.org/10.1093/rfs/10.4.903 |
[10-13]
. Suppliers have monitoring and repossession advantages, and trade-credit can insure buyers against temporary liquidity shocks
| [14] | Cunat, V. Trade Credit: Suppliers as Debt Collectors and Insurance Providers. Review of Financial Studies. 2007, 20(2), 491-527. https://doi.org/10.1093/rfs/hhl015 |
| [15] | Shenoy, Jaideep and Williams, Ryan, Customer-Supplier Relationships and Liquidity Management: The Joint Effects of Trade Credit and Bank Lines of Credit (August 1, 2011). Midwest Finance Association 2012 Annual Meetings Paper,
http://dx.doi.org/10.2139/ssrn.1928852 |
| [16] | Garcia Appendini, E., Montoriol Garriga, J. Firms as Liquidity Providers: Evidence from the 2007-2008 Financial Crisis. Journal of Financial Economics. 2013, 109(1), 272-291.
https://doi.org/10.1016/j.jfineco.2013.02.010 |
| [17] | Klapper, L., Laeven, L., Rajan, R. Trade Credit Contracts. Review of Financial Studies. 2012, 25(3), 838-867.
https://doi.org/10.1093/rfs/hhr122 |
[14-17]
. During periods of financial stress, well-funded firms may transmit liquidity to customers through trade-credit
| [18] | Amberg, N., Jacobson, T., von Schedvin, E., Townsend, R. Trade Credit and the Transmission of Unconventional Monetary Policy. Review of Financial Studies. 2023, 36(2), 775-813. https://doi.org/10.1093/rfs/hhac040 |
[18]
. However, payment periods also reveal bargaining power: dominant buyers can extend accounts payable and shift working capital pressure upstream, while concentrated suppliers may restrict payment terms or raise input prices.
Supply-chain concentration is therefore central to the economic interpretation of digital finance. Stable relationships can facilitate information sharing, quality control, and relationship-specific investment. Excessive dependence on a small number of customers or suppliers, however, exposes firms to bargaining pressure and disruption risk. Customer concentration affects firm performance and the cost of capital
| [19] | Patatoukas, P. N. Customer Base Concentration: Implications for Firm Performance and Capital Markets. The Accounting Review. 2012, 87(2), 363-392.
https://doi.org/10.2308/accr-10198 |
| [20] | Dhaliwal, D. S., Judd, J. S., Serfling, M., Shaikh, S. Customer Concentration Risk and the Cost of Equity Capital. Journal of Accounting and Economics. 2016, 61(1), 23-48.
https://doi.org/10.1016/j.jacceco.2015.03.005 |
[19, 20]
, while buyer-supplier relationships can influence financing and capital structure choices
. Digital finance may improve the buyer's liquidity and information capacity, but these gains may be captured by suppliers when critical inputs are concentrated.
This study addresses three related questions. First, does regional digital finance change the allocation of trade credit asymmetrically between accounts payable and accounts receivable? Second, is the resulting payment-term flexibility associated with firm markups and other indicators of operating advantage? Third, does upstream supplier dependence limit firms’ ability to retain the financial and operating benefits associated with digital finance? To answer these questions, the analysis matches the prefecture-level digital finance index with firm-level payment-period indicators, supply-chain concentration, and three alternative markup measures for Chinese A-share manufacturing firms from 2011 to 2021.
This study makes three contributions. First, it shifts the analysis of digital finance from formal financing outcomes to the internal allocation of liquidity within supply chains. Existing studies mainly examine financing constraints, investment, innovation, and corporate performance. This study instead distinguishes between the payable and receivable sides of trade-credit. The positive association between digital finance and the payable-period indicator, combined with the absence of a significant receivable-period response, indicates that digital finance is related to an asymmetric rather than a general expansion of interfirm credit. Second, the study connects trade-credit allocation with firm-level operating outcomes while maintaining a cautious distinction between liquidity support and bargaining-power reinforcement. Longer payment periods may allow purchasing firms to preserve cash, stabilize production, and avoid costly short-term financing. They may also reflect buyers’ ability to postpone payments and transfer working-capital pressure to suppliers. The positive relationship between the payable-period indicator and alternative markup measures is therefore interpreted as evidence of economically meaningful payment-term flexibility, rather than as an unambiguous improvement in efficiency or welfare. Third, the study identifies upstream supplier dependence as an important boundary condition. Overall supply-chain concentration and supplier concentration weaken the markup association of digital finance, whereas customer concentration does not produce a statistically significant moderating effect. This asymmetry suggests that digital finance alone cannot eliminate dependence on critical suppliers. When supplier substitution is limited, upstream firms may capture part of the financial and operating gains through input prices, payment conditions, or delivery terms.
2. Literature Review and Hypotheses
2.1. Digital Finance and Asymmetric Trade-credit Allocation
Trade-credit is simultaneously a financing arrangement and a governance mechanism. Firms can use accounts payable to finance inventories and production before cash is received from customers. Digital finance may strengthen this channel by verifying transactions, improving credit scoring, and facilitating supply-chain finance. The resulting liquidity buffer can reduce emergency purchases, production interruptions, and forced discounts, thereby supporting higher markups.
Digital finance is more likely to lengthen accounts payable than accounts receivable because its principal tools operate around procurement and settlement. Digital transaction verification converts purchase orders, invoices, logistics records, and payment data into verifiable claims, reducing information risk for suppliers and platform lenders. Supply-chain finance platforms can then finance suppliers against confirmed receivables while allowing the focal buyer to settle at a later contractual date. The supplier receives liquidity from the platform or financial institution, but the buyer retains cash longer, so the immediate accounting effect appears in the buyer's payable-period indicator. By contrast, extending additional credit to downstream customers depends on the focal firm's sales policy, customer-risk tolerance, and willingness to bear receivables exposure; digital finance does not automatically relax these constraints. This institutional asymmetry explains why digital-finance coverage and usage may expand buyer-side payment flexibility without producing a comparable increase in accounts receivable.
However, a longer payment period can also indicate that the purchasing firm has sufficient bargaining power to postpone payment to suppliers. This interpretation is particularly relevant when the buyer is large and suppliers are fragmented. The distinction can be explored by comparing the effects of digital finance on payable and receivable periods. A positive association with payable periods but not receivable periods would indicate an asymmetric shift in credit allocation toward the purchasing firm rather than a general expansion of interfirm credit.
H1. Regional digital finance is positively associated with firms’ payable-period indicators but is not necessarily associated with a corresponding increase in receivable-period indicators.
2.2. Payment-Term Flexibility and Firm Markups
Digital finance can affect markups through both costs and demand. Data-based credit assessment may reduce financing frictions and support investment in equipment, research, quality improvement, and market expansion. Faster payment and settlement systems may lower transaction costs, while digital data can improve demand forecasting and pricing. Recent evidence for Chinese listed firms indicates that digital finance can improve innovation efficiency and corporate performance
. If these benefits reduce marginal cost or increase product differentiation, markups may rise without requiring a deterioration in competition.
The opposite effect is also plausible. Digital finance can expand financing access for entrants, increase price transparency, and reduce informational advantages enjoyed by incumbent firms. Stronger competition may lower markups even when productivity increases. The net relationship is therefore an empirical question. Because listed manufacturing firms generally possess complementary managerial and technological capabilities, the baseline expectation is that the cost and differentiation channels dominate.
H2. Greater payment-term flexibility on the payable side is positively associated with firm markups, although the relationship may reflect both operating-liquidity support and buyer bargaining power.
2.3. Supplier Dependence as a Boundary Condition
Digital finance cannot eliminate technological dependence on critical suppliers. When supplier concentration is high, the buyer has fewer alternatives and suppliers may appropriate a larger share of financing or efficiency gains through input prices, delivery conditions, and shorter credit periods. The markup benefit of digital finance should therefore decline with supplier concentration.
Customer concentration has a less certain effect. Powerful customers can impose lower prices and longer receivable periods, but large customers may also provide stable demand, certification, and information advantages. These offsetting mechanisms imply that supplier and customer concentration should be analyzed separately.
H3. Supplier dependence weakens firms’ ability to translate the financial and informational advantages associated with digital finance into higher markups, and this constraining effect is stronger for supplier concentration than for customer concentration.
3. Materials and Methods
3.1. Sample and Data Sources
This study uses an unbalanced panel of Chinese A-share manufacturing firms from 2011 to 2021. The sample is constructed as follows. First, firms designated as ST or *ST are excluded. Second, firms with fewer than three consecutive years of financial data are removed. Third, observations with missing values for the main variables are excluded. Finally, all continuous variables are winsorized at the 1st and 99th percentiles to mitigate the influence of extreme observations. Firm-level financial and supply-chain data are obtained from the CSMAR and WIND databases, which are widely used in research on Chinese listed firms. We use the digital finance inclusion index to measure the development of digital finance in a city; this index is compiled by a joint research group composed of the Institute of Digital Finance of Peking University and Ant Financial Services Group and is based on big data on digital inclusive finance collected by Ant Financial Services. Regional digital finance is measured by the prefecture- level Peking University Digital Financial Inclusion Index and its three components: coverage breadth, usage depth, and digitization level
| [1] | Guo, F., Wang, J., Wang, F., Kong, T., Zhang, X., Cheng, Z. Measuring China's Digital Financial Inclusion: Index Compilation and Spatial Characteristics. China Economic Quarterly. 2020, 19(4), 1401-1418. (in Chinese)
https://doi.org/10.13821/j.cnki.ceq.2020.03.12 |
[1]
.
The firm-level city codes are converted to the prefecture-level codes used in the digital finance index, and the datasets are matched by city and year. The resulting panel contains 14,159 firm-year observations, of which 14,117 are successfully matched with the digital finance index, corresponding to a match rate of 99.70%. Continuous variables in the source database were screened and winsorized before analysis. Firms with special treatment status and observations with unavailable key data were excluded in the underlying data construction.
3.2. Variables
Firm markups. The principal dependent variable is the markup estimated with the De Loecker-Warzynski method using a translog production function. Two alternatives are used for robustness: a De Loecker-Warzynski markup based on a Cobb-Douglas production function and an accounting-based markup. The three measures differ in level because they embody different assumptions about production technology and marginal cost. Conceptually, the De Loecker-Warzynski markup equals the estimated output elasticity of a flexible input divided by that input's expenditure share in revenue. The translog and Cobb-Douglas measures differ in the production function used to estimate the output elasticity, while the accounting-based measure compares operating revenue with an accounting proxy for variable operating costs. The markup measures are processed variables supplied by the licensed database; the original production-function estimation code is not contained in the research file.
Digital finance. The aggregate city-level index is divided by 100 to obtain a convenient scale. Coverage breadth, usage depth, and the digitization level are used to examine which dimension is most relevant. A one-unit increase in the rescaled variable equals a-100 point increase in the original index.
Trade-credit. The DPO and DSO indicators used in this study are processed variables obtained from the licensed CSMAR/WIND database. The licensed database provides processed payable- and receivable-period indicators based on standard DPO and DSO concepts. In standard accounting practice, DPO relates accounts payable to operating costs, while DSO relates accounts receivable to operating revenue. Under standard accounting definitions, DPO is typically calculated as average accounts payable divided by cost of goods sold or operating costs and multiplied by the number of days in the accounting period; DSO is typically calculated as average accounts receivable divided by operating revenue and multiplied by the number of days. Average balances generally use the mean of beginning- and end-of-period balances. Because the precise balance-sheet fields and transformation code used by the data provider are not included in the research file, the variables are interpreted as relative payment-period indicators rather than literal calendar days. Consequently, the coefficients reported in this study should be interpreted in terms of relative payment period length i.e., whether a firm extends or shortens its payment terms compared with other firms rather than as precise estimates of changes in actual days.
Supply-chain concentration. Overall concentration is measured from the disclosed shares of major customers and suppliers. Supplier concentration and customer concentration are analyzed separately. Higher values represent greater dependence on a limited number of trading partners.
Controls. The models control for capital intensity, leverage, cash holdings, Tobin’s Q, the book-to-market ratio, return on assets, R&D intensity, regional marketization, regional per capita gross domestic product, and industry concentration. Firm fixed effects, year fixed effects, industry-by-year fixed effects, and province-by-year fixed effects are included in different specifications.
Annual-report content measures. The licensed database supplies two processed firm-year measures derived from annual report digital-transformation content. The first is the principal text index and the second is an alternative textual specification. A third validation measure captures digital-related intangible assets. The raw annual report corpus and dictionary are not redistributed; therefore, these variables are used as processed content analysis measures and as an extension rather than as the principal identification strategy.
Table 1. Descriptive statistics.
Variable | N | Mean | SD | Median |
Markup, translog | 14,159 | 1.407 | 0.378 | 1.323 |
Markup, Cobb-Douglas | 14,159 | 1.202 | 0.392 | 1.099 |
Accounting markup | 14,132 | 1.182 | 0.217 | 1.139 |
Digital finance | 14,117 | 2.387 | 0.655 | 2.446 |
Payable period indicator | 14,133 | 4.333 | 0.794 | 4.409 |
Receivable period indicator | 14,146 | 4.119 | 1.093 | 4.315 |
Overall concentration | 14,159 | 0.309 | 0.151 | 0.286 |
Supplier concentration | 14,159 | 0.319 | 0.181 | 0.280 |
Customer concentration | 14,159 | 0.301 | 0.203 | 0.246 |
Capital intensity | 14,159 | 2.247 | 1.455 | 1.868 |
Tobin’s Q | 14,159 | 2.031 | 1.258 | 1.625 |
Book-to-market ratio | 14,159 | 0.622 | 0.253 | 0.615 |
Industry concentration | 14,060 | 0.153 | 0.134 | 0.106 |
Leverage | 14,159 | 0.445 | 0.188 | 0.444 |
Cash holdings | 14,159 | 0.176 | 0.115 | 0.147 |
Return on assets | 14,159 | 0.034 | 0.062 | 0.034 |
R&D intensity | 14,159 | 0.044 | 0.041 | 0.035 |
Regional Marketization | 14,159 | 9.564 | 1.660 | 9.750 |
GDP per capita | 14,145 | 8.113 | 3.458 | 7.444 |
3.3. Empirical Models
The baseline fixed effects model is specified as follows:
Markupit= α + βDFIct+ γXit+ μi+ λt+ εit(1)
where Markupit is the markup of firm i in year t, DFIct is the digital finance index for city c, Xit is the vector of controls, μi denotes firm fixed effects, and λt denotes year fixed effects. Standard errors are clustered by city because digital finance varies at the city-year level.
The trade-credit equation is:
Creditit=α +θDFIct+ γXit+ μi+ λt+ εit(2)
Creditit is alternatively the payable period or receivable period indicator. To examine whether payment periods are associated with markups, DPO is added to equation (1). The moderating model is:
Markupit=α+β1DFIct+β2SCCit+β3DFIct×SCCit+γXit+ FE +εit(3)
Digital finance and concentration variables are mean-centered before interaction terms are constructed. The principal moderation models absorb firm and industry-by-year fixed effects.
Robustness analysis changes the fixed effect structure, sample window, outlier treatment, and clustering level. It also excludes municipalities and the five cities with the highest average digital finance index, retains firms observed for at least eight years, and estimates one- and two-year lag specifications. A leave-one-province-out exercise evaluates geographic influence. Finally, digital finance values are randomly reassigned across cities within each year 500 times while preserving the year distribution; the resulting placebo coefficients are compared with the actual estimate.
The content analysis extension estimates the association between regional digital finance and each processed digital transformation measure and then interacts mean-centered digital finance with mean centered corporate digitalization:
Markupit=α+β1DFIct+β2DCit+β3DFIct×DCit+γXit+ FE +εit(4)
4. Results
4.1. Digital Finance and Asymmetric Trade-credit Allocation
Table 2. Digital finance and trade-credit allocation.
Specification | Coefficient | N | Within R2 |
Payable period: firm and year FE | 0.260*** (0.088) | 13,978 | 0.219 |
Payable period: industry-by-year FE | 0.197** (0.084) | 13,978 | 0.211 |
Receivable period: firm and year FE | 0.153 (0.118) | 13,991 | 0.178 |
Coverage breadth | 0.182** (0.075) | 13,978 | 0.218 |
Usage depth | 0.134** (0.052) | 13,978 | 0.218 |
Digitization level | 0.022 (0.026) | 13,978 | 0.217 |
The principal empirical finding concerns the asymmetric allocation of trade credit. Digital finance is positively associated with the payable-period indicator both in the specification with firm and year fixed effects and in the specification with firm and industry-by-year fixed effects. In contrast, its association with the receivable-period indicator is statistically insignificant. The evidence therefore does not support a general expansion of interfirm credit in both directions. Instead, digital finance is associated primarily with greater payment flexibility on the purchasing side of manufacturing firms.
This asymmetry has two possible interpretations. The first is a liquidity-support channel: digital transaction data, credit assessment, and supply-chain finance may enable firms to obtain longer supplier credit and preserve working capital. The second is a bargaining-power channel: firms with better access to financial and informational resources may postpone payments and shift liquidity pressure upstream. The existing data cannot fully distinguish between voluntary supplier credit and buyer-induced payment delay. The results should therefore be interpreted as evidence of asymmetric trade-credit allocation rather than an unequivocal improvement in financing efficiency.
4.2. Digital Finance and Firm Markups
Firm markups are examined as an economically important secondary outcome rather than as the sole or principal measure of the effect of digital finance. A higher markup may reflect lower marginal costs, greater product differentiation, improved pricing capacity, or stronger bargaining power. It should not automatically be interpreted as higher efficiency or welfare.
Digital finance is positively associated with the translog-based markup. The coefficient is 0.099 under firm and year fixed effects and 0.086 when industry-by-year effects are included. A one-standard deviation increase in the rescaled digital finance index is associated with an increase of approximately 0.065 in the translog markup, or about 4.6% of its sample mean.
Table 3. Digital finance and alternative firm markups.
Specification | DFI coefficient | N | Within R2 |
Translog markup: firm and year FE | 0.099** (0.042) | 14,004 | 0.158 |
Translog markup: industry-by-year FE | 0.086** (0.037) | 14,004 | 0.159 |
Translog markup: province-by-year FE | 0.048 (0.047) | 14,004 | 0.158 |
Cobb-Douglas markup: firm and year FE | 0.041 (0.038) | 14,004 | 0.159 |
Accounting markup: firm and year FE | 0.016 (0.025) | 13,977 | 0.395 |
The coefficient becomes smaller and insignificant after province-by-year fixed effects are included. Province-by-year fixed effects absorb province-wide annual shocks, including regional digital-finance policies, macroeconomic conditions, regulatory changes, and infrastructure investment; identification therefore relies only on within-province, across-city variation in a given year. It is also statistically insignificant for the Cobb-Douglas and accounting-based markup measures. The markup results provide secondary evidence on the possible operating consequences of digital finance and trade-credit allocation. Digital finance is positively associated with the translog markup under firm and year fixed effects and under firm and industry-by-year fixed effects, but the relationship is not robust to province-by-year fixed effects or alternative markup measures. The results therefore do not support a universal markup effect. They instead suggest that the economic consequences of digital finance depend on production-function assumptions, regional conditions, and supply-chain structure. The evidence suggests a positive relationship under the flexible translog production specification, but the result is sensitive to the markup measure and to stringent regional controls.
4.3. Payment Periods and Firm Markups
Table 4. Trade-credit allocation and firm markups.
Markup measure | Payable period | Digital finance | N | Within R2 |
Translog markup | 0.048*** (0.009) | 0.087** (0.042) | 13,978 | 0.166 |
Cobb-Douglas markup | 0.052*** (0.009) | 0.028 (0.038) | 13,978 | 0.167 |
Accounting markup | 0.031*** (0.007) | 0.009 (0.025) | 13,951 | 0.397 |
The payable period indicator is positively related to all three markup measures. The coefficients are 0.048 for the translog markup, 0.052 for the Cobb-Douglas markup, and 0.031 for the accounting markup; each is significant at the 1% level. When the payable period indicator is added, the digital finance coefficient in the translog model decreases from 0.099 to 0.087 but remains significant at the 5% level.
These patterns are consistent with Hypothesis 2, but they do not establish a formal causal mediation effect. A longer payable period can provide operating liquidity and reduce short-term financing pressure. It can also represent the exercise of buyer bargaining power over suppliers. The fact that the association is observed across all markup measures makes trade-credit allocation more empirically stable than the direct digital finance coefficient, but its welfare interpretation remains ambiguous.
4.4. The Moderating Role of Supply-chain Concentration
Table 5. Supply-chain concentration and the markup association of digital finance.
Moderator | Markup | Interaction | N | Within R2 |
Overall concentration | Translog | -0.056** (0.026) | 14,004 | 0.164 |
Overall concentration | Cobb-Douglas | -0.058** (0.025) | 14,004 | 0.166 |
Supplier concentration | Translog | -0.046** (0.022) | 14,004 | 0.167 |
Supplier concentration | Cobb-Douglas | -0.048** (0.023) | 14,004 | 0.168 |
Customer concentration | Translog | -0.022 (0.020) | 14,004 | 0.159 |
Customer concentration | Cobb-Douglas | -0.025 (0.018) | 14,004 | 0.161 |
The interaction between digital finance and overall supply-chain concentration is negative and significant for both production function markup measures. Supplier concentration produces a similar negative interaction, whereas the customer concentration interaction is statistically insignificant. The results support Hypothesis 3 and indicate that the constraining effect originates primarily upstream.
High supplier concentration limits substitution among critical input providers. Suppliers can respond to improved buyer liquidity by increasing input prices, tightening delivery conditions, or retaining a larger share of the surplus. Digital finance therefore cannot fully translate into a markup advantage when the firm remains dependent on a small number of suppliers. Customer concentration may produce offsetting effects: bargaining pressure from major customers can reduce selling prices, but stable large customers can improve demand predictability and creditworthiness.
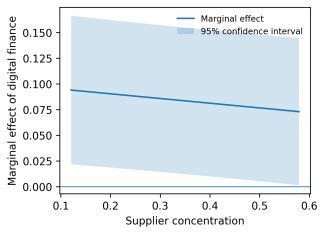
Figure 1. Marginal effect of digital finance at different levels of supplier concentration.
Figure 1 illustrates the interaction result. The estimated marginal effect of digital finance declines as supplier concentration increases. At high levels of supplier dependence, the confidence interval includes zero, indicating that the markup association of digital finance becomes economically and statistically weak.
4.5. Robustness Checks
Table 6. Robustness checks for digital finance, firm markups, and the payable period indicator.
Specification | Markup coefficient | Payable period coefficient | N: markup/payable |
Baseline firm and year FE | 0.099** (0.042) | 0.260*** (0.088) | 14,004/13,978 |
Industry-by-year FE | 0.086** (0.037) | 0.196** (0.084) | 14,004/13,978 |
Province-by-year FE | 0.048 (0.047) | 0.154 (0.106) | 14,004/13,978 |
Exclude 2020-2021 | 0.102** (0.042) | 0.173* (0.092) | 10,419/10,395 |
At least 8 observed years | 0.123** (0.058) | 0.190 (0.127) | 6,397/6,385 |
Exclude municipalities | 0.086** (0.043) | 0.283*** (0.096) | 11,505/11,484 |
Exclude top five DFI cities | 0.089** (0.044) | 0.279*** (0.092) | 13,455/13,431 |
2.5% re-winsorization | 0.087*** (0.030) | 0.125 (0.079) | 14,004/13,978 |
DFI lagged one year | -0.003 (0.014) | -0.012 (0.030) | 11,611/11,591 |
DFI lagged two years | -0.018 (0.013) | -0.012 (0.031) | 9,212/9,195 |
Table 6 shows that the contemporaneous markup coefficient remains positive and statistically significant when the pandemic years are excluded, when only firms observed for at least eight years are retained, when municipalities or the five highest DFI cities are excluded, and when continuous variables are re-winsorized at the 2.5th and 97.5th percentiles. The payable period result is similarly stable after excluding municipalities and high DFI cities, but it becomes weaker in the balanced and tighter winsorization samples.
The robustness exercises also define the limits of the evidence. Province-by-year fixed effects reduce both contemporaneous coefficients and make them statistically insignificant, indicating sensitivity to stringent regional controls. These fixed effects absorb province-wide economic trends and digital policies and thus remove a substantial share of the regional variation used by the baseline specification. In addition, the one- and two-year lagged digital-finance coefficients are insignificant; the estimates are therefore not interpreted as persistent lagged effects. In the leave-one-province-out exercise, all 31 markup coefficients are positive, range from 0.084 to 0.114, and 28 are significant at the 5 percent level, indicating that no single province drives the baseline association.
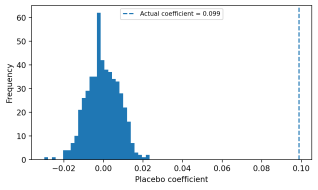
Figure 2. Distribution of placebo coefficients from 500 within-year city permutations.
The placebo coefficients have a mean of -0.0003 and a standard deviation of 0.0080, whereas the actual coefficient is 0.099. No placebo coefficient is as large as the actual estimate in absolute value; the add-one empirical two-sided p-value is 0.002. The test reduces concern that the result is mechanically generated by the year distribution of digital finance or by arbitrary city assignment, although it does not solve omitted-variable or reverse-causality problems.
4.6. Annual-Report Content Analysis
The annual report extension examines whether the external digital finance environment is reflected in firms' own digital transformation narratives and whether the two forms of digitalization are complementary. The two text variables are processed content scores supplied in the firm database, while the third measure captures digital-related intangible assets. All interaction variables are constructed after mean-centering.
Table 7. Annual-report content measures and digital finance complementarity.
Digitalization measure | DFI to measure | DFI x measure: year FE | DFI x measure: industry-by-year FE | N |
Annual report text index 1 | 0.405** (0.166) | 0.021*** (0.003) | 0.005 (0.003) | 14,004 |
Annual report text index 2 | 0.193 (0.192) | 0.021*** (0.003) | 0.008** (0.004) | 14,004 |
Digital intangible asset measure | -0.169 (0.169) | 0.015*** (0.003) | 0.007 (0.005) | 11,116 |
Digital finance is positively associated with the principal annual report text index, with a coefficient of 0.405 that is significant at the 5 percent level. The second text index and the digital intangible asset measure do not exhibit a significant direct association with regional digital finance. This difference suggests that the strongest content response is in the primary narrative measure rather than in balance-sheet digital assets.
The interaction between digital finance and each digitalization measure is positive under firm and year fixed effects. After industry-by-year effects are absorbed, the interaction remains significant only for the alternative annual report text index, at 0.008 with a standard error of 0.004. The content evidence therefore supports complementarity between external digital finance and internal digital capability, but also shows that part of the relationship reflects common industry-year digitalization trends.
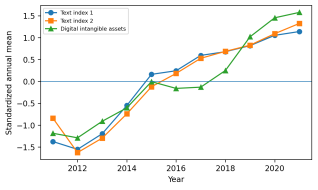
Figure 3. Standardized annual means of corporate digitalization measures.
Both annual report text indices rise markedly after 2013, and the digital intangible asset measure also increases over the latter part of the sample. Because the figure standardizes each series, it describes relative time patterns rather than differences in original measurement units. The common upward movement reinforces the need for industry-year and other time-varying controls in content-based digitalization analysis.
4.7. Heterogeneity Analysis
Table 8. Heterogeneity in the digital finance payable period relationship.
Subsample | DFI coefficient | N | Within R2 |
Small firms | 0.485*** (0.130) | 6,937 | 0.220 |
Large firms | 0.107 (0.105) | 7,041 | 0.236 |
Young firms | 0.255** (0.125) | 7,484 | 0.208 |
Mature firms | 0.204 (0.137) | 6,494 | 0.225 |
Non-state-owned firms | 0.244* (0.125) | 8,426 | 0.221 |
State-owned firms | 0.267** (0.135) | 4,925 | 0.245 |
Non-high-tech manufacturing | 0.334*** (0.094) | 12,154 | 0.207 |
High-tech manufacturing | -0.046 (0.151) | 1,824 | 0.283 |
The positive association between digital finance and the payable-period indicator is statistically evident in the subsamples of small firms, young firms, and non-high-tech manufacturers. It is also statistically significant in both the state-owned and non-state-owned subsamples, although no formal cross-group coefficient-difference test is reported. The results suggest that digital finance does not operate exclusively through conventional financial exclusion; organizational capacity, procurement structure, and supply-chain bargaining conditions also shape the allocation of trade credit.
The subsample estimates indicate that the positive association between digital finance and the payable-period indicator is statistically evident among non-high-tech manufacturers, whereas the coefficient for high-tech manufacturers is not statistically significant. However, significance in one subgroup and insignificance in another do not establish that the two coefficients are statistically different. The result should therefore be interpreted as exploratory. Differences in external financing access, asset tangibility, working-capital dependence, and innovation expenditure may provide possible explanations, but these mechanisms require direct testing in future research.
5. Discussion
The central contribution of this study is the identification of an asymmetric relationship between regional digital finance and supply-chain payment terms. Previous firm-level studies emphasize financing constraints, innovation, and investment efficiency
| [4] | Huang, Z., Tao, Y., Luo, X., Ye, Y., Lei, T. Regional Digital Finance and Corporate Investment Efficiency in China. Applied Economics. 2023, 55(43), 5115-5134.
https://doi.org/10.1080/00036846.2022.2136616 |
| [5] | Wang, H., Liu, F. Digital Finance and Enterprise Innovation Efficiency: Evidence from China. Finance Research Letters. 2024, 59, 104709. https://doi.org/10.1016/j.frl.2023.104709 |
| [6] | Fu, S., Jiang, Y. Can Digital Finance Improve Corporate Performance? Evidence from China. Applied Economics. 2025, online first. https://doi.org/10.1080/00036846.2025.2563914 |
| [22] | Shi, Y. Digital Finance and Corporate Breakthrough Innovation: Evidence from China. PLoS ONE. 2024, 19(7), e0307737.
https://doi.org/10.1371/journal.pone.0307737 |
[4-6, 22]
. Digital finance is associated with a longer payable-period indicator, but not with a corresponding change in the receivable-period indicator. This pattern indicates that the effects of digital finance extend beyond access to formal loans and investment finance. They also involve the allocation of liquidity between purchasing firms, suppliers, and customers.
The markup analysis provides evidence on the possible economic consequences of this asymmetry. Longer payable periods are positively associated with all three markup measures, whereas the direct relationship between digital finance and markups is sensitive to measurement and fixed-effect specifications. The more stable interpretation is therefore not that digital finance universally increases firm market power, but that payment-term flexibility constitutes an economically relevant channel through which digital finance may affect firms’ operating position. This mechanism is consistent with the traditional view that trade-credit provides insurance and complements bank lending
| [12] | Petersen, M. A., Rajan, R. G. Trade Credit: Theories and Evidence. Review of Financial Studies. 1997, 10(3), 661-691.
https://doi.org/10.1093/rfs/10.3.661 |
| [13] | Biais, B., Gollier, C. Trade Credit and Credit Rationing. Review of Financial Studies. 1997, 10(4), 903-937.
https://doi.org/10.1093/rfs/10.4.903 |
| [14] | Cunat, V. Trade Credit: Suppliers as Debt Collectors and Insurance Providers. Review of Financial Studies. 2007, 20(2), 491-527. https://doi.org/10.1093/rfs/hhl015 |
| [15] | Shenoy, Jaideep and Williams, Ryan, Customer-Supplier Relationships and Liquidity Management: The Joint Effects of Trade Credit and Bank Lines of Credit (August 1, 2011). Midwest Finance Association 2012 Annual Meetings Paper,
http://dx.doi.org/10.2139/ssrn.1928852 |
| [16] | Garcia Appendini, E., Montoriol Garriga, J. Firms as Liquidity Providers: Evidence from the 2007-2008 Financial Crisis. Journal of Financial Economics. 2013, 109(1), 272-291.
https://doi.org/10.1016/j.jfineco.2013.02.010 |
| [17] | Klapper, L., Laeven, L., Rajan, R. Trade Credit Contracts. Review of Financial Studies. 2012, 25(3), 838-867.
https://doi.org/10.1093/rfs/hhr122 |
[12-17]
.
Supplier dependence further conditions this process. The negative interaction between digital finance and supplier concentration indicates that firms cannot fully retain the financial or informational advantages associated with digital finance when they depend heavily on a small number of upstream partners. Critical suppliers may capture part of these advantages through input prices, payment conditions, or delivery requirements. The absence of a comparable customer-concentration effect highlights the specifically upstream nature of this constraint. It also complements evidence that customer and supplier relationships affect performance, capital costs, and financing policy
| [19] | Patatoukas, P. N. Customer Base Concentration: Implications for Firm Performance and Capital Markets. The Accounting Review. 2012, 87(2), 363-392.
https://doi.org/10.2308/accr-10198 |
| [20] | Dhaliwal, D. S., Judd, J. S., Serfling, M., Shaikh, S. Customer Concentration Risk and the Cost of Equity Capital. Journal of Accounting and Economics. 2016, 61(1), 23-48.
https://doi.org/10.1016/j.jacceco.2015.03.005 |
| [21] | Banerjee, S., Dasgupta, S., Kim, Y. Buyer-Supplier Relationships and the Stakeholder Theory of Capital Structure. Journal of Finance. 2008, 63(5), 2507-2552.
https://doi.org/10.1111/j.1540-6261.2008.01403.x |
[19-21]
.
Digital financial development should be evaluated using supply-chain distributional indicators, including payment periods, receivables financing, and the liquidity conditions of small suppliers. Expanding digital credit to large buyers may improve production continuity, but it can also lengthen payment chains. The empirical patterns imply three targeted policy responses. First, given the positive association between digital finance and the payable-period indicator, regulators should monitor whether core firms use digital credit to delay supplier payments, particularly when supplier concentration is high. Second, payment term disclosure should be mandated in concentrated industries, enabling smaller suppliers and financial intermediaries to assess liquidity risk more accurately. Third, financial institutions should extend receivable financing products to small and medium sized suppliers rather than confining digital supply-chain finance to core buyers. Managers, in turn, should combine digital finance adoption with supplier diversification, as the markup benefit of digital finance is significantly attenuated by upstream concentration. These recommendations derive from the study's evidence of an asymmetric association between digital finance and trade-credit allocation. This pattern is consistent with both liquidity support and potential bargaining-power redistribution, but the available data do not allow the two mechanisms to be fully separated.
6. Conclusions
This study examines how regional digital finance is associated with the allocation of trade credit within Chinese manufacturing supply chains and whether supplier dependence conditions the economic consequences of that allocation. Using firm-level data matched with the prefecture-level Peking University Digital Financial Inclusion Index, the study identifies a clear asymmetry in payment-term responses.
The main finding is that digital finance is positively associated with the payable-period indicator but is not significantly associated with the receivable-period indicator. Digital finance therefore appears to be related to greater payment flexibility for purchasing firms rather than to a proportional expansion of credit in both directions. Coverage breadth and usage depth are more strongly related to this pattern than the digitization component alone.
A longer payable period is positively associated with three alternative firm markup measures. This relationship is consistent with operating-liquidity support, because delayed payment can preserve cash and reduce short-term financing pressure. However, it may also reflect stronger buyer bargaining power and the transfer of working-capital pressure to suppliers. The available data do not allow these two interpretations to be fully separated.
Firm markups are therefore treated as an important secondary outcome rather than as the paper’s sole or strongest conclusion. The direct association between digital finance and markups is positive under the translog specification and remains stable across several sample and placebo checks, but it is sensitive to alternative markup measures, province-by-year fixed effects, and lagged specifications.
Supplier dependence constitutes a key boundary condition. Overall supply-chain concentration and supplier concentration weaken the markup association of digital finance, while customer concentration does not have a statistically significant moderating effect. This result suggests that upstream dependence limits firms’ ability to retain the financial and operating advantages associated with digital finance.
The policy implication is that digital-finance development should be evaluated not only by the volume of formal credit or the performance of core firms, but also by the distribution of payment periods and liquidity within supply chains. Digital supply-chain finance should improve the financing access of small suppliers, promote transparent payment-term disclosure, and prevent financially stronger buyers from transferring excessive working-capital pressure upstream.
The study remains subject to several limitations. The trade-credit indicators do not distinguish voluntary supplier financing from delayed payment induced by buyer bargaining power, and the concentration measures do not identify individual supplier-customer links. Future research should combine transaction-level payment data, matched buyer-supplier networks, accounts-receivable financing, and exogenous fintech policy experiments to distinguish liquidity support from bargaining-power reinforcement.
Abbreviations
DFI | Digital Financial Inclusion |
DPO | Processed Payable-Period Indicator Based on Days Payable Outstanding |
DSO | Processed Receivable-Period Indicator Based on Days Sales Outstanding |
DLW | De Loecker-Warzynski |
SCC | Supply-chain Concentration |
DC | Digital Content |
FE | Fixed Effects |
R&D | Research and Development |
Acknowledgments
The author acknowledges the academic resources and international research environment provided during a visiting scholarship at Michigan State University.
Author Contributions
Shiwang Huang: Conceptualization, Data curation, Formal Analysis, Investigation, Methodology, Writing – original draft, Writing – review & editing
Kaiyrbek Makulov: Project administration, Resources, Software, Validation, Visualization
Funding
This study was supported by the Overseas Research and Further Education Program for Young and Middle-Aged Backbone Teachers from Universities in Fujian Province; the Fujian Provincial High-Level Talent and Outstanding Young Talent Development Program; and the High-Level Talent Scientific Research Fund of Quanzhou Normal University (Grant No. H20011).
Data Availability Statement
The firm-level and annual-report data used in this study are subject to licensing restrictions imposed by the original data providers and therefore cannot be redistributed publicly. Subject to those restrictions, the processed research panel, variable dictionary, sample audit workbook, Stata replication code, robustness specifications, content-analysis variables, and permutation routine are available from the corresponding author upon reasonable request and evidence of appropriate database authorization, including for editorial review. The regional digital finance index is available from the Institute of Digital Finance, Peking University.
Conflicts of Interest
The authors declare no conflicts of interest.
Appendix
Variable Definitions
Markup: DLW translog production function markup; alternative Cobb-Douglas and accounting measures are used.
Digital finance: prefecture-level Peking University Digital Financial Inclusion Index divided by 100.
Payable period: processed relative DPO indicator from the licensed firm database.
Receivable period: processed relative DSO indicator from the licensed firm database.
Overall concentration: composite concentration of major customers and suppliers.
Supplier concentration: share-based concentration of the top disclosed suppliers.
Customer concentration: share-based concentration of the top disclosed customers.
Capital intensity: Processed firm-level capital-intensity measure obtained from the licensed database. Higher values indicate a greater degree of capital intensity.
Tobin’s Q: Processed firm-level Tobin’s Q measure obtained from the licensed database, reflecting the firm’s market valuation relative to its asset base. Higher values indicate a higher market valuation and stronger perceived growth opportunities.
Book-to-market ratio: A processed firm-level measure obtained from the licensed database, calculated conceptually as the book value of equity relative to its market value. Higher values indicate that book equity represents a larger proportion of market valuation.
Industry concentration: Industry-level Herfindahl–Hirschman concentration measure obtained from the licensed database. Higher values indicate that economic activity within the relevant industry is more concentrated among a smaller number of firms.
Controls: capital intensity, leverage, cash holdings, Tobin’s Q, the book-to-market ratio, return on assets, R&D intensity, regional marketization, regional per capita gross domestic product, and industry concentration.
References
| [1] |
Guo, F., Wang, J., Wang, F., Kong, T., Zhang, X., Cheng, Z. Measuring China's Digital Financial Inclusion: Index Compilation and Spatial Characteristics. China Economic Quarterly. 2020, 19(4), 1401-1418. (in Chinese)
https://doi.org/10.13821/j.cnki.ceq.2020.03.12
|
| [2] |
Ozili, P. K. Impact of Digital Finance on Financial Inclusion and Stability. Borsa Istanbul Review. 2018, 18(4), 329-340.
https://doi.org/10.1016/j.bir.2017.12.003
|
| [3] |
Gomber, P., Koch, J. A., Siering, M. Digital Finance and FinTech: Current Research and Future Research Directions. Journal of Business Economics. 2017, 87, 537-580.
https://doi.org/10.1007/s11573-017-0852-x
|
| [4] |
Huang, Z., Tao, Y., Luo, X., Ye, Y., Lei, T. Regional Digital Finance and Corporate Investment Efficiency in China. Applied Economics. 2023, 55(43), 5115-5134.
https://doi.org/10.1080/00036846.2022.2136616
|
| [5] |
Wang, H., Liu, F. Digital Finance and Enterprise Innovation Efficiency: Evidence from China. Finance Research Letters. 2024, 59, 104709.
https://doi.org/10.1016/j.frl.2023.104709
|
| [6] |
Fu, S., Jiang, Y. Can Digital Finance Improve Corporate Performance? Evidence from China. Applied Economics. 2025, online first.
https://doi.org/10.1080/00036846.2025.2563914
|
| [7] |
De Loecker, J., Warzynski, F. Markups and Firm-Level Export Status. American Economic Review. 2012, 102(6), 2437-2471.
https://doi.org/10.1257/aer.102.6.2437
|
| [8] |
De Loecker, J., Eeckhout, J., Unger, G. The Rise of Market Power and the Macroeconomic Implications. Quarterly Journal of Economics. 2020, 135(2), 561-644.
https://doi.org/10.1093/qje/qjz041
|
| [9] |
Melitz, M. J., Ottaviano, G. I. P. Market Size, Trade, and Productivity. The Review of Economic Studies. 2008, 75(1), 295-316.
https://doi.org/10.1111/j.1467-937X.2007.00463.x
|
| [10] |
Fazzari, S. M., Hubbard, R. G., Petersen, B. C. Financing Constraints and Corporate Investment. Brookings Papers on Economic Activity. 1988, 1988(1), 141-206.
https://doi.org/10.2307/2534426
|
| [11] |
Campello, M., Graham, J. R., Harvey, C. R. The Real Effects of Financial Constraints: Evidence from a Financial Crisis. Journal of Financial Economics. 2010, 97(3), 470-487.
https://doi.org/10.1016/j.jfineco.2010.02.009
|
| [12] |
Petersen, M. A., Rajan, R. G. Trade Credit: Theories and Evidence. Review of Financial Studies. 1997, 10(3), 661-691.
https://doi.org/10.1093/rfs/10.3.661
|
| [13] |
Biais, B., Gollier, C. Trade Credit and Credit Rationing. Review of Financial Studies. 1997, 10(4), 903-937.
https://doi.org/10.1093/rfs/10.4.903
|
| [14] |
Cunat, V. Trade Credit: Suppliers as Debt Collectors and Insurance Providers. Review of Financial Studies. 2007, 20(2), 491-527.
https://doi.org/10.1093/rfs/hhl015
|
| [15] |
Shenoy, Jaideep and Williams, Ryan, Customer-Supplier Relationships and Liquidity Management: The Joint Effects of Trade Credit and Bank Lines of Credit (August 1, 2011). Midwest Finance Association 2012 Annual Meetings Paper,
http://dx.doi.org/10.2139/ssrn.1928852
|
| [16] |
Garcia Appendini, E., Montoriol Garriga, J. Firms as Liquidity Providers: Evidence from the 2007-2008 Financial Crisis. Journal of Financial Economics. 2013, 109(1), 272-291.
https://doi.org/10.1016/j.jfineco.2013.02.010
|
| [17] |
Klapper, L., Laeven, L., Rajan, R. Trade Credit Contracts. Review of Financial Studies. 2012, 25(3), 838-867.
https://doi.org/10.1093/rfs/hhr122
|
| [18] |
Amberg, N., Jacobson, T., von Schedvin, E., Townsend, R. Trade Credit and the Transmission of Unconventional Monetary Policy. Review of Financial Studies. 2023, 36(2), 775-813.
https://doi.org/10.1093/rfs/hhac040
|
| [19] |
Patatoukas, P. N. Customer Base Concentration: Implications for Firm Performance and Capital Markets. The Accounting Review. 2012, 87(2), 363-392.
https://doi.org/10.2308/accr-10198
|
| [20] |
Dhaliwal, D. S., Judd, J. S., Serfling, M., Shaikh, S. Customer Concentration Risk and the Cost of Equity Capital. Journal of Accounting and Economics. 2016, 61(1), 23-48.
https://doi.org/10.1016/j.jacceco.2015.03.005
|
| [21] |
Banerjee, S., Dasgupta, S., Kim, Y. Buyer-Supplier Relationships and the Stakeholder Theory of Capital Structure. Journal of Finance. 2008, 63(5), 2507-2552.
https://doi.org/10.1111/j.1540-6261.2008.01403.x
|
| [22] |
Shi, Y. Digital Finance and Corporate Breakthrough Innovation: Evidence from China. PLoS ONE. 2024, 19(7), e0307737.
https://doi.org/10.1371/journal.pone.0307737
|
Cite This Article
-
APA Style
Huang, S., Makulov, K. (2026). Digital Finance and Asymmetric Trade Credit Allocation in Chinese Manufacturing: Supplier Dependence and Firm Markups. Journal of Finance and Accounting, 14(5), 213-225. https://doi.org/10.11648/j.jfa.20261405.11
 Copy
|
Copy
|
 Download
ACS Style
Huang, S.; Makulov, K. Digital Finance and Asymmetric Trade Credit Allocation in Chinese Manufacturing: Supplier Dependence and Firm Markups. J. Finance Account. 2026, 14(5), 213-225. doi: 10.11648/j.jfa.20261405.11
Copy
|
Download
AMA Style
Huang S, Makulov K. Digital Finance and Asymmetric Trade Credit Allocation in Chinese Manufacturing: Supplier Dependence and Firm Markups. J Finance Account. 2026;14(5):213-225. doi: 10.11648/j.jfa.20261405.11
Copy
|
Download
-
@article{10.11648/j.jfa.20261405.11,
  author = {Shiwang Huang and Kaiyrbek Makulov},
  title = {Digital Finance and Asymmetric Trade Credit Allocation in Chinese Manufacturing: Supplier Dependence and Firm Markups},
  journal = {Journal of Finance and Accounting},
  volume = {14},
  number = {5},
  pages = {213-225},
  doi = {10.11648/j.jfa.20261405.11},
  url = {https://doi.org/10.11648/j.jfa.20261405.11},
  eprint = {https://article.sciencepublishinggroup.com/pdf/10.11648.j.jfa.20261405.11},
  abstract = {Digital finance may reshape not only firms’ access to formal financial services but also the allocation of trade credit within supply chains. This study examines whether regional digital finance is associated with asymmetric changes in payment terms and whether supplier dependence conditions the economic consequences of such changes. Using 14,159 firm-year observations for Chinese A-share manufacturing firms from 2011 to 2021, the study matches firm-level financial, trade-credit, supply-chain concentration, and markup data with the prefecture-level Peking University Digital Financial Inclusion Index. Estimates with firm and time fixed effects show that digital finance is positively associated with the payable-period indicator but is not significantly related to the receivable-period indicator, indicating an asymmetric reallocation of trade credit toward purchasing firms. Coverage breadth and usage depth, rather than the technical digitization component alone, are primarily associated with this pattern. The payable-period indicator is positively associated with three alternative markup measures, suggesting that payment-term flexibility may support operating liquidity or reflect stronger buyer bargaining power. However, the direct association between digital finance and firm markups is sensitive to markup measurement, province-by-year fixed effects, and lagged specifications. Supplier concentration and overall supply-chain concentration significantly weaken the markup association of digital finance, whereas customer concentration has no statistically significant moderating effect. Robustness checks, leave-one-province-out estimates, and permutation tests support the contemporaneous relationships, although they do not establish definitive causality. The findings identify asymmetric trade-credit allocation as an important channel through which digital finance affects manufacturing firms and show that upstream supplier dependence limits firms’ ability to retain the resulting financial and operating advantages.},
 year = {2026}
}
Copy
|
Download
-
TY  - JOUR
T1  - Digital Finance and Asymmetric Trade Credit Allocation in Chinese Manufacturing: Supplier Dependence and Firm Markups
AU  - Shiwang Huang
AU  - Kaiyrbek Makulov
Y1  - 2026/09/09
PY  - 2026
N1  - https://doi.org/10.11648/j.jfa.20261405.11
DO  - 10.11648/j.jfa.20261405.11
T2  - Journal of Finance and Accounting
JF  - Journal of Finance and Accounting
JO  - Journal of Finance and Accounting
SP  - 213
EP  - 225
PB  - Science Publishing Group
SN  - 2330-7323
UR  - https://doi.org/10.11648/j.jfa.20261405.11
AB  - Digital finance may reshape not only firms’ access to formal financial services but also the allocation of trade credit within supply chains. This study examines whether regional digital finance is associated with asymmetric changes in payment terms and whether supplier dependence conditions the economic consequences of such changes. Using 14,159 firm-year observations for Chinese A-share manufacturing firms from 2011 to 2021, the study matches firm-level financial, trade-credit, supply-chain concentration, and markup data with the prefecture-level Peking University Digital Financial Inclusion Index. Estimates with firm and time fixed effects show that digital finance is positively associated with the payable-period indicator but is not significantly related to the receivable-period indicator, indicating an asymmetric reallocation of trade credit toward purchasing firms. Coverage breadth and usage depth, rather than the technical digitization component alone, are primarily associated with this pattern. The payable-period indicator is positively associated with three alternative markup measures, suggesting that payment-term flexibility may support operating liquidity or reflect stronger buyer bargaining power. However, the direct association between digital finance and firm markups is sensitive to markup measurement, province-by-year fixed effects, and lagged specifications. Supplier concentration and overall supply-chain concentration significantly weaken the markup association of digital finance, whereas customer concentration has no statistically significant moderating effect. Robustness checks, leave-one-province-out estimates, and permutation tests support the contemporaneous relationships, although they do not establish definitive causality. The findings identify asymmetric trade-credit allocation as an important channel through which digital finance affects manufacturing firms and show that upstream supplier dependence limits firms’ ability to retain the resulting financial and operating advantages.
VL  - 14
IS  - 5
ER  -
Copy
|
Download







 Share This Article
 Twitter
 Linked In
 Facebook