1. Introduction
1.1. Background and Research Rationale
Public and development organizations increasingly face an evidence-use problem rather than an information-supply problem. Monitoring and Evaluation (M&E) systems connect programme evidence with management and policy choices. Results-based M&E supports performance management
| [1] | Kusek, J. Z., & Rist, R. C. (2004). Ten steps to a results-based monitoring and evaluation system: A handbook for development practitioners. World Bank.
https://doi.org/10.1596/0-8213-5823-5 |
[1]
and evidence-informed public policy
| [2] | Mackay, K. (2010). Conceptual framework for monitoring and evaluation. PREM Notes and Special Series on the Nuts and Bolts of Government M&E Systems, No. 1. World Bank. |
[2]
, but its value depends on credible information that reaches decisions. Building on DeLone and McLean
, Ba (2021) defines M&E System Effectiveness through System Quality, Information Quality, and Service Quality
. This architecture provides the baseline for assessing whether AI reinforces M&E rather than merely adding technology.
The African context gives this distinction particular significance because growth in administrative and programme data has not automatically strengthened evidence use in public management and policy. Institutional conditions shape whether evidence informs decisions
| [5] | Abrahams, M., Etta, F., Tarsilla, M., & Wotela, K. (2021). Evidence-based decision-making in the era of big data. African Evaluation Journal, 9(1), a602.
https://doi.org/10.4102/aej.v9i1.602 |
[5]
, while national ownership influences the legitimacy and durability of M&E systems
| [6] | Morkel, C., & Sibanda, A. (2022). Country-led monitoring and evaluation systems through the lens of participatory governance and co-production: Implications for a Made in Africa Evaluation approach. African Evaluation Journal, 10(1), a622.
https://doi.org/10.4102/aej.v10i1.622 |
[6]
. Evidence uptake also depends on sustained interaction between those who produce evidence and those who exercise managerial or policy authority
| [7] | Amisi, M. M., Awal, M. S., Pabari, M., & Bedu-Addo, D. (2021). How relationship and dialogue facilitate evidence use: Lessons from African countries. African Evaluation Journal, 9(1), a559. https://doi.org/10.4102/aej.v9i1.559 |
[7]
. Effective M&E therefore rests on more than technical performance. It requires reliable information systems embedded in institutional arrangements that connect credible evidence with decision authority and managerial choice.
AI expands computational and knowledge-processing capacity within organizations. Machine learning can identify patterns in complex datasets, while contemporary AI systems retrieve and synthesize information at scale
| [8] | Jordan, M. I., & Mitchell, T. M. (2015). Machine learning: Trends, perspectives, and prospects. Science, 349(6245), 255-260. https://doi.org/10.1126/science.aaa8415 |
| [9] | Russell, S., & Norvig, P. (2021). Artificial intelligence: A modern approach (4th ed.). Pearson. |
[8, 9]
. These capabilities can redistribute expertise
and alter decision structures
| [11] | Shrestha, Y. R., Ben-Menahem, S. M., & von Krogh, G. (2019). Organizational decision-making structures in the age of artificial intelligence. California Management Review, 61(4), 66-83. https://doi.org/10.1177/0008125619862257 |
[11]
, with implications for managerial judgment
. Yet automation remains interdependent with human expertise
| [13] | Raisch, S., & Krakowski, S. (2021). Artificial intelligence and management: The automation-augmentation paradox. Academy of Management Review, 46(1), 192-210.
https://doi.org/10.5465/amr.2018.0072 |
[13]
, and productivity effects vary across tasks and organizational settings
. For M&E, the central issue is whether AI strengthens evidence production and validation while improving how evidence informs management and policy decisions.
Organizational research suggests that technology access alone is insufficient. AI creates value through complementary capabilities
| [15] | Mikalef, P., & Gupta, M. (2021). Artificial intelligence capability: Conceptualization, measurement calibration, and empirical study on its impact on organizational creativity and firm performance. Information & Management, 58(3), 103434.
https://doi.org/10.1016/j.im.2021.103434 |
[15]
, while readiness shapes the transition from experimentation to effective use
| [16] | Jöhnk, J., Weißert, M., & Wyrtki, K. (2021). Ready or not, AI comes - An interview study of organizational AI readiness factors. Business & Information Systems Engineering, 63(1), 5-20. https://doi.org/10.1007/s12599-020-00676-7 |
[16]
. Public-sector studies likewise locate performance and public value in organizational processes and institutional capability
| [17] | Mikalef, P., Lemmer, K., Schaefer, C., Ylinen, M., Fjørtoft, S. O., Torvatn, H. Y., Gupta, M., & Niehaves, B. (2023). Examining how AI capabilities can foster organizational performance in public organizations. Government Information Quarterly, 40(2), 101797. https://doi.org/10.1016/j.giq.2022.101797 |
| [18] | van Noordt, C., & Tangi, L. (2023). The dynamics of AI capability and its influence on public value creation of AI within public administration. Government Information Quarterly, 40(4), 101860.
https://doi.org/10.1016/j.giq.2023.101860 |
[17, 18]
. OECD emphasizes governance and organizational capacity
, and the World Development Report 2026 highlights complementary infrastructure, data, skills, and institutions in developing economies
. M&E maturity may therefore influence both AI adoption and its returns.
AI integration also raises important concerns about evidence integrity. NIST identifies validity, reliability, transparency, and accountability as core requirements for trustworthy AI
| [21] | National Institute of Standards and Technology. (2023). Artificial intelligence risk management framework (AI RMF 1.0) (NIST AI 100-1). U.S. Department of Commerce.
https://doi.org/10.6028/NIST.AI.100-1 |
[21]
, while generative systems may produce plausible outputs without adequate factual support
| [22] | Ji, Z., Lee, N., Frieske, R., Yu, T., Su, D., Xu, Y., Ishii, E., Bang, Y. J., Chen, D., Dai, W., Chan, H. S., Madotto, A., & Fung, P. (2023). Survey of hallucination in natural language generation. ACM Computing Surveys, 55(12), Article 248, 1-38.
https://doi.org/10.1145/3571730 |
[22]
. These risks become consequential when AI-assisted evidence informs programme reviews, management decisions, or public policy. A key research gap persists between two largely separate bodies of literature on organizational AI capability and M&E system effectiveness. This research examines whether deeper AI use is associated with stronger M&E performance after adjustment for system maturity and whether stronger M&E performance corresponds with greater Organizational Evidence Capability and Net Benefits.
1.2. Research Objective and Contribution
The research examines AI as a potential reinforcement capability within African M&E systems. It focuses on AI-use intensity rather than binary adoption because occasional access to an AI tool does not establish organizational integration. The objective is to determine whether deeper use across routine M&E functions is associated with stronger M&E system performance and whether that performance is associated with organizational evidence capability and broader system benefits.
The research addresses three questions:
1) How do M&E practitioners use AI across core functions, and to what extent has this use progressed from exploration to operational integration?
2) To what extent is AI-use intensity associated with System Quality, Information Quality, and Service Quality within M&E systems?
3) To what extent is stronger M&E System Effectiveness associated with greater Organizational Evidence Capability and higher M&E System Net Benefits?
The theoretical contribution lies in connecting organizational AI capability with an established model of M&E system effectiveness. Research on AI emphasizes organizational capability and readiness for effective use, whereas M&E scholarship focuses on the quality of evidence systems and their contribution to decision-making. The research therefore situates AI within the institutional processes through which M&E generates organizational value rather than treating technology adoption as an outcome in itself.
This framing also distinguishes AI adoption from operational integration. Episodic use may improve a discrete task without altering the wider evidence system, whereas recurrent use across M&E functions can reshape workflows and strengthen the link between evidence production and managerial decision-making. AI-use intensity therefore offers a more informative measure than a simple distinction between adopters and non-adopters and remains consistent with organizational capability and readiness research
| [15] | Mikalef, P., & Gupta, M. (2021). Artificial intelligence capability: Conceptualization, measurement calibration, and empirical study on its impact on organizational creativity and firm performance. Information & Management, 58(3), 103434.
https://doi.org/10.1016/j.im.2021.103434 |
| [16] | Jöhnk, J., Weißert, M., & Wyrtki, K. (2021). Ready or not, AI comes - An interview study of organizational AI readiness factors. Business & Information Systems Engineering, 63(1), 5-20. https://doi.org/10.1007/s12599-020-00676-7 |
[15, 16]
.
The African focus extends this argument to an institutional setting that remains underrepresented in research on organizational AI. African evaluation scholarship emphasizes national ownership and the institutional conditions through which evidence acquires legitimacy and enters public decision processes
| [6] | Morkel, C., & Sibanda, A. (2022). Country-led monitoring and evaluation systems through the lens of participatory governance and co-production: Implications for a Made in Africa Evaluation approach. African Evaluation Journal, 10(1), a622.
https://doi.org/10.4102/aej.v10i1.622 |
| [7] | Amisi, M. M., Awal, M. S., Pabari, M., & Bedu-Addo, D. (2021). How relationship and dialogue facilitate evidence use: Lessons from African countries. African Evaluation Journal, 9(1), a559. https://doi.org/10.4102/aej.v9i1.559 |
| [23] | Ba, A. (2026). Institutionalizing Evaluation as a Governance Capability: Evidence from Agriculture and Economic Policy in Africa. Journal of Public Policy and Administration, 10(1), 1-17. https://doi.org/10.11648/j.jppa.20261001.11 |
[6, 7, 23]
. The central issue therefore extends beyond access to AI and concerns its integration into locally embedded evidence systems, consistent with public-sector AI governance perspectives
and with the emphasis on complementary institutional capabilities in developing economies
.
The research does not claim causal identification because cross-sectional associations cannot establish whether AI integration precedes stronger M&E performance. Organizations with more mature evidence systems may also possess greater capacity to adopt and institutionalize AI. The empirical analysis therefore tests whether observed relationships are consistent with the proposed reinforcement mechanism while accounting for M&E system maturity.
1.3. Research Framework and Hypotheses
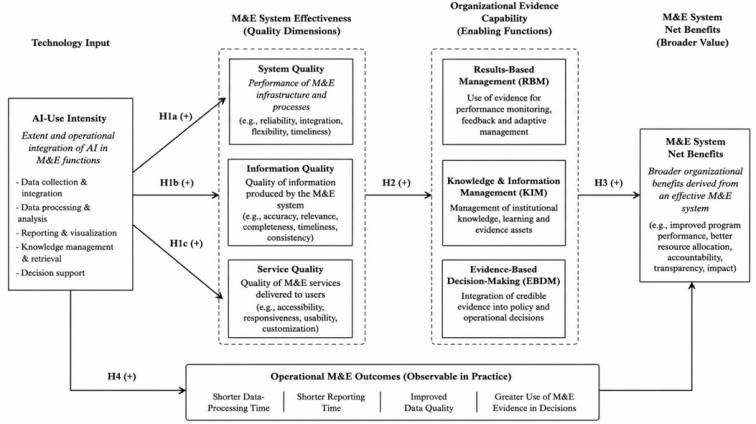
The framework builds on Ba’s (2021) M&E System Effectiveness model
, which adapts the DeLone and McLean information-systems success architecture
. System Quality, Information Quality, and Service Quality represent core dimensions of M&E performance, while Results-Based Management (RBM), Knowledge and Information Management (KIM), and Evidence-Based Decision-Making (EBDM) capture organizational functions through which evidence supports management and policy decisions. Net Benefits represent the broader organizational value associated with effective M&E. Petter et al. provide additional empirical support for the relationships that connect system quality with use and subsequent organizational benefits
| [24] | Petter, S., DeLone, W., & McLean, E. (2008). Measuring information systems success: Models, dimensions, measures, and interrelationships. European Journal of Information Systems, 17(3), 236-263. https://doi.org/10.1057/ejis.2008.15 |
[24]
.
Figure 1 positions AI-use intensity as a reinforcement layer rather than a fourth effectiveness dimension. AI matters when integration improves functions already embedded in the evidence system. Recent reassessment of the DeLone and McLean model likewise finds its core dimensions relevant under emerging technologies, while trust and information quality require renewed attention
| [25] | Saba, P., DeLone, W., Ul-Ain, N., Harfouche, A., Ben Nasr, I., Biot-Paquerot, G., & Mallek, S. (2025). The DeLone and McLean information systems success model: What is the future evolution for its foundations, components, and applications? Communications of the Association for Information Systems, 57, 878-898. https://doi.org/10.17705/1CAIS.05738 |
[25]
.
The mechanism is complementarity because technology creates organizational value through supporting processes and capabilities
| [26] | Melville, N., Kraemer, K., & Gurbaxani, V. (2004). Review: Information technology and organizational performance: An integrative model of IT business value. MIS Quarterly, 28(2), 283-322. https://doi.org/10.2307/25148636 |
[26]
. Mikalef and Gupta extend this logic to AI
| [15] | Mikalef, P., & Gupta, M. (2021). Artificial intelligence capability: Conceptualization, measurement calibration, and empirical study on its impact on organizational creativity and firm performance. Information & Management, 58(3), 103434.
https://doi.org/10.1016/j.im.2021.103434 |
[15]
, Jöhnk et al. identify readiness conditions
| [16] | Jöhnk, J., Weißert, M., & Wyrtki, K. (2021). Ready or not, AI comes - An interview study of organizational AI readiness factors. Business & Information Systems Engineering, 63(1), 5-20. https://doi.org/10.1007/s12599-020-00676-7 |
[16]
, and public-sector studies link AI performance and public value to institutional capability
| [17] | Mikalef, P., Lemmer, K., Schaefer, C., Ylinen, M., Fjørtoft, S. O., Torvatn, H. Y., Gupta, M., & Niehaves, B. (2023). Examining how AI capabilities can foster organizational performance in public organizations. Government Information Quarterly, 40(2), 101797. https://doi.org/10.1016/j.giq.2022.101797 |
| [18] | van Noordt, C., & Tangi, L. (2023). The dynamics of AI capability and its influence on public value creation of AI within public administration. Government Information Quarterly, 40(4), 101860.
https://doi.org/10.1016/j.giq.2023.101860 |
[17, 18]
. The framework therefore expects depth of integration to matter more than access.
Figure 1. Research Framework.
AI can reinforce each M&E quality dimension through distinct mechanisms. Automation and data integration can strengthen System Quality by improving workflow efficiency and system functionality. AI-assisted validation, anomaly detection, and predictive analysis can enhance Information Quality, including analysis of unstructured evidence. Generative and natural-language interfaces may improve synthesis and access to information when appropriate methodological controls remain in place. These mechanisms accord with DeLone and McLean
, Petter et al.
| [24] | Petter, S., DeLone, W., & McLean, E. (2008). Measuring information systems success: Models, dimensions, measures, and interrelationships. European Journal of Information Systems, 17(3), 236-263. https://doi.org/10.1057/ejis.2008.15 |
[24]
, and Ba’s application of the framework to M&E effectiveness
.
The framework then links M&E effectiveness to Organizational Evidence Capability. Stronger systems matter when evidence enters performance management, learning, and decisions. Ba links M&E effectiveness to RBM, KIM, and EBDM
, while Amisi et al. show that evidence use depends on institutional relationships
| [7] | Amisi, M. M., Awal, M. S., Pabari, M., & Bedu-Addo, D. (2021). How relationship and dialogue facilitate evidence use: Lessons from African countries. African Evaluation Journal, 9(1), a559. https://doi.org/10.4102/aej.v9i1.559 |
[7]
. This distinction prevents task efficiency from being equated with system effectiveness and extends the complementarity argument from technical processes to organizational use
| [17] | Mikalef, P., Lemmer, K., Schaefer, C., Ylinen, M., Fjørtoft, S. O., Torvatn, H. Y., Gupta, M., & Niehaves, B. (2023). Examining how AI capabilities can foster organizational performance in public organizations. Government Information Quarterly, 40(2), 101797. https://doi.org/10.1016/j.giq.2022.101797 |
| [26] | Melville, N., Kraemer, K., & Gurbaxani, V. (2004). Review: Information technology and organizational performance: An integrative model of IT business value. MIS Quarterly, 28(2), 283-322. https://doi.org/10.2307/25148636 |
[17, 26]
.
Operational outcomes offer an additional empirical test of this proposition. If deeper AI use strengthens M&E practice, it should improve reporting efficiency and data quality while supporting greater evidence use in decisions. Faster processing may emerge as another benefit. Experimental and workplace studies identify performance gains from generative AI, although effects vary across tasks and organizational contexts
| [14] | Brynjolfsson, E., Li, D., & Raymond, L. (2025). Generative AI at work. The Quarterly Journal of Economics, 140(2), 889-942.
https://doi.org/10.1093/qje/qjae044 |
| [27] | Noy, S., & Zhang, W. (2023). Experimental evidence on the productivity effects of generative artificial intelligence. Science, 381(6654), 187-192. https://doi.org/10.1126/science.adh2586 |
[14, 27]
. Automation-augmentation research likewise emphasizes continued reliance on professional judgment to convert AI capability into measurable performance gains
| [13] | Raisch, S., & Krakowski, S. (2021). Artificial intelligence and management: The automation-augmentation paradox. Academy of Management Review, 46(1), 192-210.
https://doi.org/10.5465/amr.2018.0072 |
[13]
.
Net Benefits capture downstream organizational outcomes and represent the ultimate expression of information-system success
| [3] | DeLone, W. H., & McLean, E. R. (2003). The DeLone and McLean model of information systems success: A ten-year update. Journal of Management Information Systems, 19(4), 9-30. https://doi.org/10.1080/07421222.2003.11045748 |
| [24] | Petter, S., DeLone, W., & McLean, E. (2008). Measuring information systems success: Models, dimensions, measures, and interrelationships. European Journal of Information Systems, 17(3), 236-263. https://doi.org/10.1057/ejis.2008.15 |
[3, 24]
. Within the M&E framework, they encompass improvements in programme and policy management associated with stronger evidence systems and more effective organizational decision-making
.
The framework specifies associations, not causal effects. Stronger organizations may possess both mature M&E systems and greater technological capacity
| [14] | Brynjolfsson, E., Li, D., & Raymond, L. (2025). Generative AI at work. The Quarterly Journal of Economics, 140(2), 889-942.
https://doi.org/10.1093/qje/qjae044 |
| [26] | Melville, N., Kraemer, K., & Gurbaxani, V. (2004). Review: Information technology and organizational performance: An integrative model of IT business value. MIS Quarterly, 28(2), 283-322. https://doi.org/10.2307/25148636 |
[14, 26]
. M&E system maturity is therefore controlled, and robustness tests examine whether the principal associations persist across specifications.
On this basis, the research tests the following hypotheses:
1) H1a. Higher AI-use intensity is positively associated with M&E System Quality.
2) H1b. Higher AI-use intensity is positively associated with M&E Information Quality.
3) H1c. Higher AI-use intensity is positively associated with M&E Service Quality.
4) H2. Higher M&E System Effectiveness is positively associated with stronger Organizational Evidence Capability, reflected in RBM, KIM, and EBDM.
5) H3. Higher M&E System Effectiveness is positively associated with greater M&E System Net Benefits.
6) H4. Higher AI-use intensity is positively associated with favorable operational M&E outcomes, reflected in shorter processing and reporting times, improved data quality, and greater use of M&E evidence in decision-making.
Together, the hypotheses test a reinforcement pathway in which deeper AI-use intensity corresponds with stronger M&E system effectiveness, which in turn is associated with greater Organizational Evidence Capability and Net Benefits. The framework connects information-systems success theory, development-management effectiveness, and organizational AI capability without conflating their respective explanatory roles. Ba (2021) provides the conceptual bridge through an evidence-to-decision architecture
, while AI-capability theory explains why technological access alone is insufficient to generate organizational value.
2. Materials and Methods
2.1. Research Design, Population, and Data Collection
This research uses a cross-sectional analytical survey to examine associations between AI-use intensity and M&E system effectiveness among practitioners working in Africa. Each respondent assessed a specific M&E system, programme, project, or professional assignment, which served as the unit of analysis and anchored responses in a concrete professional context rather than in abstract perceptions of AI or M&E. Because the design captures observations at a single point in time, it supports theory-driven tests of association but cannot establish temporal precedence or causal effects
.
The study targeted professionals directly involved in M&E, including organizational specialists, programme managers, evaluators, researchers, consultants, and practitioners working at the interface between information systems and evidence use. Purposive non-probability sampling introduced variation in institutional context and AI-use intensity by including both non-users and practitioners with operational AI experience. This design serves an explanatory purpose and does not claim statistical representativeness for the broader population of African M&E professionals, in line with AAPOR guidance on inference from non-probability samples
| [29] | American Association for Public Opinion Research. (2013). Report of the AAPOR task force on non-probability sampling. AAPOR. |
[29]
.
Table 1. Research design and data-collection profile.
Design element | Specification |
Research design | Cross-sectional analytical survey |
Unit of analysis | M&E system, programme, project, or professional assignment referenced by respondent |
Target population | Professionals with direct involvement in M&E practice in Africa |
Sample size | 75 observations |
Sampling approach | Purposive non-probability sampling |
Data collection | Self-administered bilingual web questionnaire |
Languages | English and French |
Data structure | Structured survey measures plus recoded open-ended responses |
Field period | June-July 2026 |
Data collection took place from June to July 2026 through a self-administered web questionnaire available in English and French (
Table 1). The instrument captured respondents’ professional profiles, M&E system maturity, AI-use intensity, specific tools and applications, and constructs defined in the research framework. Five-point ordinal scales measured most perceived changes, while categorical and multiple-response items captured professional characteristics and patterns of AI use
| [30] | Dillman, D. A., Smyth, J. D., & Christian, L. M. (2014). Internet, phone, mail, and mixed-mode surveys: The tailored design method (4th ed.). Wiley. |
[30]
.
Open-ended responses complemented structured measures and provided additional insight into how practitioners described AI use in M&E practice. A structured data-mining process examined each response, assigned codes based on substantive meaning, and consolidated equivalent responses into harmonized categories before their inclusion in the analytical dataset. This procedure preserved close correspondence with respondents’ original accounts while enabling systematic comparison, consistent with established approaches to qualitative content analysis
| [31] | Hsieh, H.-F., & Shannon, S. E. (2005). Three approaches to qualitative content analysis. Qualitative Health Research, 15(9), 1277-1288. https://doi.org/10.1177/1049732305276687 |
| [32] | Krippendorff, K. (2018). Content analysis: An introduction to its methodology (4th ed.). SAGE. |
[31, 32]
.
Final analysis covered 75 observations. Structured variables provided the main basis for hypothesis testing, while recoded open-ended responses supported interpretation of AI-use patterns. Statistical inference remains limited to associations observed within the sample, since causal claims would require designs that establish temporal order and address competing explanations more directly
.
2.2. Variables, Constructs, and Measurement
The measurement model distinguishes the intensity of AI use from the maturity of the M&E system within which that use occurs. AI-use intensity serves as the focal explanatory construct, whereas M&E system maturity captures the prior level of institutional development of the system assessed by each respondent. This distinction reduces the risk of attributing to AI differences that may instead reflect the strength of the pre-existing M&E architecture. The outcome structure follows Ba’s adaptation of the DeLone and McLean information-systems success model
. It differentiates M&E System Effectiveness from Organizational Evidence Capability and Net Benefits, in accordance with the multidimensional conception of information-system performance established in the literature
| [24] | Petter, S., DeLone, W., & McLean, E. (2008). Measuring information systems success: Models, dimensions, measures, and interrelationships. European Journal of Information Systems, 17(3), 236-263. https://doi.org/10.1057/ejis.2008.15 |
[24]
.
The study measures AI-use intensity on a six-level ordinal scale that ranges from 0 = no use to 5 = organization-wide integration. Intermediate levels distinguish exploration, pilot testing, limited operational use, and regular use across multiple M&E functions. Separate multiple-response measures capture the portfolio of AI tools and the functional scope of their application across data collection, data processing, analysis, reporting, and evidence use. This measurement structure separates the depth of AI integration from the technologies adopted or functions supported. It therefore provides a more precise representation of organizational AI use and remains consistent with research on AI capability and organizational readiness
| [15] | Mikalef, P., & Gupta, M. (2021). Artificial intelligence capability: Conceptualization, measurement calibration, and empirical study on its impact on organizational creativity and firm performance. Information & Management, 58(3), 103434.
https://doi.org/10.1016/j.im.2021.103434 |
| [16] | Jöhnk, J., Weißert, M., & Wyrtki, K. (2021). Ready or not, AI comes - An interview study of organizational AI readiness factors. Business & Information Systems Engineering, 63(1), 5-20. https://doi.org/10.1007/s12599-020-00676-7 |
[15, 16]
.
M&E system maturity is measured independently on a five-level ordinal scale ranging from no formal M&E system to full institutionalization with continuous improvement. This measure captures organizational context and helps separate AI integration from pre-existing system development. Remaining constructs rely on multi-item scales summarized in
Table 2. Most outcome items use a five-point response scale ranging from 1 = no observable effect to 5 = transformational improvement. Higher scores therefore reflect stronger improvements that respondents attribute to AI use rather than absolute assessments of underlying M&E system performance.
Table 2. Variables, categories and measurements.
Variable / construct | Items or categories included | Measurement | Reliability |
M&E system maturity | No formal M&E system; basic system applied inconsistently; documented and regularly used system; system integrated into management processes; institutionalized and continuously improved system | 5-level ordinal scale, 1-5 | Single item |
AI-use intensity | No use; exploration only; pilot testing; limited operational use; regular use in multiple functions; organization-wide integration | 6-level ordinal scale, 0-5 | Single item |
AI tools used | Machine learning; NLP; generative AI; computer vision; geospatial AI; decision-support tools. Specific options included Random Forest, regression and classification models, ChatGPT, Claude, Gemini, Copilot, Perplexity, OCR, Google Earth Engine, ArcGIS AI, Power BI Copilot, Tableau AI, AI dashboards, and recommendation systems | Multiple-response binary indicators | — |
AI functional scope | Data collection; data processing; data analysis; reporting; evidence use | Multiple-response indicators | — |
System Quality (SQ) | M&E system design; indicator architecture; theory-of-change design; monitoring efficiency; reduction of manual work; interoperability; staff productivity; compensation for technical capacity gaps | 8 items, 1-5 | α =.933 |
Information Quality (IQ) | Data completeness; data accuracy; data consistency; report reliability; reporting timeliness; outcome measurement; attribution analysis; risk identification; early-warning capacity | 9 items, 1-5 | α =.979 |
Service Quality (SVQ) | Information availability; information accessibility; response time to information requests; adaptation to emerging information needs; long-term usability of M&E services | 5 items, 1-5 | α =.968 |
M&E System Effectiveness (MESE) | Composite of SQ, IQ, and SVQ | Mean of dimension scores | — |
Results-Based Management (RBM) | Results tracking; performance management; accountability | 3 items, 1-5 | α =.896 |
Knowledge and Information Management (KIM) | Knowledge capture; knowledge sharing; institutional learning | 3 items, 1-5 | α =.970 |
Evidence-Based Decision-Making (EBDM) | Evidence use; decision quality; decision time; confidence in decisions | 4 items, 1-5 | α =.959 |
Organizational Evidence Capability (OEC) | Composite of RBM, KIM, and EBDM | Mean of dimension scores | |
System Quality, Information Quality, and Service Quality form the M&E System Effectiveness construct. Organizational Evidence Capability combines RBM, KIM, and EBDM. Net Benefits capture broader organizational value. Four operational indicators measure reported changes in processing time, reporting time, data quality, and evidence use. Internal consistency was assessed with Cronbach's alpha
. Coefficients ranged from .896 to .979, which indicates strong internal coherence. Because very high alpha values can also reflect item redundancy and do not establish construct validity, interpretation remained anchored in the theory-defined measurement structure rather than sample-specific scale optimization
.
2.3. Data Management and Analysis
Responses in English and French followed a common variable structure for analysis. Coding retained the direction and ordinal properties of original response scales. The analysis converted multiple-response items into binary indicators and consolidated coded open-ended responses into substantively equivalent categories. Four AI-use stages emerged in the sample, ranging from no use and exploration to limited operational use and regular use across multiple functions. The analysis treated these stages as ordered categories, while M&E system maturity captured institutional context as a categorical variable.
The statistical analysis adopted an ordinal-first strategy, as summarized in
Table 3. Descriptive statistics reported medians, interquartile ranges, and response distributions for Likert-type constructs. Rank-based and distribution-free statistics assessed unadjusted relationships, whereas ordinal-response models provided the principal multivariable estimates. This strategy preserves the ordered nature of the response categories without imposing an assumption of equal intervals between adjacent scale points
| [35] | Agresti, A. (2010). Analysis of ordinal categorical data (2nd ed.). Wiley. |
| [36] | McCullagh, P. (1980). Regression models for ordinal data. Journal of the Royal Statistical Society: Series B (Methodological), 42(2), 109-142. |
[35, 36]
.
Table 3. Statistical analysis strategy.
Analysis / hypothesis | Outcome | Main explanatory variable | Primary estimator | Adjustment | Effect measure | Complementary analysis | Robustness check |
Descriptive analysis | AI use, M&E maturity, study constructs | | Frequencies; median [IQR] | | n,%, median, IQR | Response distributions | |
H1a | System Quality | AI-use stage | Ordinal GEE, cumulative logit | M&E maturity; item effects | OR [95% CI] | Kruskal-Wallis; ε2; Kendall’s τb | Categorical AI use |
H1b | Information Quality | AI-use stage | Ordinal GEE, cumulative logit | M&E maturity; item effects | OR [95% CI] | Kruskal-Wallis; ε2; Kendall’s τb | Categorical AI use |
H1c | Service Quality | AI-use stage | Ordinal GEE, cumulative logit | M&E maturity; item effects | OR [95% CI] | Kruskal-Wallis; ε2; Kendall’s τb | Categorical AI use |
H2 | RBM, KIM, EBDM and OEC | M&E System Effectiveness | Ordinal cumulative-logit model | M&E maturity; item effects | OR [95% CI] | Kendall’s τb; partial Spearman ρ | Additional covariates; alternative link |
H3 | M&E System Net Benefits | M&E System Effectiveness | Ordinal cumulative-logit model | M&E maturity; item effects | OR [95% CI] | Kendall’s τb; partial Spearman ρ | Additional covariates; alternative link |
H4 | Processing time, reporting time, data quality, evidence use | AI-use stage | Ordered logit | M&E maturity | OR [95% CI] | Kendall’s τb | Categorical AI use; ordered probit |
Note. IQR = interquartile range; ε2 = epsilon-squared; OR = cumulative odds ratio; CI = confidence interval; GEE = generalized estimating equations; RBM = results-based management; KIM = knowledge and information management; EBDM = evidence-based decision-making; OEC = organizational evidence capability
For H1a-H1c, cumulative-logit generalized estimating equation (GEE) models retained item-level responses and accounted for within-respondent dependence. This permits population-averaged estimation for correlated ordinal observations
. Robust covariance estimation, with a finite-sample correction where appropriate, supported inference
. Kruskal-Wallis tests and Kendall's τb provided complementary evidence on distributional differences and ordered association
.
For H2 and H3, M&E System Effectiveness entered cumulative-logit models through respondents' ranked positions rather than an interval-scale assumption. Models estimated associations with Organizational Evidence Capability and Net Benefits after adjustment for M&E system maturity. H4 used proportional-odds models for ordered categories of reported change in processing time, reporting time, data quality, and evidence use. These operational indicators are practitioner-reported performance changes, not independently observed productivity measures.
Robustness checks used categorical representations of AI-use stage, ordered-probit links, selected additional covariates, and sensitivity checks for the proportional-odds structure. Models remained parsimonious because of the sample size. Interpretation emphasized effect magnitude, 95% confidence intervals, and consistency across specifications rather than p-values alone. All tests were two-sided at the 5% level, and the cross-sectional design limits conclusions to conditional associations
.
3. Results
3.1. Sample Characteristics and Profile of AI Use
Sample composition includes 75 M&E practitioners from 19 African countries. West Africa represents 74.7% of respondents, while Central and East Africa account for 13.3% and 12.0%, respectively. Professional experience is substantial, with 44.0% reporting 5–10 years in M&E and 49.3% reporting more than 10 years. M&E specialists represent 37.3% of respondents, compared with 24.0% for independent consultants. Agriculture and rural development jointly account for 49.3%. Institutional maturity is comparatively high, as 68.0% assess their referenced M&E system as integrated into management processes or institutionalized with continuous improvement (
Table 4).
Table 4. Sample characteristics and M&E system context (N = 75).
Characteristic | Category | n | % |
Region | West Africa | 56 | 74.7 |
Central Africa | 10 | 13.3 |
East Africa | 9 | 12.0 |
Professional status | M&E specialist within an organization | 28 | 37.3 |
Independent consultant | 18 | 24.0 |
Programme/project manager | 14 | 18.7 |
Independent evaluator | 10 | 13.3 |
Researcher/academic | 5 | 6.7 |
M&E experience | Less than 5 years | 5 | 6.7 |
5-10 years | 33 | 44.0 |
11-15 years | 18 | 24.0 |
16-20 years | 5 | 6.7 |
More than 20 years | 14 | 18.7 |
Main sector | Agriculture | 24 | 32.0 |
Rural development | 13 | 17.3 |
Humanitarian assistance | 9 | 12.0 |
Multi-sector | 9 | 12.0 |
Education | 5 | 6.7 |
Environment and climate | 5 | 6.7 |
Social protection | 5 | 6.7 |
Other | 5 | 6.7 |
M&E system maturity | No formal M&E system | 10 | 13.3 |
System documented and regularly used | 14 | 18.7 |
Integrated into management processes | 24 | 32.0 |
Institutionalized and continuously improved | 27 | 36.0 |
AI use shows substantial variation across respondents. Nineteen participants (25.3%) report no current use, while 14 (18.7%) remain at exploration stage. Another 23 respondents (30.7%) report limited operational use, and 19 (25.3%) use AI regularly across multiple M&E functions. No respondent reports pilot testing or organization-wide integration. Overall, 56.0% have moved beyond exploration to operational use, although integration remains less developed in data collection. Only 25.3% report AI use across several collection functions or routine integration into data-collection processes.
The technology profile is concentrated around accessible generative and decision-support tools. Sixty-five respondents (86.7%) report at least one generative-AI platform and 28 (37.3%) at least one AI-enabled decision-support tool. ChatGPT is the most frequently reported platform (74.7%), followed by Gemini (44.0%); Claude and Power BI Copilot each reach 30.7%, and Microsoft Copilot 29.3% (
Table 5). The absence of positive selections for named stand-alone machine-learning, NLP, computer-vision, and geospatial-AI tools should not be read as absence of those analytical techniques, because respondents also report predictive and text-analytic applications. Rather, practitioners appear to recognize AI primarily through generative platforms and integrated interfaces.
Table 5. AI tools reported by respondents.
AI tool or platform | n | % |
ChatGPT | 56 | 74.7 |
Gemini | 33 | 44.0 |
Claude | 23 | 30.7 |
Power BI Copilot | 23 | 30.7 |
Microsoft Copilot | 22 | 29.3 |
Perplexity | 10 | 13.3 |
AI recommendation systems | 9 | 12.0 |
Tableau AI | 4 | 5.3 |
AI dashboards | 4 | 5.3 |
AI applications extend across the M&E workflow. Evidence-use applications have the widest reach (76.0%); each other major functional domain reaches 69.3%. Data cleaning is the most common processing application (62.7%), followed by AI-generated summaries (57.3%) and survey validation (56.0%). Strategic planning (46.7%) and AI-supported recommendations (45.3%) are also prominent, whereas risk scoring and advanced geospatial or scenario applications remain less common (
Table 6). The pattern indicates operational diffusion, but its center of gravity remains workflow support, synthesis, and decision-oriented use rather than advanced stand-alone AI deployment.
Table 6. AI-use Applications.
M&E function | Respondents with at least one application, n (%) | Most frequently reported applications |
Data collection | 52 (69.3) | Survey validation: 42 (56.0%); voice-to-text: 19 (25.3%) |
Data processing | 52 (69.3) | Data cleaning: 47 (62.7%); quality checks: 33 (44.0%) |
Data analysis | 52 (69.3) | Predictive analytics: 28 (37.3%); text analytics: 22 (29.3%) |
Reporting | 52 (69.3) | AI-generated summaries: 43 (57.3%); dashboard generation: 24 (32.0%) |
Evidence use | 57 (76.0) | Strategic planning: 35 (46.7%); recommendations: 34 (45.3%); decision support: 28 (37.3%) |
3.2. M&E Effectiveness and Relationships With AI Use
H1a-H1c test whether higher AI-use intensity is associated with stronger System Quality, Information Quality, and Service Quality.
1) H1a: Higher AI-use intensity is positively associated with M&E System Quality (SQ).
2) H1b: Higher AI-use intensity is positively associated with M&E Information Quality (IQ).
3) H1c: Higher AI-use intensity is positively associated with M&E Service Quality (SVQ).
The ordinal distributions show a consistent upward shift across AI-use stages. Median System Quality rises from 2.0 [IQR 1.50-2.75] among non-users to 4.0 [4.00-4.50] among regular multi-function users. Information Quality rises from 2.0 [1.50-3.50] to 4.0 [4.00-4.50], and Service Quality from 2.0 [1.50-4.50] to 4.0 [3.50-5.00]. The strongest separation is therefore observed for System Quality, although all three dimensions of the Ba (2021) framework move in the expected direction
.
Among regular multi-function users, 94.1% of System Quality item responses fall in the significant or transformational improvement categories, compared with 27.0% among non-users. The corresponding contrasts are 71.9% versus 29.8% for Information Quality and 80.0% versus 38.9% for Service Quality. These differences occur within the operational attributes of M&E effectiveness rather than in a single global rating, consistent with the distinction among system, information, and service quality in information-systems research
| [3] | DeLone, W. H., & McLean, E. R. (2003). The DeLone and McLean model of information systems success: A ten-year update. Journal of Management Information Systems, 19(4), 9-30. https://doi.org/10.1080/07421222.2003.11045748 |
| [24] | Petter, S., DeLone, W., & McLean, E. (2008). Measuring information systems success: Models, dimensions, measures, and interrelationships. European Journal of Information Systems, 17(3), 236-263. https://doi.org/10.1057/ejis.2008.15 |
[3, 24]
.
Table 7. Association between AI-use intensity and M&E effectiveness.
Hypothesis / M&E dimension | Median by AI-use stage* | Kruskal-Wallis H | ε2 | Kendall’s τb | Adjusted OR [95% CI] | p-value | Conclusion |
H1a - System Quality | 2.0 → 3.0 → 3.0 → 4.0 | 42.26*** | .553 | .596*** | 2.75 [2.00-3.78] | <.001 | Supported |
H1b - Information Quality | 2.0 → 3.0 → 4.0 → 4.0 | 26.98*** | .338 | .498*** | 1.94 [1.34-2.82] | <.001 | Supported |
H1c - Service Quality | 2.0 → 3.0 → 3.0 → 4.0 | 12.73** | .137 | .258** | 1.60 [1.01-2.55] | .045 | Supported, weaker association |
H1a receives the strongest support. System Quality shows the largest between-stage difference (H = 42.26, p <.001; ε
2 =.553) and the strongest rank association (τb =.596, p <.001). After adjustment for M&E system maturity, each progression in AI-use stage is associated with 2.75 times higher cumulative odds of a stronger System Quality response (95% CI [2.00, 3.78], p <.001). This pattern is consistent with the proposition that AI creates value when it becomes embedded in organizational processes
| [15] | Mikalef, P., & Gupta, M. (2021). Artificial intelligence capability: Conceptualization, measurement calibration, and empirical study on its impact on organizational creativity and firm performance. Information & Management, 58(3), 103434.
https://doi.org/10.1016/j.im.2021.103434 |
| [26] | Melville, N., Kraemer, K., & Gurbaxani, V. (2004). Review: Information technology and organizational performance: An integrative model of IT business value. MIS Quarterly, 28(2), 283-322. https://doi.org/10.2307/25148636 |
[15, 26]
and with System Quality as a foundation of M&E effectiveness
.
H1b is also strongly supported. Information Quality differs across AI-use groups (H = 26.98, p <.001; ε
2 =.338), with a positive rank association (τb =.498, p <.001). The adjusted cumulative OR is 1.94 (95% CI [1.34, 2.82], p <.001). The result is consistent with AI's potential to strengthen information processing when complementary organizational capabilities are present
| [15] | Mikalef, P., & Gupta, M. (2021). Artificial intelligence capability: Conceptualization, measurement calibration, and empirical study on its impact on organizational creativity and firm performance. Information & Management, 58(3), 103434.
https://doi.org/10.1016/j.im.2021.103434 |
[15]
and with the information-quality pathway in the DeLone and McLean model
as applied to M&E
.
H1c is supported, but the relationship is weaker. Service Quality differs across AI-use groups (H = 12.73, p =.005; ε
2 =.137), and Kendall's τb is .258 (p =.008). The adjusted cumulative OR is 1.60 (95% CI [1.01, 2.55], p =.045). The smaller effect suggests that responsive and useful M&E services depend on organizational and human capabilities that technology does not supply by itself
| [16] | Jöhnk, J., Weißert, M., & Wyrtki, K. (2021). Ready or not, AI comes - An interview study of organizational AI readiness factors. Business & Information Systems Engineering, 63(1), 5-20. https://doi.org/10.1007/s12599-020-00676-7 |
| [18] | van Noordt, C., & Tangi, L. (2023). The dynamics of AI capability and its influence on public value creation of AI within public administration. Government Information Quarterly, 40(4), 101860.
https://doi.org/10.1016/j.giq.2023.101860 |
[16, 18]
.
Categorical tests confirm significant differences for System Quality (Wald χ
2(3) = 80.25, p <.001), Information Quality (χ
2(3) = 26.72, p <.001), and Service Quality (χ
2(3) = 27.04, p <.001). The progression is not perfectly linear: the clearest separation occurs among regular multi-function users, whereas exploration and limited operational use produce less consistent differences. This pattern supports the distinction between access, experimentation, and an organizationally embedded AI capability
| [13] | Raisch, S., & Krakowski, S. (2021). Artificial intelligence and management: The automation-augmentation paradox. Academy of Management Review, 46(1), 192-210.
https://doi.org/10.5465/amr.2018.0072 |
| [15] | Mikalef, P., & Gupta, M. (2021). Artificial intelligence capability: Conceptualization, measurement calibration, and empirical study on its impact on organizational creativity and firm performance. Information & Management, 58(3), 103434.
https://doi.org/10.1016/j.im.2021.103434 |
| [16] | Jöhnk, J., Weißert, M., & Wyrtki, K. (2021). Ready or not, AI comes - An interview study of organizational AI readiness factors. Business & Information Systems Engineering, 63(1), 5-20. https://doi.org/10.1007/s12599-020-00676-7 |
[13, 15, 16]
.
The evidence therefore suggests an integration threshold rather than a simple adoption gradient. Episodic use may improve isolated tasks without altering the wider M&E system. Recurrent use across functions creates more opportunity to affect workflows, information production, and access to evidence. This interpretation is compatible with research showing heterogeneous productivity gains once AI becomes part of routine professional work
| [14] | Brynjolfsson, E., Li, D., & Raymond, L. (2025). Generative AI at work. The Quarterly Journal of Economics, 140(2), 889-942.
https://doi.org/10.1093/qje/qjae044 |
| [27] | Noy, S., & Zhang, W. (2023). Experimental evidence on the productivity effects of generative artificial intelligence. Science, 381(6654), 187-192. https://doi.org/10.1126/science.adh2586 |
[14, 27]
.
Taken together, H1a-H1c are supported. The association is strongest for System Quality, followed by Information Quality, and is more moderate for Service Quality. Convergence across distributional tests, rank coefficients, effect-size estimates, and adjusted ordinal models supports the reinforcement proposition, while the cross-sectional design precludes causal interpretation.
3.3. Organizational Evidence Capability, Net Benefits, and Operational Gains
H2 tests the association between M&E System Effectiveness (MESE) and Organizational Evidence Capability (OEC). H3 tests MESE and Net Benefits. H4 tests AI-use intensity against reported changes in processing time, reporting time, data quality, and evidence use.
OEC has a median of 4.0 [IQR 3.0-4.0]. Kendall's τb equals .798 for KIM,.726 for RBM, and .663 for EBDM (all p <.001), and .827 for OEC overall. After adjustment for M&E system maturity, the partial rank correlation between MESE and OEC remains .858 (p <.001). The association therefore spans the organizational evidence functions rather than a single dimension.
Table 8. Relationships between M&E system effectiveness, organizational evidence capability, and net benefits.
Hypothesis | Outcome | Median [IQR] | Kendall’s τb | Partial ρ* | Adjusted cumulative OR [95% CI] | p-value | Conclusion |
H2 | Results-Based Management | 3.0 [3.0-4.0] | .726*** | .765*** | 12.59 [6.10-26.00] | <.001 | Supported |
H2 | Knowledge & Information Management | 4.0 [3.0-4.0] | .798*** | .851*** | 35.47 [13.85-90.85] | <.001 | Supported |
H2 | Evidence-Based Decision-Making | 4.0 [3.25-4.0] | .663*** | .718*** | 6.80 [3.93-11.77] | <.001 | Supported |
H2 | Overall Organizational Evidence Capability | 4.0 [3.0-4.0] | .827* | .858* | 10.82 [6.60-17.74] | <.001 | Supported |
H3 | M&E System Net Benefits | 3.0 [2.5-4.0] | .638* | .687* | 7.15 [4.35-11.76] | <.001 | Supported |
A one-standard-deviation increase in ranked MESE is associated with 10.82 times higher cumulative odds of a stronger OEC response (95% CI [6.60, 17.74], p <.001). Component estimates are also large: KIM OR = 35.47, RBM OR = 12.59, and EBDM OR = 6.80 (
Table 8). These estimates indicate strong ordinal concordance between related constructs, not causal effect sizes, and are consistent with the evidence-to-decision architecture
and information-systems theory
| [3] | DeLone, W. H., & McLean, E. R. (2003). The DeLone and McLean model of information systems success: A ten-year update. Journal of Management Information Systems, 19(4), 9-30. https://doi.org/10.1080/07421222.2003.11045748 |
| [24] | Petter, S., DeLone, W., & McLean, E. (2008). Measuring information systems success: Models, dimensions, measures, and interrelationships. European Journal of Information Systems, 17(3), 236-263. https://doi.org/10.1057/ejis.2008.15 |
[3, 24]
.
H3 is also supported because Net Benefits have a median of 3.0 [2.5-4.0], with τb =.638 and a maturity-adjusted partial ρ = .687 (both p < .001). The adjusted cumulative OR is 7.15 (95% CI [4.35, 11.76], p <.001). High reported benefits are most common for programme design (57.3%), strategic planning (56.0%), and portfolio management (56.0%), consistent with the downstream role of Net Benefits
.
Operational indicators provide a distinct test of H4. At least a 26% improvement is reported by 68.0% of respondents for data-processing time, 74.7% for reporting time, 73.3% for data quality, and 80.0% for evidence use in decisions. These are practitioner estimates rather than independently measured changes.
Table 9. Association between AI-use intensity and reported operational M&E gains.
Operational outcome | ≥26% gain | Kendall’s τb | Adjusted stage-trend OR [95% CI] | p-value | Regular use vs. no use OR [95% CI] | Joint categorical p-value | H4 result |
Data-processing time reduction | 68.0% | .174 | 1.37 [0.88-2.15] | .165 | 2.30 [0.61-8.61] | .423 | Not supported |
Reporting-time reduction | 74.7% | .349*** | 1.99 [1.27-3.10] | .002 | 6.76 [1.83-25.00] | .015 | Supported |
Data-quality improvement | 73.3% | .350*** | 2.00 [1.29-3.09] | .002 | 6.70 [1.85-24.23] | .012 | Supported |
Greater evidence use in decisions | 80.0% | .289** | 1.83 [1.21-2.78] | .004 | 4.83 [1.51-15.40] | .033 | Supported |
Each progression in AI-use stage is associated with higher reporting-time reduction (OR = 1.99, 95% CI [1.27, 3.10], p =.002), data-quality improvement (OR = 2.00, 95% CI [1.29, 3.09], p =.002), and evidence use (OR = 1.83, 95% CI [1.21, 2.78], p =.004). The processing-time estimate is positive but not statistically significant (OR = 1.37, p =.165). H4 is therefore supported for reporting efficiency, data quality, and evidence use, but not for data-processing time (
Table 9).
The categorical specification reinforces the stage-trend results. Relative to non-users, regular multi-function users have 6.76 times higher odds of a stronger reporting-time reduction category, 6.70 times higher odds of data-quality improvement, and 4.83 times higher odds of greater evidence use. Joint categorical effects are significant for these outcomes but not processing time. Exploration alone shows no comparable separation.
Robustness tests leave H2 and H3 materially unchanged. The OEC estimate remains 10.14 [6.03-17.07] after adding AI-use stage and 10.75 [6.33-18.27] after further adjustment for experience and professional status. The corresponding Net Benefits estimates are 7.35 [4.56-11.83] and 9.04 [5.20-15.72]. Alternative cumulative-probit models yield the same substantive conclusions (p <.001).
H4 is similarly stable after additional adjustment: AI-use stage remains significant for reporting time (OR = 1.94, p =.035), data quality (OR = 1.92, p =.037), and evidence use (OR = 2.04, p =.028), while processing time remains non-significant (OR = 1.25, p =.454). Ordered-probit models reproduce the same pattern.
Overall, H2 and H3 receive strong support and H4 partial support. Stronger M&E effectiveness is associated with evidence capability and broader M&E benefits. Deeper AI use is associated with selected operational gains, but the processing-time result shows that benefits do not arise uniformly across tasks
| [14] | Brynjolfsson, E., Li, D., & Raymond, L. (2025). Generative AI at work. The Quarterly Journal of Economics, 140(2), 889-942.
https://doi.org/10.1093/qje/qjae044 |
| [17] | Mikalef, P., Lemmer, K., Schaefer, C., Ylinen, M., Fjørtoft, S. O., Torvatn, H. Y., Gupta, M., & Niehaves, B. (2023). Examining how AI capabilities can foster organizational performance in public organizations. Government Information Quarterly, 40(2), 101797. https://doi.org/10.1016/j.giq.2022.101797 |
| [26] | Melville, N., Kraemer, K., & Gurbaxani, V. (2004). Review: Information technology and organizational performance: An integrative model of IT business value. MIS Quarterly, 28(2), 283-322. https://doi.org/10.2307/25148636 |
| [27] | Noy, S., & Zhang, W. (2023). Experimental evidence on the productivity effects of generative artificial intelligence. Science, 381(6654), 187-192. https://doi.org/10.1126/science.adh2586 |
[14, 17, 26, 27]
.
Results align with the proposed pathway. Deeper AI integration corresponds with stronger M&E effectiveness, while stronger M&E effectiveness is associated with greater Organizational Evidence Capability and higher Net Benefits. AI use also relates to several operational improvements. Consistency across ordinal specifications reinforces this empirical pattern, although temporal ordering and unobserved organizational differences remain unresolved.
4. Discussion
4.1. Interpretation and Theoretical Contribution
Findings support a view of AI as a reinforcement capability within M&E effectiveness rather than as an additional dimension of system performance. Associations are strongest for System Quality and Information Quality, while Service Quality shows a more moderate relationship. Similar patterns extend to Organizational Evidence Capability and Net Benefits. Overall, results align more closely with capability complementarity than with a direct technology-to-performance relationship.
System Quality provides the clearest entry point for AI integration. AI can reduce manual burden, improve information flows, and strengthen recurrent M&E processes, all of which correspond to system characteristics that underpin effective information use
| [3] | DeLone, W. H., & McLean, E. R. (2003). The DeLone and McLean model of information systems success: A ten-year update. Journal of Management Information Systems, 19(4), 9-30. https://doi.org/10.1080/07421222.2003.11045748 |
| [24] | Petter, S., DeLone, W., & McLean, E. (2008). Measuring information systems success: Models, dimensions, measures, and interrelationships. European Journal of Information Systems, 17(3), 236-263. https://doi.org/10.1057/ejis.2008.15 |
[3, 24]
. This finding extends Ba’s M&E framework
by showing that AI becomes most consequential when organizations embed it in routine evidence processes rather than confine its use to isolated analytical tasks.
Information Quality shows the same direction but a less uniform gradient. Stronger results are concentrated among regular multi-function users, which distinguishes adoption from integration. Access to a platform may improve an individual task; recurrent organizational use has greater potential to alter validation, synthesis, and analytical routines. This interpretation is consistent with AI capability and readiness research
| [15] | Mikalef, P., & Gupta, M. (2021). Artificial intelligence capability: Conceptualization, measurement calibration, and empirical study on its impact on organizational creativity and firm performance. Information & Management, 58(3), 103434.
https://doi.org/10.1016/j.im.2021.103434 |
| [16] | Jöhnk, J., Weißert, M., & Wyrtki, K. (2021). Ready or not, AI comes - An interview study of organizational AI readiness factors. Business & Information Systems Engineering, 63(1), 5-20. https://doi.org/10.1007/s12599-020-00676-7 |
[15, 16]
.
The weaker Service Quality association limits technological determinism. Faster retrieval or synthesis does not ensure more responsive M&E services because responsiveness depends on institutional arrangements, user relationships, and professional judgment. This boundary accords with complementarity theory
| [26] | Melville, N., Kraemer, K., & Gurbaxani, V. (2004). Review: Information technology and organizational performance: An integrative model of IT business value. MIS Quarterly, 28(2), 283-322. https://doi.org/10.2307/25148636 |
[26]
and public-sector evidence on the institutional mediation of AI value
| [17] | Mikalef, P., Lemmer, K., Schaefer, C., Ylinen, M., Fjørtoft, S. O., Torvatn, H. Y., Gupta, M., & Niehaves, B. (2023). Examining how AI capabilities can foster organizational performance in public organizations. Government Information Quarterly, 40(2), 101797. https://doi.org/10.1016/j.giq.2022.101797 |
[17]
.
Downstream findings extend the argument from technical performance to evidence use. MESE is strongly associated with RBM, KIM, and EBDM, supporting Ba's evidence-to-decision architecture
. The especially strong KIM relationship is consistent with evidence-use research. M&E has limited institutional value when findings remain confined to reports rather than enter relationships and processes that connect producers with decision-makers
| [7] | Amisi, M. M., Awal, M. S., Pabari, M., & Bedu-Addo, D. (2021). How relationship and dialogue facilitate evidence use: Lessons from African countries. African Evaluation Journal, 9(1), a559. https://doi.org/10.4102/aej.v9i1.559 |
[7]
. This logic also reflects DeLone and McLean's emphasis on use and consequences
.
The association with Net Benefits clarifies AI's place in the chain. AI need not have a direct path to organizational outcomes. Its contribution can arise through reinforcement of M&E processes that connect information quality to evidence capability and programme management
| [3] | DeLone, W. H., & McLean, E. R. (2003). The DeLone and McLean model of information systems success: A ten-year update. Journal of Management Information Systems, 19(4), 9-30. https://doi.org/10.1080/07421222.2003.11045748 |
| [4] | Ba, A. (2021). How to measure monitoring and evaluation system effectiveness? African Evaluation Journal, 9(1), a553.
https://doi.org/10.4102/aej.v9i1.553 |
| [24] | Petter, S., DeLone, W., & McLean, E. (2008). Measuring information systems success: Models, dimensions, measures, and interrelationships. European Journal of Information Systems, 17(3), 236-263. https://doi.org/10.1057/ejis.2008.15 |
[3, 4, 24]
. This is consistent with AI value as an organizational capability rather than technology ownership
| [15] | Mikalef, P., & Gupta, M. (2021). Artificial intelligence capability: Conceptualization, measurement calibration, and empirical study on its impact on organizational creativity and firm performance. Information & Management, 58(3), 103434.
https://doi.org/10.1016/j.im.2021.103434 |
[15]
.
Operational findings add an important qualification. AI use is associated with reporting efficiency, data quality, and evidence use, but not reliably with processing time. Effects therefore vary by task, as other experimental and workplace evidence also shows
| [14] | Brynjolfsson, E., Li, D., & Raymond, L. (2025). Generative AI at work. The Quarterly Journal of Economics, 140(2), 889-942.
https://doi.org/10.1093/qje/qjae044 |
| [27] | Noy, S., & Zhang, W. (2023). Experimental evidence on the productivity effects of generative artificial intelligence. Science, 381(6654), 187-192. https://doi.org/10.1126/science.adh2586 |
[14, 27]
. The automation-augmentation paradox suggests that value emerges through interaction with professional expertise rather than wholesale substitution
| [13] | Raisch, S., & Krakowski, S. (2021). Artificial intelligence and management: The automation-augmentation paradox. Academy of Management Review, 46(1), 192-210.
https://doi.org/10.5465/amr.2018.0072 |
[13]
.
The theoretical contribution is thus the integration of M&E effectiveness with organizational AI capability. Ba explains how M&E quality connects to evidence capability and benefits
, while AI capability and readiness research explains why technology requires institutional integration
| [15] | Mikalef, P., & Gupta, M. (2021). Artificial intelligence capability: Conceptualization, measurement calibration, and empirical study on its impact on organizational creativity and firm performance. Information & Management, 58(3), 103434.
https://doi.org/10.1016/j.im.2021.103434 |
| [16] | Jöhnk, J., Weißert, M., & Wyrtki, K. (2021). Ready or not, AI comes - An interview study of organizational AI readiness factors. Business & Information Systems Engineering, 63(1), 5-20. https://doi.org/10.1007/s12599-020-00676-7 |
[15, 16]
. The concentration of stronger outcomes among regular multi-function users suggests a possible integration threshold, but causal and temporal tests remain necessary.
4.2. Institutional and Policy Implications
The results shift managerial attention from AI adoption counts to evidence-system performance. Regular use across several M&E functions appears more consequential than exploration, which means that platform access or isolated pilots are weak indicators of organizational AI capability. Institutions should identify specific M&E processes where AI can address a documented constraint and assess whether its integration improves system performance
| [15] | Mikalef, P., & Gupta, M. (2021). Artificial intelligence capability: Conceptualization, measurement calibration, and empirical study on its impact on organizational creativity and firm performance. Information & Management, 58(3), 103434.
https://doi.org/10.1016/j.im.2021.103434 |
| [26] | Melville, N., Kraemer, K., & Gurbaxani, V. (2004). Review: Information technology and organizational performance: An integrative model of IT business value. MIS Quarterly, 28(2), 283-322. https://doi.org/10.2307/25148636 |
[15, 26]
.
M&E maturity should guide the pace of integration. AI can add value in workflow management, information retrieval, quality control, and analytical support, but weak underlying processes can limit those returns. Organizational readiness is a prerequisite for effective use
| [16] | Jöhnk, J., Weißert, M., & Wyrtki, K. (2021). Ready or not, AI comes - An interview study of organizational AI readiness factors. Business & Information Systems Engineering, 63(1), 5-20. https://doi.org/10.1007/s12599-020-00676-7 |
[16]
, and complementary capabilities remain important in developing-economy contexts
. Institutions with fragile evidence systems may therefore gain more from strengthening core processes before expanding advanced AI applications.
Professional capability remains equally important. AI can accelerate analytical work, but responsibility for methodological interpretation and contextual validity remains with M&E professionals. The augmentation perspective implies that organizations need capacity to scrutinize AI-assisted evidence, identify unsuitable uses, and retain human authority over consequential judgments
| [13] | Raisch, S., & Krakowski, S. (2021). Artificial intelligence and management: The automation-augmentation paradox. Academy of Management Review, 46(1), 192-210.
https://doi.org/10.5465/amr.2018.0072 |
[13]
. Without such scrutiny, technical efficiency can become an evidentiary risk.
AI modernization should also remain anchored in the evidence-to-decision architecture. Faster information production has limited value if outputs do not enter programme reviews, performance discussions, and management decisions. This implication follows the M&E effectiveness model
and evidence-use research that emphasizes institutional relationships rather than information availability alone
| [7] | Amisi, M. M., Awal, M. S., Pabari, M., & Bedu-Addo, D. (2021). How relationship and dialogue facilitate evidence use: Lessons from African countries. African Evaluation Journal, 9(1), a559. https://doi.org/10.4102/aej.v9i1.559 |
[7]
.
At policy level, capability-centered frameworks are preferable to technology-centered adoption targets. Public institutions should assess whether AI strengthens defined evidence and decision functions, while governance keeps pace with operational use. OECD analysis emphasizes institutional capacity in public-sector AI
, and public-administration research links value creation to organizational capability
| [17] | Mikalef, P., Lemmer, K., Schaefer, C., Ylinen, M., Fjørtoft, S. O., Torvatn, H. Y., Gupta, M., & Niehaves, B. (2023). Examining how AI capabilities can foster organizational performance in public organizations. Government Information Quarterly, 40(2), 101797. https://doi.org/10.1016/j.giq.2022.101797 |
| [18] | van Noordt, C., & Tangi, L. (2023). The dynamics of AI capability and its influence on public value creation of AI within public administration. Government Information Quarterly, 40(4), 101860.
https://doi.org/10.1016/j.giq.2023.101860 |
[17, 18]
. NIST governance principles
| [21] | National Institute of Standards and Technology. (2023). Artificial intelligence risk management framework (AI RMF 1.0) (NIST AI 100-1). U.S. Department of Commerce.
https://doi.org/10.6028/NIST.AI.100-1 |
[21]
and the documented risk of unsupported generative outputs
| [22] | Ji, Z., Lee, N., Frieske, R., Yu, T., Su, D., Xu, Y., Ishii, E., Bang, Y. J., Chen, D., Dai, W., Chan, H. S., Madotto, A., & Fung, P. (2023). Survey of hallucination in natural language generation. ACM Computing Surveys, 55(12), Article 248, 1-38.
https://doi.org/10.1145/3571730 |
[22]
further imply that traceability, validation, and accountable human oversight are essential when AI-assisted evidence enters public decisions.
For African development institutions, the appropriate strategy is staged AI integration tied to demonstrated M&E value. The absence of a robust processing-time association cautions against assuming uniform benefits. Different levels of M&E maturity also make a single adoption model inappropriate. AI should therefore be treated as part of evidence-system strengthening, with the pace and scope of integration matched to institutional readiness and with success assessed through measurable improvements in evidence quality and decision use.
4.3. Limitations and Future Research
The cross-sectional design does not establish temporal precedence, and stronger evidence systems may also have greater digital capacity and a higher propensity to adopt AI. Adjustment for M&E system maturity and robustness checks reduce, but do not eliminate, reverse causality or residual confounding. The findings should therefore be interpreted as conditional associations rather than causal effects
. Longitudinal designs could follow systems as they move from experimentation to recurrent integration.
The purposive sample of 75 experienced practitioners provides useful variation but does not support statistical generalization to all African M&E systems. West Africa is overrepresented, and no cases occupy the highest organization-wide AI-integration category. Larger comparative samples could test whether the observed relationships differ by country, sector, or institutional setting and whether the apparent advantage of regular multi-function use persists at more advanced stages
| [29] | American Association for Public Opinion Research. (2013). Report of the AAPOR task force on non-probability sampling. AAPOR. |
[29]
.
Most outcomes are practitioner assessments, including the ordered percentage-change indicators. Future studies should combine survey measures with system logs, reporting timestamps, data-quality audits, and documented evidence-use decisions. Larger samples would also permit ordinal confirmatory factor analysis and structural models of the full pathway from AI integration through M&E effectiveness to evidence capability and net benefits, which would provide stronger tests of the conceptual distinctions in Ba
and complementary-capability theory
| [15] | Mikalef, P., & Gupta, M. (2021). Artificial intelligence capability: Conceptualization, measurement calibration, and empirical study on its impact on organizational creativity and firm performance. Information & Management, 58(3), 103434.
https://doi.org/10.1016/j.im.2021.103434 |
[15]
.
Future research should therefore test where, when, and for whom AI integration improves M&E performance. Comparative longitudinal designs that incorporate organizational readiness, professional capability, governance, and objective performance measures would provide a stronger basis for examining the integration threshold suggested here and for testing the interaction between AI and human expertise
| [13] | Raisch, S., & Krakowski, S. (2021). Artificial intelligence and management: The automation-augmentation paradox. Academy of Management Review, 46(1), 192-210.
https://doi.org/10.5465/amr.2018.0072 |
| [16] | Jöhnk, J., Weißert, M., & Wyrtki, K. (2021). Ready or not, AI comes - An interview study of organizational AI readiness factors. Business & Information Systems Engineering, 63(1), 5-20. https://doi.org/10.1007/s12599-020-00676-7 |
[13, 16]
.







 Share This Article
 Twitter
 Linked In
 Facebook
 Copy
Copy Download