
Ensuring the potability of drinking water is an ongoing challenge for all worldwide nations. “In this study, we” evaluated dissolved “radon concentrations in” tap water consumed “in” Abidjan, Côte d’Ivoire. Samples of tap water were collected in vials throughout 13 communes of Abidjan District. After being exposed for 97 days to sheets of LR 115 detector, they were chemically etched and track onto their surfaces were optically counted. The results of the obtained dissolved radon concentrations ranged from (0.13 ± 0.06) Bq/L to (2.12 ± 0.87) Bq/L with an average of (0.81 ± 0.34) Bq/L. The resulting total annual effective doses received by the public range from (1.3 ± 0.6) µSv/Y to (21 ± 9) µSv/Y with an average of (7.93 ± 3.25) µSv/Y. The obtained average dissolved radon concentration in tap water and corresponding total annual effective dose are larger and smaller than those obtained in Egypt, Pakistan, Palestine by some authors and in Libya, Saudi Arabia by others, respectively. But, these results are much lower than the threshold values of 100 Bq/L and 100 µSv/Y recommended by the World Health Organization (WHO) to States to take action. This preliminary study should be extended to other regions and drinking water sources across Côte d’Ivoire.
| Published in | Radiation Science and Technology (Volume 12, Issue 3) |
| DOI | 10.11648/j.rst.20261203.11 |
| Page(s) | 44-51 |
| Creative Commons |
This is an Open Access article, distributed under the terms of the Creative Commons Attribution 4.0 International License (http://creativecommons.org/licenses/by/4.0/), which permits unrestricted use, distribution and reproduction in any medium or format, provided the original work is properly cited. |
| Copyright |
Copyright © The Author(s), 2026. Published by Science Publishing Group |
Tap Water, LR 115 Detector, Radon Concentration, Radon Effective Dose, Abidjan
Site Name | Ventilation | Cd (Bq/L) | Ding (µSv/Y) | Dinh (µSv/Y) | DT (µSv/Y) |
|---|---|---|---|---|---|
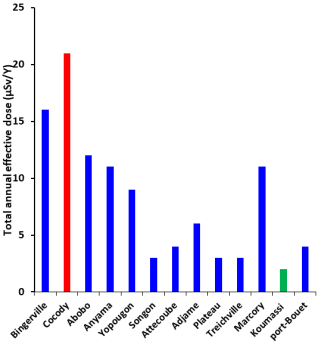
Bingerville | Poor | 1.61 ± 0.66 | 12 ± 5 | 4 ± 2 | 16 ± 7 |
Cocody | Poor | 2.12 ± 0.87 | 16 ± 7 | 5 ± 2 | 21 ± 9 |
Abobo | Moderate | 1.19 ± 0.49 | 9 ± 4 | 3 ± 1 | 12 ± 5 |
Anyama | Good | 1.14 ± 0.47 | 8 ± 3 | 3 ± 1 | 11 ± 4 |
Yopougon | Good | 0.99 ± 0.41 | 7 ± 3 | 2 ± 1 | 9 ± 4 |
Songon | Good | 0.28 ± 0.12 | 2.1 ± 0.9 | 1.0 ± 0.3 | 3.1 ± 1.2 |
Attecoube | Good | 0.44 ± 0.18 | 3 ± 1 | 1.1 ± 0.5 | 4.1 ± 1.5 |
Adjame | Good | 0.62 ± 0.26 | 4 ± 2 | 2 ± 1 | 6 ± 3 |
Plateau | Good | 0.31 ± 0.13 | 2.3 ± 0.9 | 1.0 ± 0.3 | 3.3 ± 1.2 |
Treichville | Moderate | 0.13 ± 0.06 | 1.0 ± 0.4 | 0.3 ± 0.2 | 1.3 ± 0.6 |
Marcory | Good | 1.06 ± 0.44 | 8 ± 3 | 3 ± 1 | 11 ± 4 |
Koumassi | Good | 0.23 ± 0.10 | 2 ± 1 | 0.6 ± 0.2 | 2.6 ± 1.2 |
Port-Bouet | Good | 0.39 ± 0.16 | 3 ± 1 | 1.0 ± 0.4 | 4.0 ± 1.4 |
Average | 0.81 ± 0.34 | ||||
Average | 7.93 ± 3.25 |
Water type | Cd (Bq/L) | Reference | Country |
|---|---|---|---|
Drinking water | 1.65-3.82 | Entesar et al, 2019 [13] | Saudi Arabia |
Drinking water | 0.27-5.40 | Shilpa et al, 2017 [23] | India |
Drinking water | 0.20-1.23 (0.60) | Thabeyneh, 2015 [24] | Palestine |
Drinking water | 1.02-6.42 (3.46) | Rafat, 2014 [25] | Libya |
Tap water | 0.04-0.48 (0.14) | Hussein, 2014 [26] | Egypt |
Drinking water | 0.33-0.90 (0.60) | Nasir et al, 2012 [27] | Pakistan |
Drinking water | 0.39-0.47 | Marques et al, 2004 [28] | Brazil |
Tap water | 0.13-2.12 (0.81) | Present study | Côte d’Ivoire |
LR 115 | Lexan Resin 115 |
WHO | World Health Organization |
SSNTD | Solid State Nuclear Track Detector |
DCF | Dose Conversion Factor |
| [1] | Phoka C. Rathebe, Mota Xavier Kholopo. Radon Detection in Drinking Water: Instruments and Measurement Techniques—A Comprehensive Review. Applied Sciences. 2026, 16(18), 9147. |
| [2] |
IARC. Man-Made Mineral Fibres and Radon. Available from:
https://publications.iarc.who.int/61 (accessed 13 October 2026). |
| [3] | Joash N. Ongori, Robert Lindsay, Mashinga J. Mvelase. Radon transfer velocity at the water–air interface. Applied Radiation and Isotopes. 2015, Volume 105, Pages: 144-149. |
| [4] | Yehia Manawi, Arzoo Hassan, Muataz Ali Atieh, Jenny Lawler. Overview of radon gas in groundwater around the world: Health effects and treatment technologies. Journal of Environmental Management. 2024, Volume 368, 122176. |
| [5] |
WHO, (2022). Guidelines for drinking-water quality: fourth edition incorporating the first and second addenda. Available from:
https://www.who.int/publications/i/item/9789240045064 (accessed 13 October 2026). |
| [6] | Wau, M. K., Willie, H., Kolkoma, D. et al. Quantifying dissolved radon in drinking water using an augmented method. Journal of Radioanalytical and Nuclear Chemistry. 2026, 335, 5263–5269. |
| [7] | Kezo, P. C., Konate, I. and Agba, D. S. I. Gross Alpha and Beta Activities and Related Life time Risks Assessment Due to Ingestion of Drinking Water from Different Sources in the District of Abidjan, Cote d’Ivoire. World Journal of Nuclear Science and Technology. 2024, 14, 86-96. |
| [8] | Kezo P. C., Monnehan G. A., Faanu A., Gogon B. D. L. H., Koua A. A., Dali T. P. A., Djagouri K. Assessment of the Exposure to Natural Radioactivity to Public from the Consumption of Tap Drinking Water in the Six Most Populated Townships of the District of Abidjan. Research Journal of Environmental and Earth Sciences. 2016, 8(4), 56-62. |
| [9] | Suresh S, Rangaswamy D R, Srinivasa E and Sannappa J. Measurement of radon concentration in drinking water and natural radioactivity in soil and their radiological hazards. JOURNAL OF RADIATION RESEARCH AND APPLIED SCIENCES. 2020, VOL. 13, NO. 1, 12–26. |
| [10] | Habila Nuhu, Suhairul Hashima, Mohamad Syazwan Mohd Sanusi and Muneer Aziz Saleh. Radon activity concentration measurements in water sources from Perak state Malaysia. JOURNAL OF RADIATION RESEARCH AND APPLIED SCIENCES. 2020, VOL. 13, NO. 1, 665–671. |
| [11] |
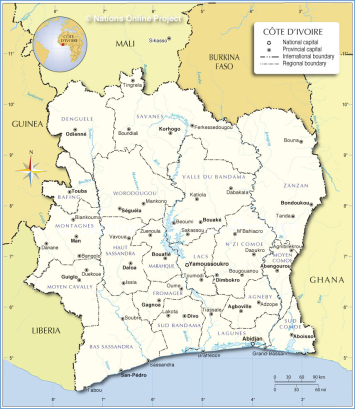
Nations online project. Administrative Map of Côte d’Ivoire. Available from:
https://www.nationsonline.org (accessed 14 October 2026). |
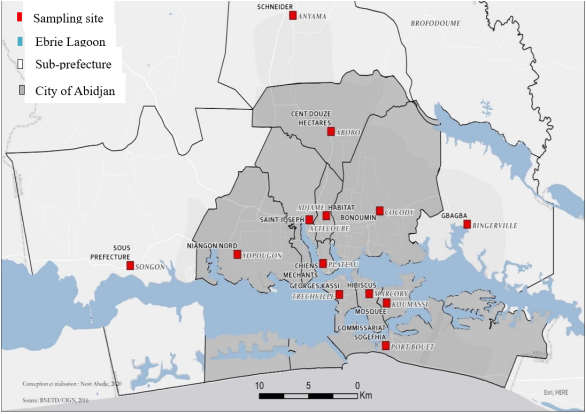
| [12] | Nesit Abedje, (2020). Carte d’Abidjan, [Unpublished institutional document]. Bureau National d’Etudes Techniques et de Développement (BNETD), Côte d’Ivoire. |
| [13] | Entesar H. El-Araby, H. A. Soliman and M. Abo-Elmagd. Measurement of radon levels in water and the associated health hazards in Jazan, Saudi Arabia. Journal of Radiation Research and Applied Sciences, 2019, Vol 12, N°1, 31-36. |
| [14] | Liath Ahmed Najam, Hazim Louis Mansour, Nada Fadhil Tawfiq, Mahmood Salim Karim. Measurement of radon concentrations in tap water samples for Thi-Qar Governorate using nuclear track detector (CR-39). Detection. 2016, 4, 1-8. |
| [15] | Stage PAF. Notion d'erreurs et d'incertitudes en sciences expérimentales. Académie de Toulouse. |
| [16] |
UNSCEAR. Report to the General Assembly, With Scientific Annexes, United Nations Sales Publication E.94.IX.2; United Nations: New York. Available from:
https://www.unscear.org/unscear/publications/1993.html (accessed 16 October 2026). |
| [17] |
UNSCEAR. Report of the United Nations Scientific Committeeon the Effects of Atomic Radiation to the General Assembly. ANNEX B exposures from natural radiation sources. Available from:
https://www.unscear.org/unscear/uploads/documents/unscear-reports/UNSCEAR_2000_Report_Vol.I.pdf (accessed 16 October 2026). |
| [18] |
WHO. Guidelines for drinking-water quality (3rd ed.). Available from:
https://www.who.int/publications/i/item/9789241547611 (accessed 17 October 2026). |
| [19] | Abdulkarim Abubakar, Mohammed Audu, Sama’ila Ibrahim and Magaji Musa Jawa. Determination of RADON-222 Concentration in Some Selected Drinking Water Sources at Geidam Town, Geidam Local Government Area of Yobe State, Nigeria. Journal of Emerging Technologies and Innovative Research (JETIR), 2021, Volume 8, Issue 2. |
| [20] | Pintilie-Nicolov, V., Georgescu, P. L., Iticescu, C. et al. The assessment of the annual effective dose due to ingestion of radionuclides from drinking water consumption: calculation methods. Journal of Radioanalytical and Nuclear Chemistry. 2021, 327, 49–58. |
| [21] | Binesh, A. & Mowlavi, Ali & Mohammadi, S.. Estimation of the effective dose from radon ingestion and inhalation in drinking water sources of Mashhad, Iran. Iranian Journal of Radiation Research. 2012, 10. 37-41. |
| [22] | Dosh, Rukia & Hasan, Ali & Abojassim, Ali. Effective dose (ingestion and inhalation) due to radon from tap water samples in children at primary schools in Najaf city, Iraq. Water Supply. 2023, 23. 1234-1249. |
| [23] | Shilpa, G. M., Anandaram, B. N., & Mohankumari, T. L. Measurement of 222Rn concentration in drinking water in the environs of Thirthahalli taluk, Karnataka, India. Journal of Radiation Research and Applied Sciences. 2017, 10, 262–268. |
| [24] | Thabayneh., K. M. Measurement of 222Rn concentration levels in drinking water and the associated health effects in the Southern part of West bank – Palestine. Applied Radiation and Isotopes. 2015, 103, 48–53. |
| [25] | Rafat M. Amin. Evaluation of radon gas concentration in the drinking water and dwellings of south-west Libya, using CR-39 detectors. International Journal of Environmental Sciences. 2014, 4. 484-490. |
| [26] | A. S. Hussein. Radon measurements in water samples from western desert of Egypt using nuclear track detectors and estimation of corresponding doses. Radiation Protection and Environment. 2014, 37(3): p 165-168. |
| [27] | Nasir, T., & Shah, M. Measurement of annual effective doses of radon from drinking water and dwellings by CR-39 track detectors in kulachi city of Pakistan. Journal of Basic &Applied Sciences. 2012, 8, 528–536. |
| [28] | Marques, A. L., Dos Santos, W., & Geraldo, L. P. Direct measurements of radon activity in water from various natural sources using nuclear track detectors. Applied Radiation and Isotopes. 2004, 60, 801–804. |
| [29] | Sahoo, B. K., & Sapra, B. K. Advances in Measurement of Indoor 222Rn and 220Rn Gas Concentrations Using Solid State Nuclear Track Detectors. Solid State Phenomena. 2015, 238, 116–126. |
APA Style
Agba, D. S. I., Dali, T. P. A., Kouakou, O. (2026). Radon Radiological Risk Assessment Due to Tap Water Consumption in Abidjan, Côte d’Ivoire. Radiation Science and Technology, 12(3), 44-51. https://doi.org/10.11648/j.rst.20261203.11
ACS Style
Agba, D. S. I.; Dali, T. P. A.; Kouakou, O. Radon Radiological Risk Assessment Due to Tap Water Consumption in Abidjan, Côte d’Ivoire. Radiat. Sci. Technol. 2026, 12(3), 44-51. doi: 10.11648/j.rst.20261203.11
@article{10.11648/j.rst.20261203.11,
  author = {Dabo Salif Ignace Agba and Tekpo Paul Amewe Dali and Omer Kouakou},
  title = {Radon Radiological Risk Assessment Due to Tap Water Consumption in Abidjan, Côte d’Ivoire},
  journal = {Radiation Science and Technology},
  volume = {12},
  number = {3},
  pages = {44-51},
  doi = {10.11648/j.rst.20261203.11},
  url = {https://doi.org/10.11648/j.rst.20261203.11},
  eprint = {https://article.sciencepublishinggroup.com/pdf/10.11648.j.rst.20261203.11},
  abstract = {Ensuring the potability of drinking water is an ongoing challenge for all worldwide nations. “In this study, we” evaluated dissolved “radon concentrations in” tap water consumed “in” Abidjan, Côte d’Ivoire. Samples of tap water were collected in vials throughout 13 communes of Abidjan District. After being exposed for 97 days to sheets of LR 115 detector, they were chemically etched and track onto their surfaces were optically counted. The results of the obtained dissolved radon concentrations ranged from (0.13 ± 0.06) Bq/L to (2.12 ± 0.87) Bq/L with an average of (0.81 ± 0.34) Bq/L. The resulting total annual effective doses received by the public range from (1.3 ± 0.6) µSv/Y to (21 ± 9) µSv/Y with an average of (7.93 ± 3.25) µSv/Y. The obtained average dissolved radon concentration in tap water and corresponding total annual effective dose are larger and smaller than those obtained in Egypt, Pakistan, Palestine by some authors and in Libya, Saudi Arabia by others, respectively. But, these results are much lower than the threshold values of 100 Bq/L and 100 µSv/Y recommended by the World Health Organization (WHO) to States to take action. This preliminary study should be extended to other regions and drinking water sources across Côte d’Ivoire.},
 year = {2026}
}
TY  - JOUR
T1  - Radon Radiological Risk Assessment Due to Tap Water Consumption in Abidjan, Côte d’Ivoire
AU  - Dabo Salif Ignace Agba
AU  - Tekpo Paul Amewe Dali
AU  - Omer Kouakou
Y1  - 2026/11/06
PY  - 2026
N1  - https://doi.org/10.11648/j.rst.20261203.11
DO  - 10.11648/j.rst.20261203.11
T2  - Radiation Science and Technology
JF  - Radiation Science and Technology
JO  - Radiation Science and Technology
SP  - 44
EP  - 51
PB  - Science Publishing Group
SN  - 2575-5943
UR  - https://doi.org/10.11648/j.rst.20261203.11
AB  - Ensuring the potability of drinking water is an ongoing challenge for all worldwide nations. “In this study, we” evaluated dissolved “radon concentrations in” tap water consumed “in” Abidjan, Côte d’Ivoire. Samples of tap water were collected in vials throughout 13 communes of Abidjan District. After being exposed for 97 days to sheets of LR 115 detector, they were chemically etched and track onto their surfaces were optically counted. The results of the obtained dissolved radon concentrations ranged from (0.13 ± 0.06) Bq/L to (2.12 ± 0.87) Bq/L with an average of (0.81 ± 0.34) Bq/L. The resulting total annual effective doses received by the public range from (1.3 ± 0.6) µSv/Y to (21 ± 9) µSv/Y with an average of (7.93 ± 3.25) µSv/Y. The obtained average dissolved radon concentration in tap water and corresponding total annual effective dose are larger and smaller than those obtained in Egypt, Pakistan, Palestine by some authors and in Libya, Saudi Arabia by others, respectively. But, these results are much lower than the threshold values of 100 Bq/L and 100 µSv/Y recommended by the World Health Organization (WHO) to States to take action. This preliminary study should be extended to other regions and drinking water sources across Côte d’Ivoire.
VL  - 12
IS  - 3
ER  -
Department of Fundamental and Applied Science, University Nangui Abrogoua, Abidjan, Côte d’Ivoire
Department of Matter Structures Science, University Felix Houphouet Boigny, Abidjan, Côte d’Ivoire
Department of Matter Structures Science, University Felix Houphouet Boigny, Abidjan, Côte d’Ivoire

Information



 Share This Article
 Twitter
 Linked In
 Facebook

 Copy
 Download