Research Article | | Peer-Reviewed

Soil Erosion Asssessment Using the Rusle Model in Lagelu Local Government Area, Oyo State, Nigeria

Received: 13 May 2026     Accepted: 5 June 2026     Published: 6 November 2026
Views:       Downloads:
Abstract

Soil erosion is a major environmental challenge driven by rainfall, runoff, and unsustainable land-use practices, leading to land degradation, reduced agricultural productivity, and sedimentation of water bodies. This study integrates the Revised Universal Soil Loss Equation (RUSLE) with Geographic Information Systems (GIS) to quantify and spatially map soil erosion risk in Lagelu Local Government Area, Oyo State, Nigeria. RUSLE model parameters were derived as follows: rainfall erosivity (R) from rainfall data; soil erodibility (K) from soil maps and laboratory analysis; slope length and steepness (LS) from a digital elevation model; and cover management (C) and conservation practice (P) from land use/land cover and the Normalized Difference Vegetation Index (NDVI) derived from satellite imagery. These factors were combined to estimate annual soil loss. Soil loss ranged from 0.013 to 50.35 t ha-1 yr-1 and was classified into four categories: very high (40.28–50.35 t ha-1 yr-1), moderately high (30.22–40.28 t ha-1 yr-1), moderate (20.15–30.22 t ha-1 yr-1), and low (0.013–20.15 t ha-1 yr-1), covering 5.6%, 31.7%, 28.1%, and 34.6% of the study area, respectively. The results indicate pronounced spatial variability, with most areas falling within low- to moderate-erosion-risk classes. The integration of RUSLE and GIS effectively identified erosion hotspots and generated erosion risk maps, providing a robust basis for land-use planning, agricultural management, and targeted soil conservation interventions.

Published in Science Discovery Agriculture (Volume 1, Issue 4)
DOI 10.11648/j.sda.20260104.13
Page(s) 160-171
Creative Commons

This is an Open Access article, distributed under the terms of the Creative Commons Attribution 4.0 International License (http://creativecommons.org/licenses/by/4.0/), which permits unrestricted use, distribution and reproduction in any medium or format, provided the original work is properly cited.

Copyright

Copyright © The Author(s), 2026. Published by Science Publishing Group

Keywords

Soil Erosion, Lagelu, RUSLE, Land Degradation, GIS

1. Introduction
Soil erosion is widely recognized as one of the most critical environmental challenges affecting land resources, agricultural productivity, and ecosystem sustainability worldwide . As a major form of land degradation, soil erosion involves the detachment and transportation of nutrient-rich topsoil by water or wind, resulting in declining soil fertility, reduced crop yields, sedimentation of water bodies, and deterioration of water quality . These impacts are particularly severe in developing countries, including Nigeria, where agriculture remains a primary source of livelihood and economic stability. In many parts of southwestern Nigeria, including Lagelu Local Government Area of Oyo State, increasing anthropogenic pressures such as deforestation, continuous cultivation, urban expansion, and unsustainable land management practices, coupled with climatic variability, have accelerated soil erosion processes and intensified land degradation .
Land use and land cover changes (LULCC) are key drivers influencing the spatial and temporal dynamics of soil erosion. The transformation of natural vegetation into agricultural and built-up land alters soil structure, reduces vegetation cover, and increases surface runoff, thereby enhancing susceptibility to erosion . These changes disrupt ecohydrological processes, degrade ecosystem services such as soil fertility and water regulation, and threaten environmental resilience and food security . Despite the growing recognition of these challenges, inadequate monitoring systems, limited availability of high-resolution spatial data, and insufficient integration of geospatial technologies have constrained effective identification of erosion-prone areas and hindered the development of targeted soil conservation strategies in many parts of Nigeria.
A comprehensive understanding of the magnitude and spatial distribution of soil erosion is essential for sustainable land management and informed decision-making. Empirical soil erosion models have proven to be valuable tools in this regard. Among them, the Revised Universal Soil Loss Equation (RUSLE) has been widely applied due to its relative simplicity and effectiveness in estimating average annual soil loss . The model integrates key factors, including rainfall erosivity, soil erodibility, slope length and steepness, cover-management practices, and conservation support practices to quantify erosion risk. When integrated with Geographic Information Systems (GIS) and remote sensing techniques, RUSLE enables efficient spatial analysis and mapping of erosion hotspots across large geographic areas, thereby providing critical insights for land-use planning and environmental management .
Recent advancements in geospatial technologies, particularly cloud-based platforms such as Google Earth Engine, have further enhanced the capacity for large-scale environmental modelling by providing access to extensive satellite datasets and high computational power . These tools facilitate improved accuracy, efficiency, and scalability in soil erosion assessment. However, despite these advancements, the application of integrated RUSLE-based approaches remains limited in many Nigerian contexts, including the study area. Furthermore, the empirical nature of RUSLE implies certain limitations, as it does not fully account for complex erosion processes such as gully erosion, channel erosion, and sediment transport dynamics . This underscores the need for context-specific studies that combine modelling approaches with local environmental analysis.
Given these gaps, there is a pressing need for comprehensive and spatially explicit assessments of soil erosion in Lagelu Area of Oyo State. Therefore, this study aims to assess soil erosion using the RUSLE model integrated with GIS and remote sensing techniques. Specifically, the objectives are to (i) evaluate the topographic, soil, and rainfall factors contributing to erosion using the Revised Universal Soil Loss Equation, (ii) estimate the spatial distribution and magnitude of soil loss. The outcomes of this study are expected to provide a scientific basis for soil and water conservation planning, support sustainable land management practices, and enhance environmental resilience and agricultural productivity in the study area.
2. Materials and Methods
2.1. Study Area
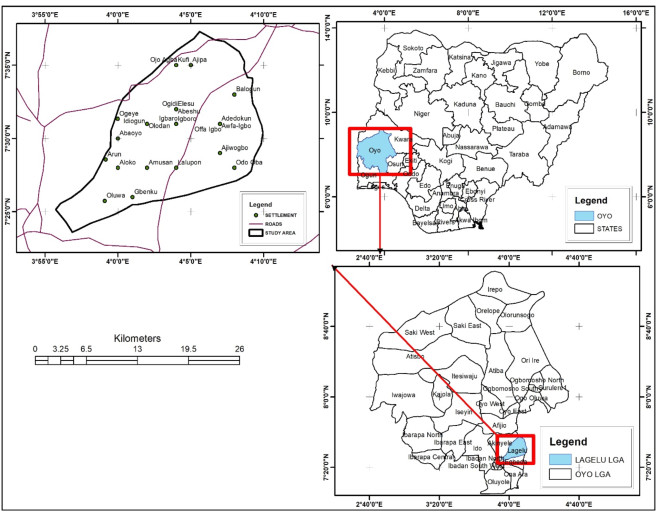
Lagelu Local Government Area is located in the central senatorial zone of Oyo State. It lies between latitudes 7°25′0″N and 7°35′0″N and longitudes 3°55′0″E and 4°10′0″E (Figure 1). The area covers approximately 416 km², with its headquarters at Iyana Offa. The climate of the area is typically equatorial, characterized by a distinct wet season between April and October and a dry season between November and March with relatively high humidity . Annual rainfall ranges between 1000 mm and 1400 mm, with average daily temperatures varying from 25°C to 35°C and relative humidity ranging between 60% and 80% . Geologically, the area is underlain by ancient crystalline Basement Complex rocks, which are predominantly acidic in composition . Common rock types found in the area are gneiss, migmatite, schist, quartzite, and marble, with localized occurrences of granite and syenite, as well as intrusions of amphibolites and olivine-rich dykes . The soils in the area are generally very deep, moderately well-drained, and brownish-sandy in nature, typically overlying loamy sand. Iron and manganese concretions are commonly found at depths of approximately 105 cm. The main occupation of the people in the area is farming with the cultivation of food and cash crops like maize, cassava, millet, yams, cowpea, rice, plantain, cocoa, oil palm, and cashew. Other trades that the people are also engaged in are trading, craftsmanship, artisanal work, repair services, and public service .
Figure 1. Map of the study area.
2.2. RUSLE Model
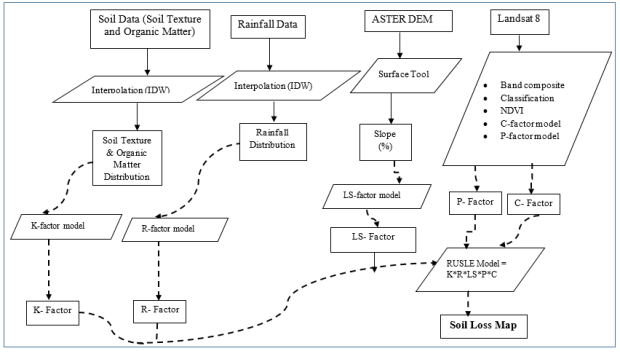
This study utilized both primary and secondary datasets (Table 1), while the overall methodological framework is presented in Figure 2. To estimate soil erosion rates within the study area, the Revised Universal Soil Loss Equation (RUSLE) model was employed. The RUSLE is a widely recognized empirical model developed for predicting soil loss caused by water erosion. It originated from the Universal Soil Loss Equation (USLE), which was formulated in the 1960s by Wischmeier and Smith under the United States Department of Agriculture (USDA) for field-scale erosion assessment . The model was subsequently refined in 1997 to improve its predictive capability and better account for the influence of erosion-related variables . According to previous studies , soil loss estimates derived from the RUSLE model provide a reliable representation of long-term average annual erosion rates. The model integrates the effects of climatic conditions, topography, soil characteristics, land cover, and conservation practices to estimate potential soil loss from a given area . Consequently, this study incorporated meteorological records, soil data, remotely sensed imagery, and Digital Elevation Model (DEM) datasets to derive the required RUSLE parameters. To enhance spatial analysis and improve prediction accuracy, the RUSLE model was implemented within a Geographic Information System (GIS) environment. The average annual soil loss (A), expressed in tons per hectare per year (t ha-1 yr-1), was calculated using the RUSLE equation as shown in Equation (1):
A=R × K × LS × C × P(1)
where A represents the estimated annual soil loss due to water erosion (t ha-1 yr-1); R denotes the rainfall erosivity factor (MJ mm ha-1 h-1 yr-1); K is the soil erodibility factor (t ha h ha-1 MJ-1 mm-1); L and S correspond to the slope length and slope steepness factors, respectively; C represents the cover-management factor; and P denotes the conservation or support practice factor. The latter four factors are dimensionless indices that collectively account for the influence of topography, vegetation cover, land management, and erosion control measures on soil loss.
Table 1. Data Collection, Source, and Use.

Data Acquisition

Data Type

Source

Usage

Coordinates of erosion sites

primary

Field work

Identification of erosion sites

Soil

Primary

Field work

Soil texture, organic matter, soil erodibility

Landsat 8

Secondary

USGS Earth Explorer

Land use and cover, NDVI, cover and management practice (C-factor) and support practice (P-factor)

ASTER DEM

Secondary

USGS Earth Explorer

Slope length

Rainfall

Secondary

mynasadata

Erosivity factor

Figure 2. Methodology Workflow for soil loss assessment.
2.2.1. Rainfall and Runoff Factor (R-factor)
The rainfall erosivity factor (R-factor) represents the erosive force exerted by rainfall and the resulting surface runoff . It reflects the combined effects of rainfall amount, intensity, duration, and energy on the detachment and transportation of soil particles. Among the factors influencing water-induced soil erosion, rainfall characteristics play a critical role in determining the erosive capacity of precipitation events.
The R-factor is commonly defined as the long-term average annual value of rainfall erosivity, which is derived from the relationship between the kinetic energy (KE) of rainfall events, expressed in MJ ha-1, and the maximum 30-minute rainfall intensity, measured in mm h-1 . Rainfall kinetic energy is widely regarded as one of the most effective indicators of precipitation erosivity because it quantifies the impact force of raindrops on the soil surface.
Several empirical and analytical approaches have been developed by researchers to estimate the rainfall erosivity factor, depending on the availability of rainfall data and the environmental characteristics of the study area.
Some of the commonly applied methods include:
R=9.28 × P x 8838(2)
Average yearly erosivity (KE> 25); P is the average yearly rainfall;
R=0.276 × P × I(3)
Average yearly I; P is the average yearly rainfall ;
R=0.5 × P(in US unit) (4)
R=0.5 × P × 1.73(5)
R=38.5+ 0.35 ×Pr(6)
The parameter Pr denotes the average annual precipitation (mm yr-1) recorded within the study area .
In this study, Equation (5) was utilized to estimate the rainfall erosivity (R) factor owing to its demonstrated effectiveness in tropical environments. Mean annual rainfall data were used to generate a precipitation surface, which was analyzed using GIS-based Spatial Analyst techniques to determine the spatial variability of rainfall erosivity throughout the study area.
2.2.2. Soil Erodibility (K-factor)
The soil erodibility factor K is a measure of the intrinsic susceptibility of any given soil to soil erosion. Precisely, the susceptibility of any soil to erosion is controlled by the particle size distribution, organic matter content, structure, and permeability of such soil . In this study, these characteristics were used for calculating the K-factor. The erodibility value of each soil group was determined using equation (7) suggested by :
K=27.66m1.14×10-8× 12- a+0.0043 × b-2+ [0.0033 × (c-3)](7)
Where K denotes the soil erodibility factor (t ha h ha-1 MJ-1 mm-1). The variable m is derived from the relationship between soil particle-size fractions and is computed as (silt% + sand%) × (100 − clay%). a represents soil organic matter content (%), while b corresponds to the soil structure index, ranging from very well-structured soils (1) to compact or massive soils (4). The parameter c represents the permeability index, with values from 1 to 6 indicating permeability classes that vary from rapid to very slow water transmission through the soil profile.
2.2.3. Slope Length and Slope Steepness Factors (LS)
The topographic component of the RUSLE model is represented by the slope length (L) and slope steepness (S) factors, which collectively characterize the effect of terrain on erosion processes. These factors were extracted from a DEM developed from digitized contour data of the study area. Following DEM preprocessing and sink filling, the L and S factors were calculated and integrated using Equation (8) to generate the topographic factor map for soil erosion modelling.
LS=(L22)0.5 (0.065+ 0.45S+ 0.0065S2) (8)
The slope length factor (L) was computed using the standard RUSLE formula
L = (X22.13)^m(9)
Where x represents slope length (m) and m is a variable exponent dependent on slope gradient. Values of m were assigned as 0.5 for slopes exceeding 5%, 0.4 for slopes between 3% and 5%, 0.3 for slopes ranging from 1% to 3%, and 0.2 for slopes below 1%. The slope steepness factor (S) was derived from the percentage slope gradient (s) and was used to represent the effect of terrain inclination on soil erosion susceptibility
S =(0.43 + 0.30s + 0.043s2)6.613(10)
Where s is the gradient (%), and S is the slope gradient factor.
2.2.4. Cover and Management (C-factor)
The cover-management factor (C) quantifies the effect of vegetation and land-management practices on soil erosion by expressing the ratio of soil loss under a given land-cover condition to that from bare soil . C-factor values were assigned to the identified land-use and land-cover classes according to their vegetation characteristics and validated using published values from comparable studies .
As an indicator of the protective role of vegetation, the C-factor reflects the extent to which canopy cover and ground vegetation reduce erosion risk . In this study, the C-factor was derived from the Normalized Difference Vegetation Index (NDVI), which was used to represent vegetation density and health through Equation (11).
C=exp [-∞NDVIβ-NDVI] (11)
The parameters α and β are dimensionless coefficients used to define the functional relationship between NDVI and the C-factor. This method provides a more realistic representation of vegetation effects on soil erosion than a direct linear assumption. Consistent with established practice , α was assigned a value of 2, while β was set to 1.
Normalized difference vegetation index (NDVI) is an indicator of the distribution of vegetation on a given area, and it is one of the most commonly used methods for the determination of C factor . The NDVI was calculated based on the measured reflectance in the visible and near-infrared region based on the following algorithm , where RED and NIR are standards for measuring the spectral reflectance obtained in the visible and near-infrared regions. The spectral reflectance represents the proportion between the incoming and the reflected electromagnetic energy for each individual spectral range, where the NDVI varies between -1.0 and 1.0.
NDVI=NIR-REDNIR+RED(12)
2.2.5. Conservation or Protection Factor (P Factor)
The support practice factor (P-factor) reflects the effectiveness of land management measures implemented to reduce soil erosion within a specific area. Common conservation practices include contour ploughing, strip cropping, and terracing . The P-factor is expressed on a scale ranging from 0 to 1, where values close to 0 indicate highly effective erosion-control structures or management interventions, while a value of 1 signifies the absence of any conservation practices.
In this study, P-factor values were determined through field observations and ground verification within the study area.
However, the model categorized soil loss ton/ha yr into 50.35 – above (Very High), 40.28 -50.35 (High), 30.22 - 40.28 (Moderately High), 20.15 - 30.32 (Moderate), 20.15 - 0.013 (Low), 0.013 – below (Very low) as the rating scale.
3. Results and Discussion
3.1. Assessing Soil Loss in the Study Area
Annual soil loss was examined using the RUSLE model integrated into a GIS environment. The annual soil loss was obtained from the product of the rainfall erosivity factor (R), slope length and slope steepness (LS), soil erodibility factor (K), cover factor (C), and conservation or protection factor (P) of the study area.
3.1.1. Rainfall Erosivity (R) Factor
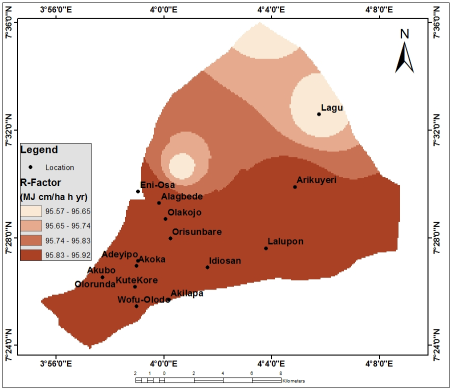
Figure 3 shows rainfall erosivity (R) of the study area. This factor describes rain as an important contributor to erosion through its kinetic energy to the soil, which breaks down soil aggregates, and the process leads to surface runoff by eroding the soil through which the water flows . The value of rainfall erosivity ranges from 95.57 – 95.92 (MJ cm/ha h yr), and this was further classified into 95.57 - 95.65, 95.65 - 95.74, 95.74 - 95.83, and 95.83 - 95.92 (MJ cm/ha h yr). The implication of rain erosivity to soil erosion is that rain erosivity is directly proportional to soil loss; that is, the higher the R-factor, the higher the erosion, and vice versa. This corroborates , who stated high value of erosivity will have a major effect on the crushing power of soil aggregates and surface runoff; the higher the erosion value of rain, the stronger the ability of rainwater to destroy soil aggregates. Locations found within the highest range value of rain erosivity factor 95.83 - 95.92 (MJ cm/ha h yr) included Alagbede, Olakojo, Orisunbare, Idiosan, Lalupon, Arikuyeri, Akoka, Adeyipo, Kute-Kore, Akilapa, Akubo, Olorunda, and Wofu-Olodo, while Lagu was found within the lowest value of rain erosivity (95.57 - 95.65).
Figure 3. Rainfall Erosivity (R) of the Study area.
3.1.2. Soil Erodibility (K) Factor
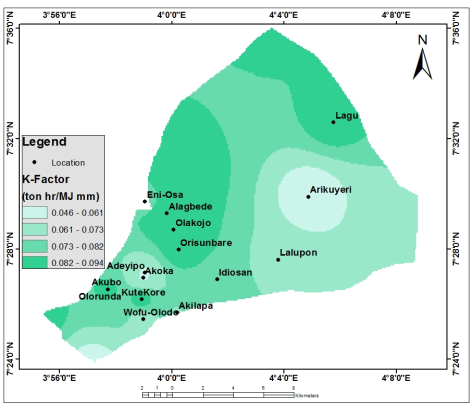
Soil erodibility in the study area is shown in Figure 4. Soil erodibility value shows the ability or resistance of soil particles to peeling and removal of soil due to the kinetic energy of rain . The soil erodibility value ranges from 0.046 – 0.094 (ton hr/ MJ mm), which was further classified into four classes: 0.046 - 0.061, 0.061 – 0.073, 0.073 – 0.082, and 0.082 – 0.094 (ton hr/ MJ mm). stated that soil erodibility implies that the higher the erodibility, the greater the ability of the soil to erode. Soil with high erodibility will be sensitive to erosion compared to low erodibility soil, which has strong resistance to erosion, and this is influenced by the soil texture of the area . It was observed in Figure 4 that locations found within the highest soil erodibility value included Eni-Osa, Alagbede, Olakojo, Lagu, Orisunbare, and Kute-Kore, while Arikuyeri, Akoka, and Adeyipo were found within the lowest soil erodibility.
Figure 4. Soil Erodibility (K) of the Study area.
3.1.3. Cover Management (C) Factor
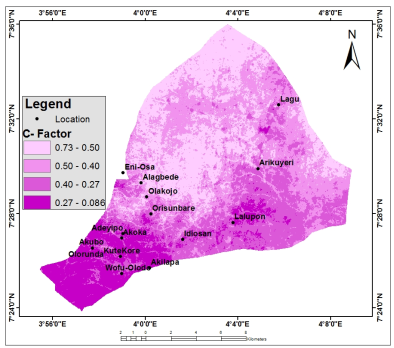
Figure 5 shows the cover management (C) in the study area. This ascertains how crucial vegetation is in the evaluation of erosion and the healthier the vegetation of the area. Healthy vegetation is very good at reducing the amount of rain crushing power; likewise, roots and stems of vegetation also help in binding soil and water, thereby reducing the rate of erosion . This was corroborated by , who stated that vegetation has a great influence on erosion because vegetation blocks rainwater from falling directly on the ground surface, and this reduces its ability to destroy the soil. The cover management practice value ranges from 0.086 to 0.73, and it was further classified into five classes, which included 0.087 to 0.27, 0.27 to 0.40, 0.40 to 0.50, and 0.50 to 0.73. The cover management practice indicates that the higher the value, the healthier the vegetation, but the lower the erosion, while the lower the value, the higher the erosion in the study area. Locations that were within the lowest cover management practice value (0.087 – 0.27), which connotes high erosion-prone locations, included Lalupon, Wofu-Olodo, Akilapa, Kute-Kore, Akubo, Olorunda, Lagu, Idiosan, and Adeyipo.
Figure 5. Cover and Management (C) of the Study area.
3.1.4. Topographic (LS) Factor
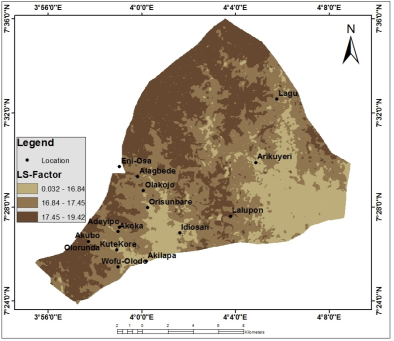
The slope length and slope steepness (LS) of the study area range from 0.032 to 19.42 (Figure 6). This was further classified into three classes, which included 0.032 to 16.84, 16.84 to 17.45, and 17.45 to 19.42. and acknowledged that the longer the slope, the more volume of soil that is carried away by runoff, and the steeper the slope, the faster the runoff transports the soil. This implies that the slope length and slope steepness (LS) are directly proportional to the soil loss in the study area. Locations such as Akubo and Lalupon were found within the highest value of the slope length and slope steepness (17.45 to 19.42), followed by Wofu-Olodo, Akoka, Adeyipo, Olakojo, Alagbede, Eni-Osa, and Lagu (16.84 to 17.45), while locations within the least value (0.032 to 16.84) included Arikuyeri, Idiosan, Orisunbare, and Kute-Kore.
Figure 6. Slope Length and Slope Steepness (LS) of the study area.
3.1.5. Support Practice (P) Factor
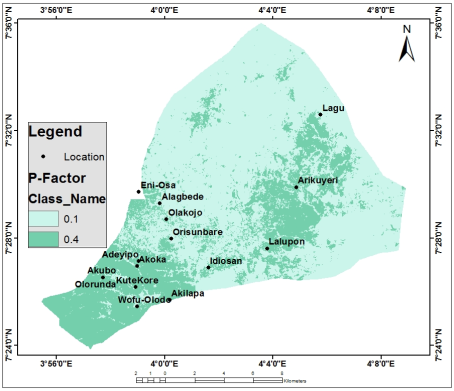
Figure 7 shows the spatial distribution of conservation support practice (P) on soil loss in the study area, which ranges between 0.1 and 0.4. The lower conservation support practice value represents the availability of higher conservation practice on the soil, while the higher values of conservation support practice represent lesser availability of conservation practice. According to Figure 7, it was observed that the lowest value was found within the vegetative zone, while the highest value was found within the settlement or built-up zone of the study area. This implies that the conservation support practice is directly proportional to the erosion occurrence in the environment.
Figure 7. Conservation or Protection Factor of the study area.
3.2. Soil Loss
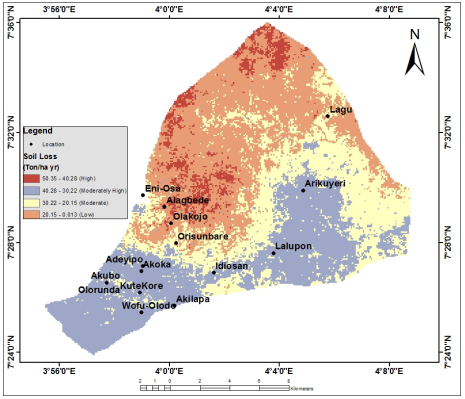
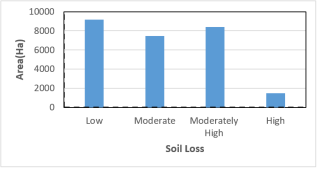
The soil loss of the study area was examined using the factors R, K, LS, C, and P, which were multiplied together in the GIS environment to quantify the level of soil loss in the area (Figures 8 and 9). It was observed that the soil loss value ranges from 0.013 to 50.35 (Ton/ ha yr) and was classified into four classes, such as 50.35 to 40.28 (High), 40.28 to 30.22 (Moderately High), 30.22 to 20.15 (Moderate) and 20.15 to 0.013 (Low). Among the classes, the low class of the soil loss had the highest percentage area coverage of 9167.3 Ha (34.6%), moderately high class with area coverage 8399.0 Ha (31.7%), moderate class with 7445.1 Ha (28.1%) area, while the least area coverage was the high class with 1483.8 Ha (5.6%) (Table 2). Locations found within the high soil loss zone included Adeyipo, Akoka, Akubo, Olorunda, Kute Kore, Wofu-Olodo, Akilapa, Idiosan, Lalupon and Arikuyeri, while location with low soil loss zone included Alagbede and Olakojo. It was also observed from the findings that the output of the soil loss of the study area was directly proportional to rainfall erosivity, soil erodibility, conservation practice, and slope length and slope steepness but indirectly proportional to cover management.
Figure 8. Soil Loss of the study area.
Table 2. Areas of Soil loss classes.

S/N

Erosion Risk Class

Soil loss classes (t ha-1 yr-1).

Area (%)

1

Low

0.013-20.15

34.6

2

Moderate

20.15-30.22

28.1

3

Moderately High

30.22-40.28

31.7

4

High

40.28 and above

5.6

Figure 9. Soil Loss in Hectares.
4. Conclusion
Soil loss in the study area was assessed using the Revised Universal Soil Loss Equation (RUSLE) integrated with Geographic Information Systems (GIS). The analysis incorporated key factors, including rainfall erosivity (R), soil erodibility (K), slope length and steepness (LS), cover management (C), and conservation practice (P). The estimated soil loss ranged from 0.013 to 50.35 t ha-1 yr-1 and was classified into four categories: very high (40.28–50.35 t ha-1 yr-1), moderately high (30.22 to 40.28 t ha-1 yr-1), moderate (20.15 to 30.22 t ha-1 yr-1), and low (0.013 to 20.15 t ha-1 yr-1). These classes cover 5.6%, 31.7%, 28.1%, and 34.6% of the study area, respectively. The findings highlight the spatial variability of soil erosion and emphasize the importance of targeted intervention in high-risk areas. To enhance erosion management, the integration of geospatial technologies into environmental monitoring and planning is recommended. Strengthening the capacity of environmental agencies through the inclusion of GIS expertise will improve the mapping of erosion-prone areas and support evidence-based decision-making. Additionally, the development of detailed soil loss and erosion risk maps can aid in the design and implementation of effective soil conservation strategies.
Abbreviations

ASTER DEM

Advanced Spaceborne Thermal Emission and Reflection Radiometer Digital Elevation Model

C

Cover and Management

GIS

Geographic Information Systems

K

Soil Erodibility

LS

Slope Length and Slope Steepness Factors

LULCC

Land Use and Land Cover Changes

NDVI

Normalized Difference Vegetation Index

NRI

Near-infrared

P

Conservation or Protection Factor

R

Rainfall and Runoff Factor

RUSLE

Revised Universal Soil Loss Equation

USLE

Universal Soil Loss Equation

Author Contributions
Adebayo Gbenga Ojo: Conceptualization, Project administration, Supervision, Writing–review & editing
Adamu Ismaila: Conceptualization, Investigation, Methodology, Writing–original draft
Olaniran Emmanuel Aluko: Conceptualization, Methodology, Writing–review & editing
Olakunle Rufus Oladosu: Resources, Supervision, Writing–review & editing
Seyi Festus Olatoyinbo: Resources, Supervision, Writing–review & editing
Abu Shuaibu: Data curation, Formal Analysis, Validation
Isaac Utenwojo Ocholi: Formal Analysis, Validation, Visualization
Oluwabunmi Fasote: Conceptualization, Methodology, Writing – review & editing
References
[1] Adekoya, A. E., Meludu, N. T. & Adeniyi, T. K. (2000). Urban Crop Production: A Case Study of Ibadan North Local Government Area, Oyo State. Journal of Agricultural Extension 4: 15-21.
[2] Bhan, S., & Behera, U. K. (2014). Conservation agriculture in India – Problems, prospects and policy issues. International Soil and Water Conservation Research, 2(4), 1-12.
[3] Belay, T., Mekonnen, M., & Tesfaye, K. (2024). Advances and limitations of soil erosion modelling using RUSLE in complex terrains. Environmental Modelling & Software, 172, 105789.
[4] Belayneh, M., Yirgu, T., & Tsegaye, D. (2019). Spatial analysis of soil erosion risk using RUSLE integrated with GIS in mountainous regions. Environmental Systems Research, 8(1), 1–14.
[5] Ben-Said, S., Al-Hamdan, O., & Cherif, I. (2025). Impacts of land use and land cover change on ecohydrological processes and ecosystem services. Science of the Total Environment, 912, 168945.
[6] Borrelli, P., Robinson, D. A., Fleischer, L. R., Lugato, E., Ballabio, C., Alewell, C., Meusburger, K., Modugno, S., Schütt, B., Ferro, V., Bagarello, V., Van Oost, K., Montanarella, L., & Panagos, P. (2021). An assessment of the global impact of 21st-century land use change on soil erosion. Nature Communications, 12, 1–13.
[7] El Jazouli A., Barakat A., Ghafiri A., El Moutaki S., Ettaqy A., Khellouk, R. (2017). Soil erosion modeled with USLE, GIS, and remote sensing: a case study of Ikkour watershed in Middle Atlas (Morocco) Geosci. Lett.; 4: 25.
[8] Farhan Y, Zreqat D, Farhan I (2013). Spatial estimation of soil erosion risk using RUSLE approach, RS, and GIS techniques: a case study of Kufranja watershed, northern Jordan. J Water Res Prot 5: 1247–1261.
[9] Gorelick, N., Hancher, M., Dixon, M., Ilyushchenko, S., Thau, D., & Moore, R. (2017). Google Earth Engine: Planetary-scale geospatial analysis for everyone. Remote Sensing of Environment, 202, 18–27.
[10] Haregeweyn, N., Tsunekawa, A., Tsubo, M., Meshesha, D. T., & Melkie, A. (2017). Analysis of soil erosion and sediment yield using RUSLE and GIS techniques. Land Degradation & Development, 28(6), 2133–2146.
[11] Hurni, H. (1985). Erosion–productivity–conservation systems in Ethiopia. Mountain Research and Development, 5(3), 199–206.
[12] Jensen, J. R. (2000) Remote sensing of the environment: an earth resource perspective. Prentice Hall, New Jersey.
[13] Kidane, M., Bezie, A., Kesete, N., & Tolessa, T. (2019). The impact of land use and land cover change on soil erosion and sediment yield in Ethiopia. International Soil and Water Conservation Research, 7(2), 111–122.
[14] Kim, Y. (2014). docplayer.net. Available from:
[15] Kunta, K. & Carosio, A. (2007) Effect of DEM resolution on soil erosion, production of RUSLE model with VBA calculation in ArcGIS. In: 11tth Annual National Symposium on Computational Science and Engineering, Phuket, Thailand.
[16] Lee, G. S. & Lee, K. H. (2006) Scaling effect for estimating soil loss in the RUSLE model using remotely sensed geospatial data in Korea. Hydrology and Earth System Sciences 3, 135-157.
[17] Lestari, A., & Simanjuntak, B. H. (2022). Evaluation of Erosion Potential and Determination of the Causes of Erosion Using a Geographic Information System, Journal Teknik Pertanian Lampung 11 (3): 466-482.
[18] Liu, J., Liu, W., & Zhu, K. (2018). Through fall kinetic energy and its spatial characteristic under rubber-based agroforestry system. Catena, 161, 113-121.
[19] May, L. & Place, C. J. (2005). A GIS-based model model of soil erosion and transport. Freshwater Forum 23, 48–61.
[20] Mekuriaw, A., & Amsalu, A. (2023). Linking land use dynamics with soil erosion risk for sustainable land management. Sustainability, 15(4), 3456.
[21] Moges, D. M., & Bhat, H. G. (2020). Integration of geospatial technologies for soil erosion assessment and sustainable land management. Environmental Monitoring and Assessment, 192, 1–15.
[22] Morgan, R. C. (1994) Soil Erosion and Conservation. Silsoe College, Cranfield University, UK.
[23] Morgan, R. P. C. & Rickson, R. J. (2005). Slope Stabilization and Erosion Control: A Biogenering Approach. Routledge (Taylor & Francis), London SE1 8HN. UK.
[24] Munandar, R., & Jayanti, D. S. (2016). Pemodelan Intersepsi Untuk Pendugaan Aliran Permukaan. Jurnal Ilmiah Teknologi Pertanian Agrotechno, 1(1), 62-69.
[25] Oyebande, B. L. and Oguntoyinbo, J. S. (1970). Analysis of rainfall patterns in the South-Western States of Nigeria. Nigeria Geogr. Journal, 13, 141-162.
[26] Oyawoye, M. O. (1967). Petrology of a potassic syenite and its associated biotite, pyroxenite at Shaki, Western Nigeria Contr. Min. Petrol, 16.115-138.
[27] Rahaman, M. A. O. (1972). Geological map of /lero Area at 1: 50,000 scale. Unpub!. Report. Dept. of Geology, University of Ibadan.
[28] Renard, K. G. & Friedmund, J. R. (1994) Using monthly precipitation data to estimate the R-factor in the RUSLE. Journal of Hydrology 157, 287-306.
[29] Renard, K. G., Foster, G. R., Weesies, G. A., McCool, D. K., & Yoder, D. C. (1997). Predicting soil erosion by water: A guide to conservation planning with the Revised Universal Soil Loss Equation (RUSLE). U.S. Department of Agriculture (USDA), Agriculture Handbook No. 703.
[30] Uddin, K., Murthy, M. R., Wahid, S. M. & Matin, M. A. (2016). Estimation of soil erosion dynamics in the Koshi Basin using GIS and remote sensing to assess priority areas for conservation. PLoS ONE 11 (3), 1-19.
[31] Van der Knijff, J. M., Jones, R. J. & Montanarella, L. (2000). Soil Erosion Assessment in Europe. European Commission Directorate General, Joint Research Centre, European Soil Bureau, pp. 1-34.
[32] Wischmeier, W. H, Smith, D. D (1978). Predicting Rainfall Erosion Losses: A Guide to Conservation Planning. United States Department of Agriculture, Washington, p. 58.
Cite This Article
  • APA Style

    Ojo, A. G., Ismaila, A., Aluko, O. E., Oladosu, O. R., Olatoyinbo, S. F., et al. (2026). Soil Erosion Asssessment Using the Rusle Model in Lagelu Local Government Area, Oyo State, Nigeria. Science Discovery Agriculture, 1(4), 160-171. https://doi.org/10.11648/j.sda.20260104.13

    Copy | Download

    ACS Style

    Ojo, A. G.; Ismaila, A.; Aluko, O. E.; Oladosu, O. R.; Olatoyinbo, S. F., et al. Soil Erosion Asssessment Using the Rusle Model in Lagelu Local Government Area, Oyo State, Nigeria. Sci. Discov. Agric. 2026, 1(4), 160-171. doi: 10.11648/j.sda.20260104.13

    Copy | Download

    AMA Style

    Ojo AG, Ismaila A, Aluko OE, Oladosu OR, Olatoyinbo SF, et al. Soil Erosion Asssessment Using the Rusle Model in Lagelu Local Government Area, Oyo State, Nigeria. Sci Discov Agric. 2026;1(4):160-171. doi: 10.11648/j.sda.20260104.13

    Copy | Download

  • @article{10.11648/j.sda.20260104.13,
      author = {Adebayo Gbenga Ojo and Adamu Ismaila and Olaniran Emmanuel Aluko and Olakunle Rufus Oladosu and Seyi Festus Olatoyinbo and Abu Shuaibu and Isaac Utenwojo Ocholi and Oluwabunmi Fasote},
      title = {Soil Erosion Asssessment Using the Rusle Model in Lagelu Local Government Area, Oyo State, Nigeria},
      journal = {Science Discovery Agriculture},
      volume = {1},
      number = {4},
      pages = {160-171},
      doi = {10.11648/j.sda.20260104.13},
      url = {https://doi.org/10.11648/j.sda.20260104.13},
      eprint = {https://article.sciencepublishinggroup.com/pdf/10.11648.j.sda.20260104.13},
      abstract = {Soil erosion is a major environmental challenge driven by rainfall, runoff, and unsustainable land-use practices, leading to land degradation, reduced agricultural productivity, and sedimentation of water bodies. This study integrates the Revised Universal Soil Loss Equation (RUSLE) with Geographic Information Systems (GIS) to quantify and spatially map soil erosion risk in Lagelu Local Government Area, Oyo State, Nigeria. RUSLE model parameters were derived as follows: rainfall erosivity (R) from rainfall data; soil erodibility (K) from soil maps and laboratory analysis; slope length and steepness (LS) from a digital elevation model; and cover management (C) and conservation practice (P) from land use/land cover and the Normalized Difference Vegetation Index (NDVI) derived from satellite imagery. These factors were combined to estimate annual soil loss. Soil loss ranged from 0.013 to 50.35 t ha-1 yr-1 and was classified into four categories: very high (40.28–50.35 t ha-1 yr-1), moderately high (30.22–40.28 t ha-1 yr-1), moderate (20.15–30.22 t ha-1 yr-1), and low (0.013–20.15 t ha-1 yr-1), covering 5.6%, 31.7%, 28.1%, and 34.6% of the study area, respectively. The results indicate pronounced spatial variability, with most areas falling within low- to moderate-erosion-risk classes. The integration of RUSLE and GIS effectively identified erosion hotspots and generated erosion risk maps, providing a robust basis for land-use planning, agricultural management, and targeted soil conservation interventions.},
     year = {2026}
    }
    

    Copy | Download

  • TY  - JOUR
    T1  - Soil Erosion Asssessment Using the Rusle Model in Lagelu Local Government Area, Oyo State, Nigeria
    AU  - Adebayo Gbenga Ojo
    AU  - Adamu Ismaila
    AU  - Olaniran Emmanuel Aluko
    AU  - Olakunle Rufus Oladosu
    AU  - Seyi Festus Olatoyinbo
    AU  - Abu Shuaibu
    AU  - Isaac Utenwojo Ocholi
    AU  - Oluwabunmi Fasote
    Y1  - 2026/11/06
    PY  - 2026
    N1  - https://doi.org/10.11648/j.sda.20260104.13
    DO  - 10.11648/j.sda.20260104.13
    T2  - Science Discovery Agriculture
    JF  - Science Discovery Agriculture
    JO  - Science Discovery Agriculture
    SP  - 160
    EP  - 171
    PB  - Science Publishing Group
    SN  - 3142-8495
    UR  - https://doi.org/10.11648/j.sda.20260104.13
    AB  - Soil erosion is a major environmental challenge driven by rainfall, runoff, and unsustainable land-use practices, leading to land degradation, reduced agricultural productivity, and sedimentation of water bodies. This study integrates the Revised Universal Soil Loss Equation (RUSLE) with Geographic Information Systems (GIS) to quantify and spatially map soil erosion risk in Lagelu Local Government Area, Oyo State, Nigeria. RUSLE model parameters were derived as follows: rainfall erosivity (R) from rainfall data; soil erodibility (K) from soil maps and laboratory analysis; slope length and steepness (LS) from a digital elevation model; and cover management (C) and conservation practice (P) from land use/land cover and the Normalized Difference Vegetation Index (NDVI) derived from satellite imagery. These factors were combined to estimate annual soil loss. Soil loss ranged from 0.013 to 50.35 t ha-1 yr-1 and was classified into four categories: very high (40.28–50.35 t ha-1 yr-1), moderately high (30.22–40.28 t ha-1 yr-1), moderate (20.15–30.22 t ha-1 yr-1), and low (0.013–20.15 t ha-1 yr-1), covering 5.6%, 31.7%, 28.1%, and 34.6% of the study area, respectively. The results indicate pronounced spatial variability, with most areas falling within low- to moderate-erosion-risk classes. The integration of RUSLE and GIS effectively identified erosion hotspots and generated erosion risk maps, providing a robust basis for land-use planning, agricultural management, and targeted soil conservation interventions.
    VL  - 1
    IS  - 4
    ER  - 

    Copy | Download

Author Information
  • United Nations-African Regional Centre for Space Science and Technology Education – English, Obafemi Awolowo University, Ile-Ife, Nigeria
  • Centre for Space Life Sciences (CSLS), University of Ibadan, Ibadan, Nigeria

  • United Nations-African Regional Centre for Space Science and Technology Education – English, Obafemi Awolowo University, Ile-Ife, Nigeria

  • Centre for Space Life Sciences (CSLS), University of Ibadan, Ibadan, Nigeria

  • National Space Research and Development Agency, Abuja, Nigeria

  • Centre for Space Life Sciences (CSLS), University of Ibadan, Ibadan, Nigeria

  • Department of Geography, Kogi State University, Anyigba, Nigeria

  • United Nations-African Regional Centre for Space Science and Technology Education – English, Obafemi Awolowo University, Ile-Ife, Nigeria