Research Article | | Peer-Reviewed

Assessment of Water Demand and Water Quality Status in Eastern Obolo Local Government Area, Nigeria

Received: 13 November 2025     Accepted: 9 February 2026     Published: 4 March 2026
Views:       Downloads:
Abstract

Access to safe drinking water remains a huge challenge in developing regions, especially those facing population growth and industrial activities. The present study carried out an assessment of water demand and determined the physicochemical quality of major domestic water sources in 22 accessible communities of Eastern Obolo, a coastal area of Akwa Ibom State, Nigeria. The population projection indicated 59,970 persons in 2006 and 107,627, respectively, and thus increased the total water demand from 29.99 million L/day to 53.81 million L/day. Water samples from both surface and groundwater were collected and analyzed using standard ASTM and WHO procedures. Findings revealed widespread deterioration of water quality. pH, salinity, turbidity, TSS, TDS, and electrical conductivity frequently exceeded NSDWQ limits. Coastal communities exhibited high salinity, TDS, and EC due to seawater intrusion, while nitrate concentrations (69–72.5 mg/L) in agricultural areas were far above the EPA limit of 10 mg/L, reflecting fertilizer runoff. Sulfate levels reached 1200.5 mg/L in oil-producing areas. Heavy metals—including iron (0.21–0.72 mg/L), manganese (up to 0.44 mg/L), copper (up to 3.48 mg/L), and zinc (up to 5.76 mg/L)—also exceeded NSDWQ standards, linked to abandoned oil and gas facilities. Overall, the research indicates that most water sources are not safe for consumption without treatment in Eastern Obolo. In fact, the combined impacts of seawater intrusion, agricultural runoff, and petroleum-related contamination bring into focus the pressing demand for targeted purification and decentralized treatment solutions.

Published in Science Discovery Environment (Volume 1, Issue 1)
DOI 10.11648/j.sdenv.20260101.19
Page(s) 98-109
Creative Commons

This is an Open Access article, distributed under the terms of the Creative Commons Attribution 4.0 International License (http://creativecommons.org/licenses/by/4.0/), which permits unrestricted use, distribution and reproduction in any medium or format, provided the original work is properly cited.

Copyright

Copyright © The Author(s), 2026. Published by Science Publishing Group

Keywords

Water Demand, Water Quality, Eastern Obolo, Seawater Intrusion, Agricultural Runoff, Petroleum Pollution

1. Introduction
Water is known to be an essential component of the metabolic activities of living things. Studies reveal that the human body contains over 70% water . As such, the provision of quality and adequate water is a key feature of good governance at the global level. The World Health Organization (WHO) has set guidelines for drinking water quality with physical, chemical, and microbial parameters. These guidelines specify safety levels for different categories of contaminants. Many countries and territories have also developed their own guidelines based on their unique social, cultural, economic, and environmental situations. In Nigeria, the Nigerian Standard for Drinking Water Quality (NSDWQ) is responsible for developing the national standards for safe drinking water .
Rapid industrialization, agricultural intensification, and expanding human settlements are continuing to put immense pressure on water supplies, particularly in developing areas with limited regulatory frameworks and water treatment infrastructure. Due to this trend, most rural communities depend on groundwater and surface water supplies that are increasingly susceptible to contamination by nitrate, sulfate, iron, zinc, copper, and manganese. Nitrate contamination is more common because of over-fertilization, sewage leakage, and poor animal husbandry practices . Concentrations exceeding the WHO guideline value of 50 mg/L pose a serious health threat, especially to infants, due to methemoglobinemia a condition often referred to as "blue baby syndrome"-experienced from nitrite-caused impairment of oxygen transport capabilities . Long-term exposure to nitrates has also been associated with thyroid disruption and increased risks of various gastrointestinal cancers among adults . Sulfate contamination, derived from mineral dissolution, industrial discharges, and wastewater intrusions, and may also cause diarrhea, dehydration, and gastrointestinal irritation, particularly among sensitive subgroups of populations .
Naturally occurring metals like iron and manganese give rise to aesthetic and health hazards when they exceed recommended limits. High concentrations of iron result in discoloration, metallic taste, and staining; this often forces households to use other water sources. High manganese levels have been associated with neurotoxicity, cognitive deficits in children, and motor dysfunction. Zinc and copper are essential micronutrients, but they also become deleterious when their concentrations are excessively high . High intake of zinc may cause nausea and vomiting and interfere with the absorption of copper, leading to anemia and immune suppression . High copper exposure has been associated with gastrointestinal distress, liver damage, and complications in people suffering from Wilson’s Disease. Given the high dependence on shallow groundwater and unprotected surface waters in places like Eastern Obolo Local Government Area, defining the concentration profiles and health implications of these pollutants is crucial to informing local water management strategies. This study therefore assesses the levels of nitrate, sulfate, iron, zinc, copper, and manganese across twenty-eight villages in Eastern Obolo and evaluates their potential health risks relative to established drinking-water standards.
The population of Eastern Obolo has been on a steady rise, propelled by the growth of industrial activities, which has in turn increased the demand for potable drinking water. However, the activities of numerous industries, such as oil and gas, Agricultural industries, have undermined the quality of water in the region. In Nigeria, urban areas have water projects while rural towns, where most of these industries are situated, depend to a large extent on surface water for their supply. It is thus necessary to determine the sources of domestic water in these areas, make a comprehensive analysis of the quality of the water that can guide water management policies .
2. Materials and Method
This research utilized various laboratory equipment, such as Water analyzer, pH meter, conductivity meter, dissolved oxygen (DO) meters, sample bottles, thermometer, UV spectrometer, hydrometer, sieve, furnace, beakers, desiccators, crucibles, filter paper (Whitman's filter paper), burette, water bath, measuring cylinders, magnetic stirrer, tray dryer, and weighing balance. The following laboratory reagents were used in the research; Merck KGaA. (Germany). Analytical Grade Nitric Acid (69%), BDH Chemicals. Barium Chloride Dihydrate (BaCl₂·2H₂O), Merck KGaA, Anhydrous Sodium Sulphate (Na₂SO₄) for Standard Preparation, Potassium Nitrate (KNO₃, ≥99% purity, Sigma-Aldrich).
2.1. Study Area
Eastern Obolo is a local government area which is coastal in Akwa Ibom State; it is bordered on the west by Ikot Abasi, on the north by Mkpat Enin, on the east by Ibeno, and on the south by the Atlantic Ocean as shown in Figure 1. It has a total area of 117,008 square kilometers and is located between longitudes 7°35' and 7°50' E and latitudes 4°29' and 4°35' N. In 2016, Eastern Obolo produced about 40% of the total crude oil found in Akwa Ibom State . The location consists of twenty-eight villages officially cataloged by the Akwa Ibom State government and are titled Akpabom, Ama Ngbuoji, Ama Nguasi, Amadaka, Atabrikang, Ayama, Bethlehem, Elekpon, Elile Emere Oke I, Emere Oke II, Emeremem Eqwennwe, Iko, Ikonta, Iworfe, Kampa, Obionga, Okoro Inyong, Okorobilom, Okoroete, Okoroiti, Okorombakho, Okoromobolo, Okwon Obolo, Otuwene, Ozugbo, and Umauka.
Source:

Download: Download full-size image

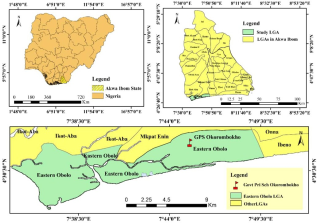
Figure 1. Map of Eastern Obolo Akwa Ibom State.
2.2. Water Demand of the Study Area
The determination of water demand for each residence in the area under study was estimated using national population censuses conducted in 1991 and 2006. The data presented in Table 1 was utilized with the geometric growth method to yield the current population of the study area . Crouch Estimated a per capita daily water use of 175 liters, which was within the range stipulated by the World Health Organization (WHO) as recommended value, 50 to 200 liters per day, for domestic consumption.
The calculations of the population estimate of the study area and the water demand was calculated using equation (1) as adopted from the study of .
Qavg=PT×175LPD(1)
Where:
Qavg- Average daily water demand (L/day)
PT- Projected population
175 LPD - Per capita water demand (L/person/day)
1) Design consideration and Assumptions
2) The population for the study area in 2006 was taken from demographic records, which reported 59,970 people.
3) Water Demand Allocation: The study assumes 35% of the total water demand is allocated to domestic consumption, and the remaining 65% is allocated to industrial and agricultural sectors.
2.2.1. Domestic Water Consumption (DWC)
Domestic water consumption was estimated by multiplying the population by the average per capita consumption of water. In this study, the average per capita water consumption of 175 liters per day (LPD) was used
Equation (2) was used to calculate domestic water consumption
DWC=PT2006×175LPD(2)
Where,
DWC - Domestic water consumption (L/day)
PT2003 - Population in year 2006 (persons)
2.2.2. Total Water Demand 2006
The total water demand was calculated using the relationship between domestic water consumption and the total water demand. 35% of the total water demand was attributed to domestic consumption . This relationship is expressed in equation (3)
Qav,2006=DWC%DWC(3)
Where:
Qav,2006-Total average water demand in 2006 (L/day)
DWC- Domestic water consumption (L/day)
%DWC- Proportion of domestic water consumption in total demand (here, 0.35)
2.2.3. Industrial and Agricultural Water Demand (DAI) in 2006
The industrial and Agricultural water demand (DAI) was calculated. According to the design assumption, 65% of the total water demand is allocated to industrial and agricultural purposes. Equation (4) was used to calculate the industrial and agricultural water
DAI2006=0.65×Qav2006(4)
Where,
DAI2006- Industrial and agricultural water demand in 2006 (L/day)
Qav2003- Total average water demand in 2006 (L/day)
0.65 - Fraction of total demand allocated to industrial and agricultural use (65%)
2.2.4. Projected population in 2025
Method of population projection was applied to estimate the population of the study area. The projected population was calculated using the compound growth formula equation (5) as highlighted by .
PT=PO(1+AGR)n(5)
Where:
PT- Projected population after nth years (persons)
PO- Base year population (persons)
AGR- Annual growth rate
n- Number of years between base year and design year
2.2.5. Projected Domestic Water Consumption (DWC2025)
The domestic water consumption for the year 2025 was calculated by multiplying the projected population by the per capita water consumption (175 LPD)
DWC2025=PT2025×175LPD(6)
Where,
DWC2025- Domestic water consumption in 2025 (L/day)
2.2.6. Projected Average Water Demand for 2025 (Q2025)
To determine the total water demand in 2025, we use the same relationship between domestic water consumption and the total water demand as in the previous calculations. Since 35% of the total water demand is allocated to domestic consumption, the total demand was calculated using equation (7)
Qav,2025=DWC2025%DWC(7)
Where,
Qav, 2025- Total average water demand in 2025 (L/day)
2.2.7. Projected Industrial and Agricultural Water Demand (DAI2025)
The industrial and agricultural water demand in 2025 is
DAI2025=0.65×Qav2025(8)
DAI2025- Industrial and agricultural water demand in 2025 (L/day)
Qav2025- Total average water demand in 2025 (L/day)
2.2.8. Water Quality Assessment of the Study Area
Water samples from various sources were collected from major water sources of the twenty-eight villages that makes up eastern Obolo; however, not all the communities in the Eastern Obolo local government area have underground water resources. Additionally, some of the villages share boundary disputes with adjoining local government areas, and this interfered with the sample collection process. Samples were collected from accessible villages and their mean values determined and recorded. It was noted during sampling that most of the locals depend on surface water to meet their daily water need.
2.3. Sample Collection and Sampling Method
Samples were collected in 22 out of 28 villages that makes up the Eastern Obolo local government area due to communal crisis in six villages. Samples were collected using sterilized 4-liter plastic containers. To prevent biological degradation and changes in water quality, the samples was immediately stored in ice-packed coolers (at ~4°C) and transported to the laboratory within 2 hours of collection.
Table 1. Sampling location and sources of water sampled.

S/N

Village

Major source of water

GPS Location

1

Akpabom

Surface water

007o 51'54''E (long) 04o 74'92'' N (lat)

2

Ama Ngbuoji

NA

NA

3

Ama Nguasi

NA

NA

4

Amadaka

Ground water

007o69'80.5''E(long) 04o 34'16''N(lat)

5

Atabrikang

Ground water

007o75’65.4”E (long.) 04o 49’70.6”N (lat.)

6

Ayama

Ground water

007o70'44.7''E (long) 04o 33.44''N(lat)

7

Bethlehem

NA

NA

8

Elekpon

surface water

007o72' 15.7''E(long) 04o 30' 63.4''N (Lat)

9

Elile

Ground water

007o71'11.07''E(long) 04o 34.20''N (lat)

10

Emere Oke I

Surface water

007o68'83''E(long) 04o 30' 78''N(lat)

11

Emere Oke II

Surface water

007o66'56''E(long) 04o 35'68''N(lat)

12

Emeremem

Surface water

007o 51'50''(long) 04o 73'20'' N(lat)

13

Eqwennwe

Surface water

007o 47'00''E(long) 04o 73'80'' N (lat)

14

Iko

Ground water

007o74’86.6”E(long) 04o 46’ 83.8”N(lat)

15

Ikonta

Surface water

007o42'00''E(long) 04o74'90'' N(lat)

16

Iworfe

Surface water

007o 32' 36.3''E(long) 04o 32'16.8''N(lat)

17

Kampa

Ground Water

007o42' 20''E (long) 04o73'90 N (lat)

18

Obionga

Ground Water

007o31'34.31''E(long) 04o28'0.60''N(lat)

19

Okoro inyong

Surface water

007o 48'50'' E(long) 04o 73'40''N(lat)

20

Okorobilom

NA

NA

21

Okoroete

Ground water

007o 74’80.7”E (long.) 04o 48’ 47.2”N (lat.)

22

Okoroiti

Ground water

007o75'86''E(long) 04o 50'67''N(lat)

23

Okorombakho

Ground water

007o75’65.4”E (long.) 04o 47’89.6”N (lat.)

24

Okoromobolo

Surface water

007o50'50''E(long) 04o73'10'' N(lat)

25

Okwon Obolo

Surface water

007o45'60''E (long) 04o74'20''N(lat)

26

Otuwene

Surface water

007o 68' 49.5''E(long) 04o 30'80.4''N (lat)

27

Ozugbo

NA

NA

28

Umauka

NA

NA

2.4. Determination of Physico-Chemical Properties
Water samples of 500 mL were collected from each sampling location (find GPS location in table1) into pre-washed polyethylene bottles and transported to the laboratory for analysis.
2.4.1. Onsite Analysis
Onsite measurements of electrical conductivity (EC), pH, dissolved oxygen (DO), colour, total dissolved solids (TDS), and temperature were conducted using a calibrated high-precision water quality analyser (Model H13453). All field parameters were determined in accordance with relevant American Society for Testing and Materials (ASTM) protocols, including ASTM D1125 for electrical conductivity, ASTM D1293 for pH, ASTM D888 for dissolved oxygen, and ASTM D1888 for colour, ensuring standardisation and analytical reliability.
2.4.2. Offsite Analysis
All the samples collected were analyzed in Akwa-Ibom state university unit operations laboratory to determine other of water quality, including the levels of heavy metal contamination and biological contaminants.
2.4.3. Nitrate Concentration
Nitrate concentration was analyzed using the UV–Visible spectrophotometric method in accordance with APHA Standard Methods 4500-NO₃⁻ B (APHA, 2017). 50 mL aliquots were taken from each sample, Each 50 mL sample was filtered through a 0.45 µm membrane, and 10 mL of the filtrate was transferred into a quartz cuvette for absorbance measurement at 220 nm with correction at 275 nm. Calibration standards ranging from 0 to 10 mg/L were prepared from analytical-grade potassium nitrate (≥99% purity) obtained from Sigma-Aldrich.
2.4.4. Sulphate Concentration
Sulphate concentration was determined by the turbidimetric procedure according to APHA 4500-SO₄²⁻ E. In each analysis, 50 mL of water sample was transferred to a beaker and mixed with 1 mL of a conditioning reagent containing sodium chloride, glycerol, and hydrochloric acid. To create turbidity, 0.5 g barium chloride (BaCl₂·2H₂O) crystals from BDH Chemicals was then added to the solution and its absorbance measured at 420 nm. Standard sulphate solutions were prepared from anhydrous sodium sulphate (Na₂SO₄) from Merck.
2.4.5. Metal Concentration
The concentrations of iron, manganese, zinc, copper, lead, and chromium were determined by AAS according to ASTM D4691-16 and ASTM D1976-20. For heavy-metal analysis, 100 mL each of the samples was first digested by adding 5 mL of concentrated nitric acid (69%, Merck) and then heating the mixture at 95°C until the volume was reduced to about 20 mL. After cooling, the digests were filtered and diluted to a final volume of 50 mL using deionized water. Calibration standards (1–10 mg/L) for each metal were prepared from certified 1000 mg/L stock solutions supplied by Fisher Scientific. Metal concentrations were then quantified using the AAS at their characteristic wavelengths in accordance with instrument specifications and ASTM guidelines.
3. Results and Discussion
Table 2. Water Demand Projection of Eastern Obolo Local Government Area.

Design Results

2006

2025

Population (P)

59,970

107,627

Per Capita Water Consumption (175 LPD)

175 LPD

175 LPD

Domestic Water Consumption (DWC)

10,494,750 L/day

18,834,725 L/day

Percentage of Total Demand for Domestic Use (%DWC)

35%

35%

Total Water Demand (Qav)

29,985,000 L/day

53,813,500 L/day

Industrial/Agricultural Demand (DAI)

19,490,250 L/day

34,980,775 L/day

Design Results

2006

2025

Table 2 indicated that the projected population by 2025 is 107,627, approximately 79% more than the population in 2006 (59,970). The population growth was calculated on a 3.5% annual growth rate, which is standard in most developing countries, especially those experiencing urbanization and economic development. The population growth directly affects the demand for water, specifically for domestic use, because the increased population will have to be provided with water for drinking and other domestic use .
Population growth, as argued by Arsiso is one of the major causes of water demand, and rapid growth in the developing world has a tendency to lead to rising pressure on existing water resources and infrastructure. As the population increases, the total water demand also increases proportionally, which places higher demands on water supply systems that require wise water resources management and infrastructure planning.
3.1. Total Water Demand of Eastern Obolo
Total demand for water is estimated to increase significantly from 29,985,000 L/day in 2006 to 53,813,500 L/day in 2025. This increase is due to both the growth in population and the need to meet industrial and agricultural sector demands, which typically consume more water resources than domestic use, especially in developing regions where agriculture plays a significant role in the economy .
Industrial and agricultural water use has been estimated to grow from 19,490,250 L/day in 2006 to 34,980,775 L/day in 2025, reflecting the growth of water demand in these sectors. Agriculture in most developing countries accounts for 70-80% of the total use of water, while industrial use adds significantly, mostly in the rapidly developing nations .
3.2. Water Quality
3.2.1. Temperature and Color
Water samples were of different colors within the study area. In upland communities, water was cloudy, while in coastal communities like Kampa and Elile, the samples were clearer and whitish. All samples, after 24 hours at room temperature, developed a brownish-red discoloration; this effect was less pronounced in coastal samples, due to the replenishing and diffusive influence on the water table as reported by .
Among the samples analyzed for appearance, only Atabrikan, Kampa, and Elile met the requirements for clear appearance as prescribed in NSDWQ. Samples were not in compliance with the standard from Okoroete, Okorombokho, and Iko, especially after 24 hours, required to undergo further treatment.
Water temperature as shown in Figure 2 ranged between 25.7°C and 28.7°C with a mean of 26.87°C. the water temperature pattern was attributed to the dry-season sampling and afternoon solar heating effect .
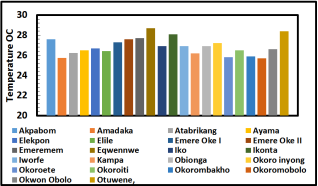
Figure 2. Temperature of Water Samples.
3.2.2. pH
General, the pH value ranged between 6.17 and 8.1, which communities like AKpabom, Atabrikan, Iko are below the limits of 6.5 – 8.5 set by NSDWQ, and therefore requires better control to improve the quality of the water. Relatively high pH values in the coastal communities are a reflection of seawater intrusion, similar to what was reported by Shaker and Askri , which results from mixing between saline and freshwater bodies. This agrees with Olufemi , who documented that freshwater–seawater interaction disrupts the equilibrium of carbonate.
The low pH value observed at Iko Town could be a result of microbial release of CO₂ and carbonic acid as suggested by Köhler . Acidic surface waters in Otuene, Okoromobolo, and Ikonta reflect localized anthropogenic impacts such as runoff and pollution, supporting the findings of Zhang . Overall, this spatial pH pattern illustrates the combined influence of seawater intrusion and human activities on the chemistry of water sources.
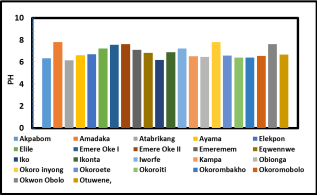
Figure 3. pH Levels of Water Samples.
3.2.3. Salinity
Salinity was quite high throughout the study area, a range from 0.16 in Amadaka to 0.42 in Elekpon. However, while the NSDWQ has not been able to provide a limiting value for salinity, there is emphasis on constituent ions such as Na⁺ and Ca²⁺, hence the need to determine them for acceptable drinking water. Besides proximity to the Atlantic Ocean, localized environmental conditions may also explain variability in salinity.
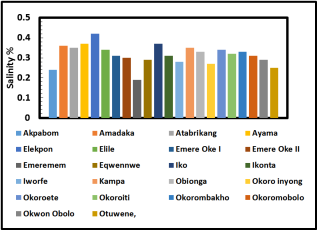
Figure 4. Salinity Levels of Water Sample.
3.2.4. Turbidity and Suspended Solid
Turbidity and total suspended solids (TSS) contents of the water samples analyzed during this work were extremely high and beyond the tolerable limits of the Nigerian Standard for Drinking Water Quality (NSDWQ) of 5 NTU for turbidity and 35 mg/L for TSS as shown in Figure 4 and Figure 5 respectively. The highest turbidity and TSS values in the groundwater were recorded in Iko Town at 8.01 NTU and 96.12 mg/L, respectively. In comparison to Akpabom Town, it had more impressive values for surface water with turbidity 8.92 NTU and TSS 99.73 mg/L.
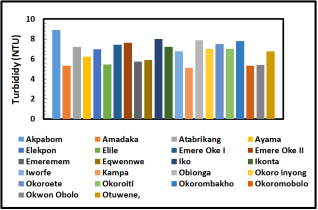
Figure 5. Turbidity Levels of Water Samples.
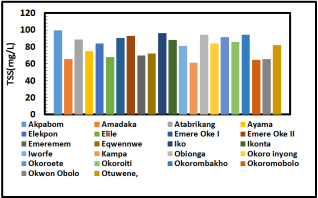
Figure 6. Total Suspended Solid of Water Samples.
Figure 4 shows the high TSS and turbidity in Iko Town can be traced back to the significant impact of oil exploration activity in the area. The drawdown impact of oil production perturbing the aquifer stability and equating to higher sedimentation rates. This result is consistent with that of Tochukwu where it was noted that the locality is prone to a sand-dominated aquifer very susceptible to silt formation. As highlighted by Ogbeibu , in the absence of thorough investigation of directional flow prior to borehole drilling, the danger of higher turbidity and sediment load can be heightened. The findings also indicate that turbidity and TSS of surface water were always higher compared to groundwater. All this inconsistency is, to a large degree, brought about by human activities, including washing clothes, bathing, and swimming, which add excessive sediments and pollutants into water bodies near the surface. Higher turbidity levels are also contributed by natural factors like soil erosion and microbial activity.
3.2.5. Total Dissolved Solids
Total Dissolved Solids for the various groundwater sources within the catchment were high, with the value from Iko Town reading 568.14 mg/l, due perhaps to its proximity to the Gulf of Guinea. High TDS demonstrates that there are higher levels of dissolved salts and minerals, which may pose detrimental impacts on water quality . In contrast, communities largely dependent upon surface water generally showed less TDS, except Elekpon, whose level remarkably reached 630.66 mg/l, demonstrating a high influence of seawater intrusion and diffusion of salt into local aquifers. These findings have reinforced evidence that coastal freshwaters are highly vulnerable to saline encroachment, a process known to compromise aquifer sustainability .
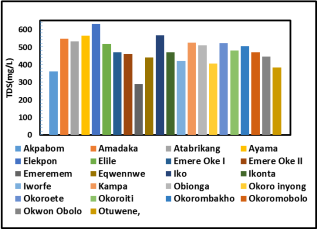
Figure 7. Total Dissolved Solid of Water Samples.
3.2.6. Electrical Conductivity
Electrical conductivity also followed the trend in salinity, with the highest values recorded in Elekpon (315.45 µS/cm) and the lowest values in Otuwene (200.11 µS/cm). Increased EC, especially in the coastal waters, indicates higher ion concentrations that pose a threat to aquatic ecological balance, thus supporting Biplab claims of such phenomena. Increased temperature due to climate change will result in increased evaporation and salt concentration, leading to strained EC levels, hence stressing freshwater ecosystems .
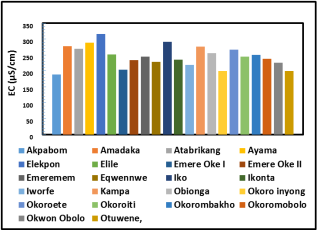
Figure 8. Electrical Conductivity of Water Samples.
3.2.7. Biological Oxygen Demand (BOD)
Values of DO were significantly higher in surface waters than in groundwater; the highest values were observed in Ikonta Town, 11.71 mg/L, and Otuwene, 11.00 mg/L. This pattern is consistent with increased turbulence and atmospheric mixing in flowing water bodies, as well as photosynthetic oxygen production by submerged aquatic plants and algae, in agreement with Griggs . Lower values were observed in groundwater samples because of its limited atmospheric contact and slow circulation, a condition that might affect subsurface biota, according to Li . The dynamic behavior of TDS, EC, and DO reflects the combined impacts of seawater intrusion, climate-related processes, and hydrological conditions on regional water quality.
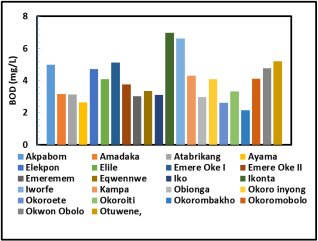
Figure 9. Biological Oxygen Demand of Water Samples.
3.2.8. Nitrates and Sulphate Concentrations
The nitrate levels in some communities, namely Amadaka, Okoroete, and Elile, were between 69.01 and 72.50 mg/L, which is way above the limit set by the EPA at 10 mg/L. These rates indicated high agricultural contributions. Nitrogen-based fertilizers are used round the large St. Gabriel coconut plantation, leading to runoffs and leaching into the nearby water body. This agrees with Srivastava , who document nitrate contamination in areas of intense farming.
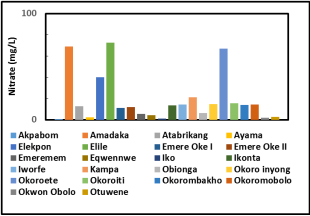
Figure 10. Nitrate Concentration of Water Samples.
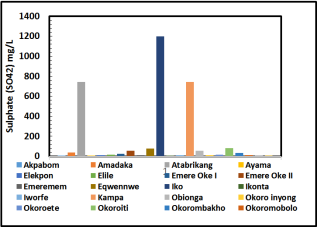
Figure 11. Sulphate Concentration of Water Samples.
The concentration of sulfate was also high, with a maximum value of 1200.5 mg/L in the Iko area, which exceeded the permissible limit of 100mg/L set by NSDWQ in some areas. These high values arise from petroleum-related activities which disturb sulfate-containing minerals and release the sulfate ions into nearby waters through drainage and wastewater routes. This trend agrees with earlier studies in oil-producing regions, as reported by Niaz .
3.2.9. Heavy and Trace Metals
Table 3. Heavy Metal Contamination of Water Samples in the Study Area.

S/N

Village

Iron (Fe2+) mg/L

Manganese (mg/L)

Copper (Cu2+) mg/L

Zinc (Zn)

1

Akpabom

0.13

0.24

0.001

1.08

2

Amadaka

0.36

1.19

1.18

1.22

3

Atabrikang

0.26

0.29

2.2

1.57

4

Ayama

0.44

0.22

0.91

2.5

5

Elekpon

0.35

0.01

0.84

0.95

6

Elile

0.3

0.34

0.99

1.21

7

Emere Oke I

0.14

0.02

0.76

0.1

8

Emere Oke II

0.28

0.019

1.05

0.06

9

Emeremem

0.11

0.17

0.06

1.06

10

Eqwennwe

0.21

0.19

0.01

0.04

11

Iko

0.72

0.2

2.01

2.05

12

Ikonta

0.16

0.21

0.25

0.02

13

Iworfe

0.28

0.03

0.23

1.2

14

Kampa

0.21

0.19

0.92

2.17

15

Obionga

0.43

0.2

1.3

3.1

16

Okoro inyong

0.29

0.05

1.02

5.76

17

Okoroete

0.56

0.32

2.35

1.73

18

Okoroiti

0.21

0.44

3.48

4.01

19

Okorombakho

0.6

0.26

1

3.45

20

Okoromobolo

0.3

0.3

0.6

1.46

21

Okwon Obolo

0.32

0.11

0.01

1.2

22

Otuwene

0.14

0.19

0.01

1.25

Metal analyses showed multiple exceedances of the NSDWQ limits, including iron (0.21-0.72 mg/L), manganese (up to 0.44 mg/L), copper (up to 3.48 mg/L), and zinc (1.2-5.76 mg/L), which are all linked to abandoned oil and gas infrastructure in Iko. These contaminants have serious health implications. For instance, high iron levels may cause aesthetic and long-term health impacts . Elevated manganese levels generate neurological concerns , while contamination of copper could lead to gastrointestinal and organ toxicity . Excessive levels of zinc can induce respiratory and digestive complications . The result agrees with Sankhla , showing evidence for increased risks among more sensitive populations, such as children and people with predisposed health conditions .
4. Conclusions
Water demand analysis was conducted which indicated an 80% population increase in the study area between 2003 and 2023, with an enormous rise in domestic, industrial, and agricultural water needs. The water demand projection in 2023 amounted to 53.8 million liters per day, establishing the need for water infrastructure. The water quality of the 22 villages was found to be above NSDQW standard. Elevated physical, chemical, and biological contamination. Excessive turbidity, total suspended and dissolved solids, heavy metals (manganese, iron, copper, zinc), and excessive concentrations of nitrates and sulfates were prevalent in the majority of water sources, particularly in coastal and industrially polluted sites such as Iko, Okoroete, and Okorombokho. These disorders exceed Nigerian Standards for Drinking Water Quality (NSDWQ) and represent serious public health and environmental risks, especially to vulnerable groups.
Abbreviations

WHO

World Health Organization

NSDWQ

Nigerian Standard for Drinking Water Quality

DAI

Industrial and Agricultural water demand

Funding
This work is not supported by any external funding.
Author Contributions
Uzono Romokere Isotuk: Conceptualization, Methodology, Resources
Akpa, Jackson Gunorubon: Data curation, Supervision
Dagde, Kenneth Kekpugile: Formal Analysis, Investigation
Animia Wordu: Resources, Writing – review & editing
Conflicts of Interest
The authors declare no conflicts of interest.
References
[1] Lawrence E. A and Evan C. J (2018). Water Intake, Water Balance, and the Elusive Daily Water Requirement; Nutrients, 10(12), 1928.
[2] Ighalo, J. O., & Adeniyi, A. G. (2020). A comprehensive review of water quality monitoring and assessment in Nigeria. Chemosphere, 260, 127569.
[3] Adepoju Tunde Folorunsho, Uzono Romokere Isotuk, Akwayo Iniobong Job. (2016). Modelling and Optimization of the Removal of Congo-Red Dye from Waste Water Using Agricultural Waste. Journal of Chemical, Environmental and Biological Engineering, 1(1), 1-7. HYPERLINK "
[4] Fewtrell, L., Kay, D., Jones, F., Baker, A., & Mowat, A. (1996). Copper in drinking water — an investigation into possible health effects. Public Health, 110(3), 175-177.
[5] Ward, M. H., Jones, R. R., Brender, J. D., De Kok, T. M., Weyer, P. J., Nolan, B. T., Villanueva, C. M., & Van Breda, S. G. (2018). Drinking Water Nitrate and Human Health: An Updated Review. International journal of Environmental Research and Public Health, 15(7).
[6] Wang, L., Wang, Q., Li, W., Liu, Y., & Zhang, Q. (2025). A New Insight into Sulfate Contamination in Over-Exploited Groundwater Areas: Integrating Multivariate and Geostatistical Techniques. Water, 17(10), 1530.
[7] Teschke, R., & Xuan, T. D. (2025). Heavy Metals Like Aluminum, Arsenic, Cadmium, Chromium, Copper, Iron, Lead, Manganese, Mercury, Nickel, and Zinc Polluting the Drinking Water: Their Individual Health Hazards. International Journal of Molecular Sciences, 26(23), 11656.
[8] Plum, L. M., Rink, L., & Haase, H. (2010). The Essential Toxin: Impact of Zinc on Human Health. International Journal of Environmental Research and Public Health, 7(4), 1342-1365.
[9] Sunita S, Anil K, Preeti D and Daniel J (2025) Wilson’s disease: A Case Study, Societal Challenges and Environmental Influences on Diagnosis and Management; Nursing & Midwifery Research Journal 1-9 2025
[10] Emuedo, O. A, Anoliefo, G. O & Emuedo C. O (2014). Oil Pollution and Water Quality in the Niger Delta: Implications for the Sustainability of the Mangrove Ecosystem; Global Journal of Human-Social Science: B Geography, Geo-Sciences, And Environmental Disaster Management, 14(6); 8-16.
[11] Affiah, U.E., Iniemem, J. I., Moshood, N. T & Abasiama, O. I (2017) Groundwater Quality Assessment for Drinking Water using Water Quality Index (WQI): A Case Study of Eastern Obolo, Southeastern Nigeria. Journal of Environment and Earth Science 8(6); 12-17.
[12] Igbemi, A., Nwaogazie, L. I, Akaranta, O., Abu, G. O (2019). Water Quality Assessment by Pollution Indices in Eastern Obolo Coastline Communities of Nigeria; American Journal of Water Resources; (7) 3, 111-120.
[13] Abel, G. J., Bijak, J., Forster, J. J., Raymer, J., Smith, P. W., & Wong, J. S. (2013). Integrating uncertainty in time series population forecasts: An illustration using a simple projection model. Demographic Research, 29, 1187-1226.
[14] Raftery, A. E., Li, N., Ševčíková, H., Gerland, P., & Heilig, G. K. (2012). Bayesian probabilistic population projections for all countries. Proceedings of the National Academy of Sciences, 109(35), 13915-13921.
[15] Crouch, M. L., Jacobs, H. E., & Speight, V. L. (2021c). Defining domestic water consumption based on personal water use activities. Journal of Water Supply Research and Technology—AQUA.
[16] Ezugwu, C., Onyelowe, K., Ezugwu, C., Onyekweredike, K., Odumade, A., Omunakwe, O., Hussaini, M., Oloyede, A., & Innocent, W. (2021). Community Water Demand and Sustainable Water Supply Planning in Nigeria: a review. Jurnal Kejuruteraan, 33(3), 517-530.
[17] [ALI] Ali, A. H. (n.d.). Water supply engineering I: Water supply - Water consumption rate [Lecture notes]. Department of Environmental Engineering, University of Mustansiriyah.
[18] Dr, A. O. A. (2017.). Increasing population, urbanization and climatic factors in Lagos State, Nigeria: The nexus and implications on water demand and supply. DigitalCommons@Kennesaw State University.
[19] Arsiso, B. K., Tsidu, G. M., Stoffberg, G. H., & Tadesse, T. (2017). Climate change and population growth impacts on surface water supply and demand of Addis Ababa, Ethiopia. Climate Risk Management, 18, 21-33.
[20] Guo, Y., & Shen, Y. (2016). Agricultural water supply/demand changes under projected future climate change in the arid region of northwestern China. Journal of Hydrology, 540, 257-273.
[21] Viana, C. M., Freire, D., Abrantes, P., Rocha, J., & Pereira, P. (2021). Agricultural land systems importance for supporting food security and sustainable development goals: A systematic review. The Science of the Total Environment, 806, 150718.
[22] Ahmed, N., Mohammad, A., Knuteson, S. L., & Samara, F. (2025). Evaluating temporal changes in water quality due to urbanization: a multi-year observational study in Khalid Khor, Sharjah, UAE. Frontiers in Marine Science, 12, Article 1538897.
[23] Shaker, L.M., Al-Amiery, A.A., Hanoon, M.M. (2024). Examining the influence of thermal effects on solar cells: a comprehensive review. Sustainable Energy res. 11, 6.
[24] Askri, B., & Ahmed, A. T. (2014). Effects of shallow water table, salinity and frequency of irrigation water on the date palm water use. Journal of Hydrology, 513, 81-90.
[25] Olufemi, A. G. (2010). Assessment of groundwater quality and saline intrusions in coastal aquifers of Lagos metropolis, Nigeria. Journal of Water Resource and Protection, 2(10), 849-853.
[26] Köhler, S. J., & Stumpp, C. (2016). "Impact of carbonate dissolution on groundwater pH and nutrient dynamics." Hydrology and Earth System Sciences, 20(9), 3597-3610.
[27] Zhang, Y., & Chen, Z. (2015). "Microbial metabolism and groundwater chemistry: Impacts on pH and nutrient cycling." Journal of Contaminant Hydrology, 182, 19-30.
[28] Tochukwu, M. O., Okoro, E. I., & Okoro, C. I. (2018). Effect of anthropogenic activities on surface and ground water in Ogwuama community of Ahiazu, Imo State, Nigeria. Environmental Systems Research, 7(1), 1-10.
[29] Ogbeibu, A.E., Akpogheneta, S.E. & Zagi, M.M. (2020) the Effects of Crude Oil Production Activities on Surface and Groundwater Quality in Sapele, Delta State, Nigeria. Open Access Library Journal,
[30] Jimmy, G. N., Otu, A. A., & Asuquo, U. A. (2013). Preliminary Geophysical Investigation to Delineate the Groundwater Conductive Zones in the Coastal Region of Akwa Ibom State, Southern Nigeria, around the Gulf of Guinea. International Journal of Geosciences, 04(01), 108-115.
[31] Akpan, E.F., Akpan, V.M., Inyang, U.U (2020). Geoelectrical Investigation of Groundwater Quality through Estimates of Total Dissolved Solids and Electrical Conductivity in Parts of Akwa Ibom State, Southern Nigeria; Malaysian Journal of Geosciences (MJG) 4(1) 32-37.
[32] Biplab, S., Aznarul, I., Arijit, M. (2021). Seawater intrusion into groundwater and its impact on irrigation and agriculture: Evidence from the coastal region of West Bengal, India, Regional Studies in Marine Science, 44, 2352-4855.
[33] Adepoju Tunde Folorunsho, Akwayo Iniobong Job, Uzono Romokere Isotuk. (2016). Optimization of Biohydrogen Production (BHP) from Agro Waste Water (Cassava Waste Water): A Case of Box-Behnken Response Surface Methodology (RSM). International Journal of Energy and Environmental Science, 1(1), 13-18. HYPERLINK "
[34] Griggs, G., & Reguero, B. G. (2021). Coastal adaptation to climate change and Sea-Level rise. Water, 13(16), 2151.
[35] Li, H., Liu, L., Li, M., & Zhang, X. (2013). Effects of pH, temperature, dissolved oxygen, and flow rate on phosphorus release processes at the sediment and water interface in storm sewer. Journal of Analytical Methods in Chemistry, 2013, Article ID 104316.
[36] Srivastava, J. K., Chandra, H., Kalra, S. J. S., Mishra, P., Khan, H., & Yadav, P. (2016). Plant-microbe interaction in aquatic system and their role in the management of water quality: a review. Applied Water Science, 7(3), 1079-1090.
[37] Niaz, A., Kalsom, A., Sameen, A., Aslam, A., Saleem, I., Sattar, A., Naz, R., Qazi, M. A., Rasul, G., Nazir, Q., & Khan, M. S. A. (2022). Nitrate pollution of ground water and impacts of nitrogenous fertilizers and irrigation on dynamics of NO3-N movement in soils of Punjab, Pakistan. DOAJ (DOAJ: Directory of Open Access Journals).50(1), 39-54.
[38] Mamozai, W., Hesam, A. M., & Hemma, W. H. (2024). Impacts of crude oils on water Quality: A Comprehensive review. European Journal of Theoretical and Applied Sciences, 2(1), 126-138.
[39] Rahman, I., Wahab, M. A., Akter, M., & Mahanta, T. R. (2024). Iron in Drinking Water and its Impact on Human Health -A Study in Selected Units of Jalalabad Cantonment. Bangladesh Armed Forces Medical Journal. 56(2), 58-64.
[40] Iyare, P. (2019). The effects of manganese exposure from drinking water on school-age children: A systematic review. NeuroToxicology, 73, 1-7.
[41] Li J, Cao D, Huang Y, Chen B, Chen Z, Wang R, Dong Q, Wei Q and Liu L (2022) Zinc Intakes and Health Outcomes: An Umbrella Review. Front. Nutr. 9:798078.
[42] Sankhla, M. S., Kumar, R., & Prasad, L. (2019). Zinc impurity in drinking water and its toxic effect on human health. Indian Internet Journal of Forensic Medicine & Toxicology, 17(4), 84.
[43] Liu, X., Ali, M. K., Dua, K., & Xu, R. (2022). The role of zinc in the pathogenesis of lung disease. Nutrients, 14(10), 2115.
Cite This Article
  • APA Style

    Isotuk, U. R., Gunorubon, A. J., Kekpugile, D. K., Wordu, A. (2026). Assessment of Water Demand and Water Quality Status in Eastern Obolo Local Government Area, Nigeria. Science Discovery Environment, 1(1), 98-109. https://doi.org/10.11648/j.sdenv.20260101.19

    Copy | Download

    ACS Style

    Isotuk, U. R.; Gunorubon, A. J.; Kekpugile, D. K.; Wordu, A. Assessment of Water Demand and Water Quality Status in Eastern Obolo Local Government Area, Nigeria. Sci. Discov. Environ. 2026, 1(1), 98-109. doi: 10.11648/j.sdenv.20260101.19

    Copy | Download

    AMA Style

    Isotuk UR, Gunorubon AJ, Kekpugile DK, Wordu A. Assessment of Water Demand and Water Quality Status in Eastern Obolo Local Government Area, Nigeria. Sci Discov Environ. 2026;1(1):98-109. doi: 10.11648/j.sdenv.20260101.19

    Copy | Download

  • @article{10.11648/j.sdenv.20260101.19,
      author = {Uzono Romokere Isotuk and Akpa Jackson Gunorubon and Dagde Kenneth Kekpugile and Animia Wordu},
      title = {Assessment of Water Demand and Water Quality Status in Eastern Obolo Local Government Area, Nigeria},
      journal = {Science Discovery Environment},
      volume = {1},
      number = {1},
      pages = {98-109},
      doi = {10.11648/j.sdenv.20260101.19},
      url = {https://doi.org/10.11648/j.sdenv.20260101.19},
      eprint = {https://article.sciencepublishinggroup.com/pdf/10.11648.j.sdenv.20260101.19},
      abstract = {Access to safe drinking water remains a huge challenge in developing regions, especially those facing population growth and industrial activities. The present study carried out an assessment of water demand and determined the physicochemical quality of major domestic water sources in 22 accessible communities of Eastern Obolo, a coastal area of Akwa Ibom State, Nigeria. The population projection indicated 59,970 persons in 2006 and 107,627, respectively, and thus increased the total water demand from 29.99 million L/day to 53.81 million L/day. Water samples from both surface and groundwater were collected and analyzed using standard ASTM and WHO procedures. Findings revealed widespread deterioration of water quality. pH, salinity, turbidity, TSS, TDS, and electrical conductivity frequently exceeded NSDWQ limits. Coastal communities exhibited high salinity, TDS, and EC due to seawater intrusion, while nitrate concentrations (69–72.5 mg/L) in agricultural areas were far above the EPA limit of 10 mg/L, reflecting fertilizer runoff. Sulfate levels reached 1200.5 mg/L in oil-producing areas. Heavy metals—including iron (0.21–0.72 mg/L), manganese (up to 0.44 mg/L), copper (up to 3.48 mg/L), and zinc (up to 5.76 mg/L)—also exceeded NSDWQ standards, linked to abandoned oil and gas facilities. Overall, the research indicates that most water sources are not safe for consumption without treatment in Eastern Obolo. In fact, the combined impacts of seawater intrusion, agricultural runoff, and petroleum-related contamination bring into focus the pressing demand for targeted purification and decentralized treatment solutions.},
     year = {2026}
    }
    

    Copy | Download

  • TY  - JOUR
    T1  - Assessment of Water Demand and Water Quality Status in Eastern Obolo Local Government Area, Nigeria
    AU  - Uzono Romokere Isotuk
    AU  - Akpa Jackson Gunorubon
    AU  - Dagde Kenneth Kekpugile
    AU  - Animia Wordu
    Y1  - 2026/03/04
    PY  - 2026
    N1  - https://doi.org/10.11648/j.sdenv.20260101.19
    DO  - 10.11648/j.sdenv.20260101.19
    T2  - Science Discovery Environment
    JF  - Science Discovery Environment
    JO  - Science Discovery Environment
    SP  - 98
    EP  - 109
    PB  - Science Publishing Group
    UR  - https://doi.org/10.11648/j.sdenv.20260101.19
    AB  - Access to safe drinking water remains a huge challenge in developing regions, especially those facing population growth and industrial activities. The present study carried out an assessment of water demand and determined the physicochemical quality of major domestic water sources in 22 accessible communities of Eastern Obolo, a coastal area of Akwa Ibom State, Nigeria. The population projection indicated 59,970 persons in 2006 and 107,627, respectively, and thus increased the total water demand from 29.99 million L/day to 53.81 million L/day. Water samples from both surface and groundwater were collected and analyzed using standard ASTM and WHO procedures. Findings revealed widespread deterioration of water quality. pH, salinity, turbidity, TSS, TDS, and electrical conductivity frequently exceeded NSDWQ limits. Coastal communities exhibited high salinity, TDS, and EC due to seawater intrusion, while nitrate concentrations (69–72.5 mg/L) in agricultural areas were far above the EPA limit of 10 mg/L, reflecting fertilizer runoff. Sulfate levels reached 1200.5 mg/L in oil-producing areas. Heavy metals—including iron (0.21–0.72 mg/L), manganese (up to 0.44 mg/L), copper (up to 3.48 mg/L), and zinc (up to 5.76 mg/L)—also exceeded NSDWQ standards, linked to abandoned oil and gas facilities. Overall, the research indicates that most water sources are not safe for consumption without treatment in Eastern Obolo. In fact, the combined impacts of seawater intrusion, agricultural runoff, and petroleum-related contamination bring into focus the pressing demand for targeted purification and decentralized treatment solutions.
    VL  - 1
    IS  - 1
    ER  - 

    Copy | Download

Author Information
  • Department of Chemical/Petrochemical Engineering, Akwa Ibom State University, Uyo, Nigeria

  • Department of Chemical/Petrochemical Engineering, Rivers State University, Portharcourt, Nigeria

  • Department of Chemical/Petrochemical Engineering, Rivers State University, Portharcourt, Nigeria

  • Department of Chemical/Petrochemical Engineering, Rivers State University, Portharcourt, Nigeria