Abstract
The cognitive, emotional, and behavioral functioning of humans is greatly impacted by mental health issues. An increasing public health concern in Kenya is outpatient mental health morbidity. The geographic distribution of these symptoms and their correlation with infectious diseases have not, however, been thoroughly investigated. The objective of this research was to investigate the spatial distribution of mental health conditions in Kenya and their correlation with infectious diseases, including HIV, TB, and STIs. To evaluate the regional distribution of outpatient mental health cases, a spatial modeling approach was used. In order to find high-prevalence regions and possible links, the study used geostatistical approaches to integrate epidemiological data on infectious diseases and mental health issues. The results showed that mental health issues were not evenly distributed, with a higher emphasis in Nairobi and the Western areas. Infectious diseases and mental health disorders were shown to be strongly correlated, indicating possible connections between these health costs. High accuracy and validity were displayed by the spatial model, which provided insightful information for planning interventions and allocating resources. The distribution of mental health disorders and its relationship to infectious diseases in Kenya are better understood thanks to this study. The results emphasize the necessity of locally focused mental health treatments, especially in high-risk areas. These insights can be used by policymakers to enhance mental health services accessibility, optimize healthcare methods, and create integrated treatment plans for people with co-occurring disorders.
Keywords
Mental Health, Infectious Diseases, Outpatient Morbidity, Spatial Modeling, Policy, Data, Treatment, Conditional Autoregressive
1. Introduction
Psychiatric diseases, often known as mental illnesses or mental health disorders, have been a major global health concern for both people and public health systems
| [14] | Gruebner, O., Rapp, M. A., Adli, M., Kluge, U., Galea, S., & Heinz, A. (2017). Cities and mental health. Deutsches Ärzteblatt International, 114(8), 121–127. https://doi.org/10.3238/arztebl.2017.0121 |
[14]
. The Mental health problems have a significant impact on how persons think, feel, and behave.
| [12] | Gaglioti, A. H., Petterson, S., Bazemore, A., & Phillips, R. (2017). Access to primary care in US counties is associated with lower rates of mental health hospitalizations. The Journal of the American Board of Family Medicine, 30(4), 404–413. https://doi.org/10.3122/jabfm.2017.04.170112 |
[12]
. These illnesses interfered with people’s ability to think clearly and make decisions by warping their views and mental processes
| [10] | Price, R. W., Brew, B. J., Sidtis, J. J., Rosenblum, M. L., Scheck, A. C., & Cleary, P. (1988). The brain in AIDS: Central nervous system HIV-1 infection and AIDS dementia complex. Science, 239(4840), 586–592. https://doi.org/10.1126/science.3277272 |
[10]
. I have highlighted the crucial role that mental health plays in overall well-being
| [1] | World Health Organization, Department of Mental Health, Substance Abuse, World Health Organization, Mental Health Evidence, & Research Team. (2005). Mental health atlas 2005. World Health Organization. |
[1]
. They have highlighted the notion that “no health without mental health”
| [2] | Prince, M., Patel, V., Saxena, S., Maj, M., Maselko, J., Phillips, M. R., & Rahman, A. (2007). No health without mental health. The Lancet, 370(9590), 859–877. https://doi.org/10.1016/S0140-6736(07)61238-0 |
[2]
.
In Kenya, Public health systems are heavily burdened by mental health problems, but there is a key knowledge gap about the regional distribution of these diseases and their effect on outpatient morbidity
| [3] | Meyer, A. C., & Ndetei, D. (2016, February). Providing sustainable mental health care in Kenya: A demonstration project. In Providing sustainable mental and neurological health care in Ghana and Kenya: Workshop summary. National Academies Press (US). |
[3]
The creation of workable healthcare policies and efficient resource management techniques is impeded by this knowledge gap
| [16] | Patel, V., Araya, R., Chatterjee, S., Chisholm, D., Cohen, A., De Silva, M., & van Ommeren, M. (2007). Treatment and prevention of mental disorders in low-income and middle-income countries. The Lancet, 370(9591), 991–1005. https://doi.org/10.1016/S0140-6736(07)61240-9 |
[16]
. Addressing these problems and advancing equitable mental health treatment across various regions required an understanding of the spatial patterns of mental health and their implications for outpatient morbidity
| [4] | Tadmon, D., & Bearman, P. S. (2023). Differential spatial-social accessibility to mental health care and suicide. Proceedings of the National Academy of Sciences, 120(19), e2301304120. https://doi.org/10.1073/pnas.2301304120 |
[4]
.
Untangling the link between mental health problems and outpatient morbidity, which enables a thorough knowledge of the influence of mental health on overall healthcare consumption, is another key component
| [13] | Rao, D., Chen, W. T., Pearson, C. R., Simoni, J. M., Fredriksen-Goldsen, K., Nelson, K.,... & Zhang, F. (2012). Social support mediates the relationship between HIV stigma and depression/quality of life among people living with HIV in Beijing, China. International Journal of STD & AIDS, 23(7), 481–484. https://doi.org/10.1258/ijsa.2009.009428 |
[13]
. It's crucial to understand whether particular mental health issues are associated with particular kinds of outpatient morbidity
| [6] | World Health Organization. (2001). The world health report 2001: Mental health—New understanding, new hope. World Health Organization. |
[6]
. Janse confirmed that such information would help to promote a holistic approach to healthcare delivery by shedding light on the complex interactions between physical and mental health
| [5] | Janse Van Rensburg, A., Dube, A., Curran, R., Ambaw, F., Murdoch, J., Bachmann, M., Petersen, I., & Fairall, L. (2020). Comorbidities between tuberculosis and common mental disorders: A scoping review of epidemiological patterns and person-centred care interventions from low-to-middle income and BRICS countries. Infectious Diseases of Poverty, 9(1), 1–18. https://doi.org/10.1186/s40249-020-00732-5 |
[5]
.
The study by Bhatt integrated epidemiological data on infectious diseases and mental health disorders using geostatistical techniques to identify high-prevalence locations and potential connections
| [11] | Bhatt, S., Weiss, D. J., Cameron, E., Bisanzio, D., Mappin, B., Dalrymple, U., Battle, K. E., Moyes, C. L., Henry, A., Eckhoff, P. A., Wenger, E. A., Briët, O. J., Penny, M. A., Smith, T. A., Bennett, A., Yukich, J., Eisele, T. P., Griffin, J. T., Fergus, C. A., & Gething, P. W. (2015). The effect of malaria control on Plasmodium falciparum in Africa between 2000 and 2015. Nature, 526(7572), 207–211. https://doi.org/10.1038/nature15535 |
[11]
. Spatial modeling methods to examine outpatient morbidity and mental health in Kenya may provide insight into potential risk factors or drivers influencing the patterns that have been noticed
| [7] | Fisher, P. F., & Langford, M. (1995). Modelling the errors in areal interpolation between zonal systems by Monte Carlo simulation. Environment and Planning A, 27(2), 211–224. https://doi.org/10.1068/a270211 |
[7]
. We can discover the complex influences on mental health outcomes as discussed by Porter by examining healthcare-related factors across various geographic areas
. Furthermore, according to Persad, spatial modeling technique was employed to assess the regional distribution of outpatient mental health cases
| [9] | Persad, R. A. (2020). Spatio-temporal analysis of mental illness and the impact of marginalization-based factors: A case study of Ontario, Canada. Annals of GIS, 26(3), 237–250. https://doi.org/10.1080/19475683.2020.1808319 |
[9]
.
The study aimed at spatial modelling to evaluate the geographic distribution of mental health issues, determining the connections between these disorders and HIV, STIs, and Tuberculosis
| [15] | Wang, P. S., Aguilar-Gaxiola, S., Alonso, J., Angermeyer, M. C., Borges, G., Bromet, E. J., Bruffaerts, R., de Girolamo, G., de Graaf, R., Gureje, O., Haro, J. M., Karam, E. G., Kessler, R. C., Kovess, V., Lane, M. C., Lee, S., Levinson, D., Ono, Y., Petukhova, M.,... & Wells, J. E. (2007). Use of mental health services for anxiety, mood, and substance disorders in 17 countries in the WHO world mental health surveys. The Lancet, 370(9590), 841–850. https://doi.org/10.1016/S0140-6736(07)61414-7 |
[15]
. In addition, assess the precision and soundness of the spatial model and to educate targeted therapists and policy decisions, as well as offer insights into the regional dynamics of mental health.
2. Methodology
2.1. Ethical Considerations
Before start of the study, the Jomo Kenyatta University of Agriculture and Technology (JKUAT) Institutional Scientific and Ethics Review Committee (ISEREC) granted ethical clearance, guaranteeing that it complied with the rules for research with human beings.
2.2. Study Design
To evaluate outpatient mental health patients across Kenyan regions, a spatial modeling approach was employed. Data on mental health was combined with epidemiological data on HIV, TB, and STIs using geostatistical techniques.
2.3. To Determine the Spatial Distribution of Mental Health in Kenya
The Intrinsic Conditional Autoregressive (ICAR) model was employed to investigate spatial dependence in the data. Key components included:
1) A collection of non-overlapping areal units represented as S equals {S1,...,SK}, each with known offsets O equals {O1,...,OK} and corresponding responses Y equals{Y1,...,YK}.
2) A matrix of covariates X equals {x1,...,xK} and a spatial structure component ψ equals {ψ1,...,ψK}, representing residual spatial autocorrelation. • The relationship between covariates and responses modeled using a hierarchical Bayesian setting.
3) Modeling of the spatial structure component ψ using a weight or adjacency function.
ICAR Models for Areal Data
Framework for CAR Model:
non-overlapping areal units S = S1,...,SK
linked to corresponding responsesY= (Y1,...,YK) (1)
and known Spatial variation in the response is modeled by a matrix of covariates
and a spatial structure component
where the latter is included to model any remaining spatial autocorrelation after accounting for covariate effects. The vector of covariates for areal unit Sk is denoted by
Using the Hierarchical Bayesian Setting:
(5)
g(μ_K) = x_K^T β + O_K + ψ_K(6)
where β ∼ N(µβ,Σβ). Within ψ, a weight or adjacency matrix controls spatial autocorrelation.
2.4. Structure of the Conditional Autoregressive (CAR) Model
The study focused on disease risk assessments using the count (y) of infection cases with the following model structure:
where Ei is the offset of polygon i, λi is the relative risk of diseases, β0 is the intercept, βj is the coefficient of covariate xij in polygon i, and si represents the spatially structured variate of polygon i following an ICAR distribution.
The ICAR model captures spatial dependency among neighboring polygons. The distribution of si follows an ICAR distribution, mathematically represented as:
s_i | s_{-i}∼N(∑_{j=1}^n w_{ij} s_j, τ_i^2)(8)
where s−i represents the set of spatially structured variates of all polygons except polygon i, wij represents the spatial weights specifying the connectivity between polygon i and polygon j, and τi2 is the precision parameter of the ICAR model for polygon i.
The ICAR model assumes that the spatially structured variate of each polygon is influenced by the spatially structured variates of its neighboring polygons. The spatial weights wij are typically defined based on adjacency or contiguity between polygons.
By incorporating the ICAR model structure into the analysis of disease risk assessments, this study aims to account for spatial autocorrelation in count data and capture underlying spatial patterns in disease occurrence. The ICAR model allows estimation of the relative risk of diseases while considering spatial dependencies among neighboring polygons.
Disease Mental Risk Mapping Using Conditional Autoregressive Besag-York-Mollié(CAR BYM)
For disease risk mapping, the Conditional Autoregressive-BYM (CAR-BYM) model was utilized. This model comprised a regular random effect component for spatial rarefaction and an ICAR component for spatial autocorrelation.
The model equation was:
η_i = μ + x_i′β + ϕ_i + θ_i(9)
where µ represented the average risk level, xi denoted the observational vector of independent variables for unit i, β was the parameter vector, ϕi represented the ICAR component, and θi represented the random effect of non-spatial heterogeneity.
2.5. To Evaluate Accuracy and Validity of the Spatial Model Used Bayesian Inference with MCMC
Markov Chain Monte Carlo (MCMC) techniques were employed for Bayesian parameter estimation. Samples from the joint posterior distribution were generated iteratively using the Gibbs sampler method.
The algorithm iterated as follows for each parameter θ:
p(θ_t^{(1)} | θ_{t-1}^{(2)}, ..., θ_{t-1}^{(k)}, y)(10)
Sample θt from
Sample θ_t^{(2)} from θ_t^{(2)}∼p(θ_t^{(2)} | θ_t^{(1)},θ_{t-1}^{(3)},...,θ_{t-1}^{(k)},y)(11)
Sample θ_t^{(k)} from θ_t^{(k)}∼p(θ_t^{(k)} |θ_t^{(1)}, ...,θ_{t-1}^{(k-1)}, y)(12)
Equation
4 represents the model equation for the CAR-BYM model.
Convergence was assessed, and parameter estimates were obtained by calculating the posterior means.
Evaluation of the Model:
2.6. Information Criterion for Deviance (DIC)
Model fit was measured using the Information Criterion for Deviance (DIC0, which was also utilized for model selection. The formula for computing it was:
in which Pb denoted a Bayesian measure of model complexity and D(θ) represented the posterior mean of the deviance. A lower DIC value suggested that the model suited the data better.
Model Implementation:
Using ICAR models and Bayesian inference techniques, this research offered a comprehensive framework for investigating spatial dependency in mental health outcomes and evaluating the influence of factors connected to infectious diseases.
3. Data Analysis
In this section, the research conducted a spatial mapping of mental illnesses in Kenya and explored the relationship between HIV, STIs, and TB with respect to mental disorders.
3.1. Data Collection
Data on mental health was sourced from medical institution websites, data collection firms, publications, and data documents. Secondary sources included the Institute of Health Metrics and Evaluation, the Kenya National Bureau of Statistics, and the Mathari National Teaching and Referral Hospital.
3.2. Software for Data Analysis
The software of choice was R-Studio and winBUGS as they contain in built tested out functions required to carry out Data Preprocessing, Exploratory Data Analy- sis, Parameter Estimation and Inference by utilizing Markov Chain Monte Carlo.
4. Results and Discussions
4.1. Spatial Distribution of Mental Health Conditions Among Individuals Seeking Outpatient Care in Different Regions of Kenya
4.1.1. Mental Illness Incidence
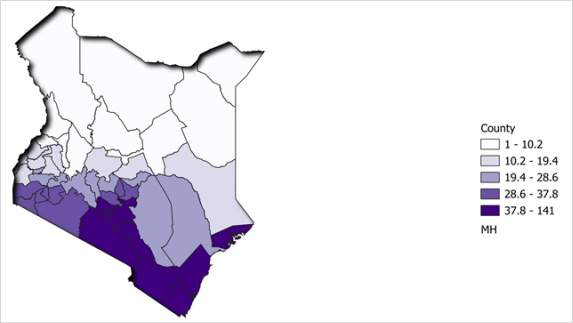
Figure 1. Mental illness incidence.
The study results map showed that the prevalence of mental illnesses is highest in the urban areas of Kenya. The counties with the highest (37.8-141) prevalence of mental illnesses are Nairobi, Mombasa, Kiambu, Kisumu, and Nakuru. Conversely, the counties with the lowest (1-10.2) prevalence of mental illnesses are Mandera, Wajir, Garissa, Tana River, and Turkana (
Figure 1).
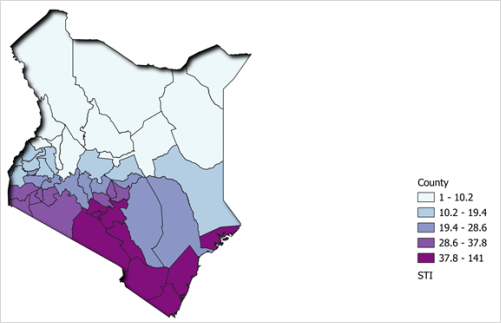
4.1.2. STI Incidence
The counties with the (37.8-141) highest prevalence of STIs are located in the western and southwestern parts, including Siaya, Kisumu, Migori, Homa Bay, Busia, Bungoma, Bomet, Nandi, and Trans Nzoia. In addition, there were pockets of high STI prevalence (37.8-141) in other parts such as Nairobi and Kilifi County (
Figure 2).
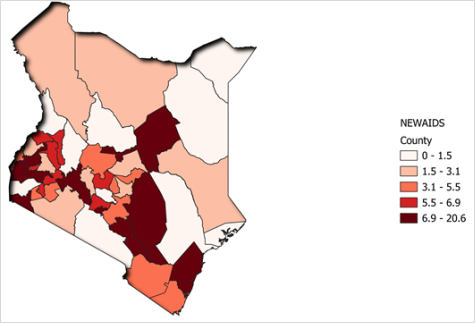
4.1.3. HIV Incidence
Counties with the highest (6.9-20.6) rates of HIV prevalence include Siaya, Kisumu, Migori, Homa Bay, Busia, Bungoma, Nyamira, Kisii, Kericho, Bomet, Nandi, and Trans Nzoia. Other parts such as Nairobi County and Kilifi County also exhibit significant (5.5-6.9) HIV prevalence. Conversely, the lowest HIV prevalence rates (0-1.5) are found in Marsabit, Wajir, Garissa, Mandera, Isiolo, Tana River, Turkana, Lamu, Samburu, West Pokot, Elgeyo Marakwet, and Baringo (
Figure 3).
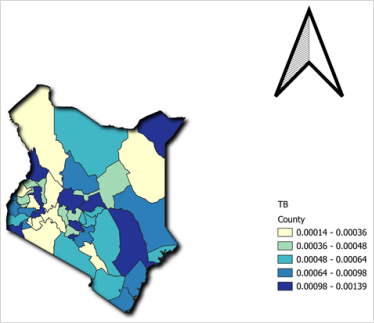
4.1.4. Tuberculosis Incidence
Darker colouring on the map of Kenya denoted higher tuberculosis incidence (0.00098-0.00139). The western and Central regions had greater rates of tuberculosis than the Coastal and North Eastern regions (
Figure 4).
Figure 4. Tuberculosis incidence.
4.2. Evaluating the Relationship Between Mental Health Conditions and HIV and TB at the Regional Level
(1) Non-spatial analysis
Table 1. Non-spatial analysis on Relationship between Mental Disorders and HIV, TB, and STIs.
Node | Mean | SD | MC Error | 2.5% | Median | 97.5% | Start | Sample |
α0 | 0.05076 | 0.03156 | 6.435 × 10⁻⁴ | -0.01194 | 0.05104 | 0.1111 | 1 | 20000 |
α1[1] (STI) | 0.005517 | 4.485 × 10⁻⁴ | 8.865 × 10⁻⁶ | 0.004642 | 0.005518 | 0.00638 | 1 | 20000 |
α1[2] (TB) | 6.916 × 10⁻⁴ | 1.998 × 10⁻⁴ | 2.558 × 10⁻⁶ | 2.978 × 10⁻⁴ | 6.934 × 10⁻⁴ | 0.001082 | 1 | 20000 |
α1[3] (AIDS) | -0.02062 | 0.002468 | 3.0103 × 10⁻⁵ | -0.0255 | -0.02058 | -0.01587 | 1 | 20000 |
1. STI (Infections Transmitted by Sexual Intercourse - α1[1]):
1) The effect of STI on mental illness (α1[1]) has a posterior mean estimate of around 0.005517.
2) The 95% credible interval (CI) for α1[1] ranges from 0.004642 to 0.005518.
Inference: STIs and mental illness are positively and statistically significantly correlated (0.005517).
2. α1[2] (Tuberculosis):
1) The posterior mean estimate for the impact of tuberculosis on mental illness (α1[2]) is approximately 6.916 × 10⁻⁴.
2) The 95% credible interval (CI) for α1[2] spans roughly from 2.978 × 10⁻⁴ to 6.934 × 10⁻⁴.
Inference: There exists a statistically significant and positive association between mental illness and tuberculosis. (data) Specifically, there is a slight rise in mental illness for every unit increase in tuberculosis within the credible interval.
3. α1[3] (AIDS):
1) The effect of AIDS on mental illness (α1[3]) has a posterior mean estimate of about −0.02062.
2) The 95% credible interval (CI) for α1[3] ranges from −0.0255 to −0.01587.
Inference: There is a statistically significant and adverse correlation between mental illness and HIV. Specifically, there is a correlation between a one-unit rise in HIV and a decline in mental illness that is contained within the credible interval (
Table 1).
(2) Spatial Analysis
Below is a table showing the relationship between Mental Disorders and HIV, TB, and STIs with the spatial aspect in consideration.
Table 2. Relationship between Mental Disorders and Infectious Diseases.
Node | Mean | SD | MC Error | 2.5% | Median | 97.5% | Start | Sample |
α0 | -0.1441 | 0.06276 | 0.002417 | -0.269 | -0.143 | -0.02424 | 1 | 20000 |
α1[1] (STI) | 0.002576 | 6.686 × 10⁻⁴ | 2.023 × 10⁻⁵ | 0.001274 | 0.002576 | 0.003872 | 1 | 20000 |
α1[2] (TB) | 5.935 × 10⁻⁴ | 2.483 × 10⁻⁴ | 5.141 × 10⁻⁶ | 1.037 × 10⁻⁴ | 5.954 × 10⁻⁴ | 0.001074 | 1 | 20000 |
σ | 1.462 | 0.1665 | 0.00168 | 1.175 | 1.448 | 1.83 | 1 | 20000 |
τ | 0.4861 | 0.1086 | 0.00118 | 0.2987 | 0.4768 | 0.7241 | 1 | 20000 |
α1[3] (AIDS) | 0.002954 | 0.00654 | 2.265 × 10⁻⁴ | -0.009481 | 0.002846 | 0.01576 | 1 | 20000 |
1. α0:
1) The posterior mean estimate for α0 is approximately -0.1441.
2) The standard deviation (SD) of α0 is approximately 0.06276.
3) The 95% credible interval for α0 ranges from approximately -0.269 to -0.02424.
Inference: In the context of this analysis, α0 represents the baseline effect on mental illness when all other covariates (STI, TB, AIDS) are zero. The posterior mean of approximately -0.1441 suggests a negative impact on mental illness, and the 95% credible interval indicates that this effect is statistically significant and falls between -0.269 and -0.02424.
2. α1[1] (associated with STI):
1) The posterior mean estimate for α1[1] is approximately 0.002576.
2) The standard deviation (SD) of α1[1] is approximately 6.686 × 10⁻⁴.
3) The 95% credible interval for α1[1] ranges from approximately 0.001274 to 0.003872.
Inference: α1[1] represents the effect of STI on mental illness. The posterior mean of approximately 0.002576 suggests a positive impact, and the 95% credible interval indicated that this effect was statistically significant and fell between 0.001274 to 0.003872.
3. α1[2] (associated with TB):
1) The posterior mean estimate for α1[2] is approximately 5.935 × 10⁻⁴.
2) The standard deviation (SD) of α1[2] is approximately 2.483 × 10⁻⁴.
3) The 95% credible interval for α1[2] ranges from approximately 1.037 × 10⁻⁴ to 0.001074.
Inference: In the context of this analysis, α1[2] represents the effect of TB on mental illness. The posterior mean of approximately 5.935×10⁻⁴ suggests a positive impact, and the 95% credible interval indicated that this effect was statistically significant and fell between 1.037 × 10⁻⁴ to 0.001074.
4. α1[3] (associated with AIDS):
1) The posterior mean estimate for α1[3] is approximately 0.002954.
2) The standard deviation (SD) of α1[3] is approximately 0.00654.
3) The 95% credible interval for α1[3] ranges from approximately -0.009481 to 0.01576.
Inference: In the context of this analysis, α1[3] represents the effect of AIDS on mental illness. The posterior mean of approximately 0.002954 suggests a positive impact, and the 95% credible interval indicates that this effect is statistically significant. However, the wide credible interval suggests some uncertainty about the magnitude of this effect.
5. σ (Standard Deviation of Residuals):
The posterior mean estimate for the standard deviation of residuals (σ) is approximately 1.462.
Inference: σ represents the variability of the unexplained part of mental illness not captured by the covariates. A higher σ indicates higher variability in mental illness not explained by the model.
6. τ (Precision or Inverse Variance of the Covariate Effects):
The posterior mean estimate for τ is approximately 0.4861.
Inference: τ represents the precision of the covariate effects. A lower τ indicates more precise estimates of the covariate effects.
(3) Spatial-Temporal Analysis
Table 3. Spatial-Temporal Analysis on the Relationship between Mental Disorders and Infectious Diseases.
Node | Mean | SD | MC Error | 2.5% | Median | 97.5% | Start | Sample |
α0 | -0.2158 | 0.0754 | 0.003107 | -0.3732 | -0.2132 | -0.07168 | 1 | 20000 |
α1[1] (STI) | 0.002381 | 6.904 × 10⁻⁴ | 2.226 × 10⁻⁵ | 0.001046 | 0.002375 | 0.003754 | 1 | 20000 |
α1[2] (TB) | 5.014 × 10⁻⁴ | 2.557 × 10⁻⁴ | 5.463 × 10⁻⁶ | -3.15 × 10⁻⁶ | 5.032 × 10⁻⁴ | 9.979 × 10⁻⁴ | 1 | 20000 |
α3 (Time) | 0.02319 | 0.01347 | 4.002 × 10⁻⁴ | -0.003645 | 0.02329 | 0.04951 | 1 | 20000 |
σ | 1.485 | 0.1695 | 0.001817 | 1.196 | 1.471 | 1.857 | 1 | 20000 |
τ | 0.4709 | 0.1051 | 0.001133 | 0.2901 | 0.4623 | 0.6989 | 1 | 20000 |
α1[3] (AIDS) | 0.006874 | 0.006923 | 2.652 × 10⁻⁴ | -0.006332 | 0.006733 | 0.02119 | 1 | 20000 |
1. α0:
1) The posterior mean estimate for α0 is approximately -0.2158.
2) The standard deviation (SD) of α0 is approximately 0.0754.
3) The 95% credible interval for α0 ranges from approximately -0.3732 to -0.07168.
Inference: In the context of this analysis, α0 represents the baseline effect on mental illness when all other covariates (STI, TB, AIDS) are zero. The posterior mean of approximately -0.2158 suggests a negative impact on mental illness, and the 95% credible interval indicates that this effect is statistically significant and falls between -0.3732 and -0.07168.
2. α1[1] (associated with STI):
1) The posterior mean estimate for α1[1] is approximately 0.002381.
2) The standard deviation (SD) of α1[1] is approximately 6.904 × 10⁻⁴.
3) The 95% credible interval for α1[1] ranges from approximately 0.001046 to 0.003754.
Inference: In the context of this analysis, α1[1] represents the effect of STI on mental illness. The posterior mean of approximately 0.002381 suggests a positive impact, and the 95% credible interval indicates that this effect is statistically significant and falls between 0.001046 and 0.003754.
3. α1[2] (associated with TB):
1) The posterior mean estimate for α1[2] is approximately 5.014 × 10⁻⁴.
2) The standard deviation (SD) of α1[2] is approximately 2.557 × 10⁻⁴.
3) The 95% credible interval for α1[2] ranges from approximately −3.15×10⁻⁶ to 9.979×10⁻⁴.
Inference: In the context of this analysis, α1[2] represents the effect of TB on mental illness. The posterior mean of approximately 5.014×10⁻⁴ suggests a positive impact, but it’s important to note that the 95% credible interval includes values very close to zero. This indicates some uncertainty about the magnitude and statistical significance of this effect.
4. α1[3] (associated with AIDS):
1) The posterior mean estimate for α1[3] is approximately 0.006874.
2) The standard deviation (SD) of α1[3] is approximately 0.006923.
3) The 95% credible interval for α1[3] ranges from approximately -0.006332 to 0.02119.
Inference: In the context of your analysis, α1[3] represents the effect of AIDS on mental illness. The posterior mean of approximately 0.006874 suggests a positive impact, and the 95% credible interval indicates that this effect is statistically significant. However, the wide credible interval suggests some uncertainty about the magnitude of this effect.
5. α3:
1) The posterior mean estimate for α3 is approximately 0.02319.
2) The standard deviation (SD) of α3 is approximately 0.01347.
3) The 95% credible interval for α3 ranges from approximately −0.003645 to 0.04951.
Inference: α3 represents the Temporal aspect of the model. The posterior mean estimate of approximately 0.02319 indicates a certain positive impact, and the credible interval suggests that this effect is statistically significant.
4.3. Evaluation of Accuracy and Validity of the Spatial Model
Model Comparison
1. Variability (σ) and Precision (τ)
In the context of the analysis, σ represents the standard deviation of the residuals in your model, indicating the amount of unexplained variability in mental illness not captured by the covariates. The values for σ in each of the three analyses are as follows:
1) Non-Spatial Analysis: σ ≈ 1.462
2) Spatial Analysis: σ ≈ 1.485
3) Spatial-Temporal Analysis: σ ≈ 1.485
The relatively close values of σ across all three analyses suggest that the unexplained variability in mental illness remains similar. A higher σ value implies a greater degree of unexplained variability in mental illness not accounted for by the model.
2. Precision (τ)
In the context of the project analysis, τ represents the precision or the inverse variance of the covariate effects. A lower τ value indicates more precise estimates of the covariate effects. The values for τ in each of the three analyses are as follows:
1) Non-Spatial Analysis: τ ≈ 0.4861
2) Spatial Analysis: τ ≈ 0.4709
3) Spatial-Temporal Analysis: τ ≈ 0.4709
The consistent range of values for τ across all three analyses suggests that the precision of the estimates of covariate effects is similar in each model.
4.4. Model Comparison Based on DIC
1. Non-Spatial Model (GLM)
1) DIC = 0.0502
2) Moderate model complexity
3) Offers a decent match to the data
2. Spatial Model
1) DIC = -0.1463
2) Lower DIC compared to the non-spatial model
3) Balances complexity and provides a better fit to the data
3. Space-Time Model
1) DIC = -0.221
2) Lowest DIC among the three models
3) Offers the best balance between model complexity and data fitting
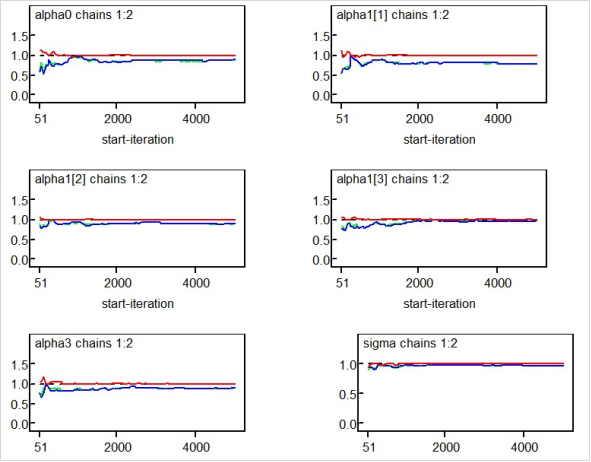
Figure 5. Gelman Rubin Spatial-Temporal Trace.
5. Discussion
This study sheds important light on the spatial distribution of mental health conditions and their relationship to infectious diseases among Kenyan outpatients.
It shows that mental health disorders are not evenly distributed, with higher prevalence rates found in urban areas like Nairobi, Mombasa, Kisumu, Kiambu, and Nakuru, while significantly lower cases of mental health morbidity were found in northeastern counties like Mandera, Wajir, and Garissa.
It also found a strong correlation between mental health disorders and infectious diseases like HIV, STIs, and tuberculosis (TB), with higher incidences of mental health disorders in regions with a higher burden of these infections. The highest prevalence of STIs was recorded in Nairobi and Kilifi, while TB was more concentrated in the western and center areas. Similarly, Siaya, Kisumu, Homa Bay, and Nairobi had the highest rates of HIV prevalence, which may have been brought on by things like population movement, commercial sex, and restricted access to medical care.
The spatial modeling approach's efficacy in capturing regional disparities in mental health disorders was further supported by the study. When compared to other models, the spatial-temporal model performed better, as evidenced by its lowest Deviance Information Criterion (DIC) value of -0.221.
5.1. Analysis of the Results
The observed geographical variations in mental health prevalence could be explained by a number of reasons. Rather than a real rise in instances, the increased burden in metropolitan areas may be the result of better reporting systems and diagnostic skills. Furthermore, people in metropolitan environments are more likely to experience stress, unstable finances, and social isolation, all of which could help explain why mental health concerns are more common.
There are several reasons why infectious infections and mental health issues may be related. Mental health is adversely affected by chronic diseases like HIV and TB, which can cause psychological suffering, social stigma, and exclusion. The cohabitation of infectious diseases with mental health issues may be made worse by socioeconomic factors such as unemployment, poverty, and access to healthcare. The need for focused interventions is highlighted by the significant STI burden in Nairobi and Kilifi, which may be caused by high population density, restricted access to healthcare, and high-risk behaviors.
5.2. Evaluation Against Previous Research
These results are consistent with earlier studies on regional differences in mental health. According to studies like Persad (2020), mental disorders are more common in metropolitan areas. incidents, mostly as a result of improved diagnostic systems and increased access to healthcare. Price et al. (1988), who highlighted the interdependence of physical and mental health states, especially in populations with high communicable illness burdens, concur with the observed relationship between infectious diseases and mental health.
Additionally, the patterns of regional TB prevalence are consistent with research by Janse Van Rensburg et al. (2020), which emphasized differences in the frequency of infectious diseases in various geographical areas. Furthermore, by offering spatially explicit data supporting the need for regionally specific mental health initiatives, this study expands on the work of Meyer & Ndetei (2016).
5.3. Policy and Practice Implications
The study emphasizes the value of integrated healthcare strategies that address physical and mental health issues at the same time. Considering the known correlation between infectious diseases and mental health conditions, incorporating mental health services into existing HIV and TB treatment programs could enhance patient outcomes. Additionally, community-driven mental health interventions, such as peer support initiatives and educational programs, should be prioritized in high-prevalence regions. Healthcare policymakers should consider the identified spatial disparities when allocating resources, ensuring equitable distribution of mental health services. Special focus should be placed on regions with a high burden of infectious diseases, where mental health services remain underdeveloped.
5.4. Strengths and Limitations
A notable strength of this study is its use of advanced spatial modeling techniques, which provide high-resolution insights into mental health disparities across Kenya. The validation of the spatial model further reinforces the reliability of these findings, offering a robust tool for healthcare policy and planning.
Nonetheless, it is important to recognize some limitations. Due to the study's reliance on secondary data sources, reporting and completeness may have been inconsistent. Furthermore, although links between mental health and infectious disorders were found, causative correlations could not be deduced. It is advised that future longitudinal studies investigate the directionality of these correlation.
6. Conclusion
The research concluded that among patients seeking outpatient therapy in various parts of Kenya, there is a non-uniform spatial distribution of mental health disorders. This non-uniform distribution suggests that the needs for mental health care may differ geographically. The study found a strong correlation at the regional level between the prevalence of HIV, STIs, and TB and mental health disorders. There may be a complex interaction between the burdens of infectious diseases and mental health issues because regions with greater rates of these infectious disease burdens also had higher rates of mental health disorders This study’s spatial model is determined to be both valid and accurate, as it successfully pinpoints regions with higher rates of mental health issues. Healthcare planners can benefit greatly from the model by using it to better allocate resources and enhance access to mental health services in high-risk areas. The results highlight the value of focused therapies and integrated healthcare methods in addressing the intricate interactions between mental and physical health problems. The study recommends that the inclusion of mental health treatments into currently running HIV and TB healthcare initiatives should be encouraged to improve patient care and make it more comprehensive and efficient. Cross-Sectoral Collaboration: To address the underlying causes of mental health disorders, promote cooperation between the social services, education, employment, and health sectors. Encourage the development of community-based mental health programs, such as peer support groups, public awareness campaigns, and community education.
Development and implementation of geographically tailored mental health intervention programs should be done in accordance with the high-prevalence areas that have been identified. The goals of these initiatives need to be to increase people’s knowledge, accessibility to resources, and choices for treatment in these areas.
Abbreviations
ICAR | Intrinsic Conditional Autoregressive |
MCMC | Monte Carlo Simulation |
BYM | BesagYork Mollie |
DIC | Deviance Information Criterion |
WHO | WorldHealth Organization |
QGIS | Quantum Geographic Information System |
Conflicts of Interest
The authors declare no conflicts of interest.
References
| [1] |
World Health Organization, Department of Mental Health, Substance Abuse, World Health Organization, Mental Health Evidence, & Research Team. (2005). Mental health atlas 2005. World Health Organization.
|
| [2] |
Prince, M., Patel, V., Saxena, S., Maj, M., Maselko, J., Phillips, M. R., & Rahman, A. (2007). No health without mental health. The Lancet, 370(9590), 859–877.
https://doi.org/10.1016/S0140-6736(07)61238-0
|
| [3] |
Meyer, A. C., & Ndetei, D. (2016, February). Providing sustainable mental health care in Kenya: A demonstration project. In Providing sustainable mental and neurological health care in Ghana and Kenya: Workshop summary. National Academies Press (US).
|
| [4] |
Tadmon, D., & Bearman, P. S. (2023). Differential spatial-social accessibility to mental health care and suicide. Proceedings of the National Academy of Sciences, 120(19), e2301304120.
https://doi.org/10.1073/pnas.2301304120
|
| [5] |
Janse Van Rensburg, A., Dube, A., Curran, R., Ambaw, F., Murdoch, J., Bachmann, M., Petersen, I., & Fairall, L. (2020). Comorbidities between tuberculosis and common mental disorders: A scoping review of epidemiological patterns and person-centred care interventions from low-to-middle income and BRICS countries. Infectious Diseases of Poverty, 9(1), 1–18.
https://doi.org/10.1186/s40249-020-00732-5
|
| [6] |
World Health Organization. (2001). The world health report 2001: Mental health—New understanding, new hope. World Health Organization.
|
| [7] |
Fisher, P. F., & Langford, M. (1995). Modelling the errors in areal interpolation between zonal systems by Monte Carlo simulation. Environment and Planning A, 27(2), 211–224.
https://doi.org/10.1068/a270211
|
| [8] |
Porter, E. M. (2019). Applying an intrinsic conditional autoregressive reference prior for areal data (Doctoral dissertation, Virginia Tech).
https://vtechworks.lib.vt.edu/handle/10919/90237
|
| [9] |
Persad, R. A. (2020). Spatio-temporal analysis of mental illness and the impact of marginalization-based factors: A case study of Ontario, Canada. Annals of GIS, 26(3), 237–250.
https://doi.org/10.1080/19475683.2020.1808319
|
| [10] |
Price, R. W., Brew, B. J., Sidtis, J. J., Rosenblum, M. L., Scheck, A. C., & Cleary, P. (1988). The brain in AIDS: Central nervous system HIV-1 infection and AIDS dementia complex. Science, 239(4840), 586–592.
https://doi.org/10.1126/science.3277272
|
| [11] |
Bhatt, S., Weiss, D. J., Cameron, E., Bisanzio, D., Mappin, B., Dalrymple, U., Battle, K. E., Moyes, C. L., Henry, A., Eckhoff, P. A., Wenger, E. A., Briët, O. J., Penny, M. A., Smith, T. A., Bennett, A., Yukich, J., Eisele, T. P., Griffin, J. T., Fergus, C. A., & Gething, P. W. (2015). The effect of malaria control on Plasmodium falciparum in Africa between 2000 and 2015. Nature, 526(7572), 207–211.
https://doi.org/10.1038/nature15535
|
| [12] |
Gaglioti, A. H., Petterson, S., Bazemore, A., & Phillips, R. (2017). Access to primary care in US counties is associated with lower rates of mental health hospitalizations. The Journal of the American Board of Family Medicine, 30(4), 404–413.
https://doi.org/10.3122/jabfm.2017.04.170112
|
| [13] |
Rao, D., Chen, W. T., Pearson, C. R., Simoni, J. M., Fredriksen-Goldsen, K., Nelson, K.,... & Zhang, F. (2012). Social support mediates the relationship between HIV stigma and depression/quality of life among people living with HIV in Beijing, China. International Journal of STD & AIDS, 23(7), 481–484.
https://doi.org/10.1258/ijsa.2009.009428
|
| [14] |
Gruebner, O., Rapp, M. A., Adli, M., Kluge, U., Galea, S., & Heinz, A. (2017). Cities and mental health. Deutsches Ärzteblatt International, 114(8), 121–127.
https://doi.org/10.3238/arztebl.2017.0121
|
| [15] |
Wang, P. S., Aguilar-Gaxiola, S., Alonso, J., Angermeyer, M. C., Borges, G., Bromet, E. J., Bruffaerts, R., de Girolamo, G., de Graaf, R., Gureje, O., Haro, J. M., Karam, E. G., Kessler, R. C., Kovess, V., Lane, M. C., Lee, S., Levinson, D., Ono, Y., Petukhova, M.,... & Wells, J. E. (2007). Use of mental health services for anxiety, mood, and substance disorders in 17 countries in the WHO world mental health surveys. The Lancet, 370(9590), 841–850.
https://doi.org/10.1016/S0140-6736(07)61414-7
|
| [16] |
Patel, V., Araya, R., Chatterjee, S., Chisholm, D., Cohen, A., De Silva, M., & van Ommeren, M. (2007). Treatment and prevention of mental disorders in low-income and middle-income countries. The Lancet, 370(9591), 991–1005.
https://doi.org/10.1016/S0140-6736(07)61240-9
|
Cite This Article
-
APA Style
Wambui, N. R., Samuel, M., Charity, W. (2025). Spatial Modeling of Mental Health on Outpatient Morbidity in Kenya. Science Journal of Applied Mathematics and Statistics, 13(3), 45-55. https://doi.org/10.11648/j.sjams.20251303.11
 Copy
|
Copy
|
 Download
ACS Style
Wambui, N. R.; Samuel, M.; Charity, W. Spatial Modeling of Mental Health on Outpatient Morbidity in Kenya. Sci. J. Appl. Math. Stat. 2025, 13(3), 45-55. doi: 10.11648/j.sjams.20251303.11
Copy
|
Download
AMA Style
Wambui NR, Samuel M, Charity W. Spatial Modeling of Mental Health on Outpatient Morbidity in Kenya. Sci J Appl Math Stat. 2025;13(3):45-55. doi: 10.11648/j.sjams.20251303.11
Copy
|
Download
-
@article{10.11648/j.sjams.20251303.11,
  author = {Ndegwa Ruth Wambui and Mwalili Samuel and Wamwea Charity},
  title = {Spatial Modeling of Mental Health on Outpatient Morbidity in Kenya
},
  journal = {Science Journal of Applied Mathematics and Statistics},
  volume = {13},
  number = {3},
  pages = {45-55},
  doi = {10.11648/j.sjams.20251303.11},
  url = {https://doi.org/10.11648/j.sjams.20251303.11},
  eprint = {https://article.sciencepublishinggroup.com/pdf/10.11648.j.sjams.20251303.11},
  abstract = {The cognitive, emotional, and behavioral functioning of humans is greatly impacted by mental health issues. An increasing public health concern in Kenya is outpatient mental health morbidity. The geographic distribution of these symptoms and their correlation with infectious diseases have not, however, been thoroughly investigated. The objective of this research was to investigate the spatial distribution of mental health conditions in Kenya and their correlation with infectious diseases, including HIV, TB, and STIs. To evaluate the regional distribution of outpatient mental health cases, a spatial modeling approach was used. In order to find high-prevalence regions and possible links, the study used geostatistical approaches to integrate epidemiological data on infectious diseases and mental health issues. The results showed that mental health issues were not evenly distributed, with a higher emphasis in Nairobi and the Western areas. Infectious diseases and mental health disorders were shown to be strongly correlated, indicating possible connections between these health costs. High accuracy and validity were displayed by the spatial model, which provided insightful information for planning interventions and allocating resources. The distribution of mental health disorders and its relationship to infectious diseases in Kenya are better understood thanks to this study. The results emphasize the necessity of locally focused mental health treatments, especially in high-risk areas. These insights can be used by policymakers to enhance mental health services accessibility, optimize healthcare methods, and create integrated treatment plans for people with co-occurring disorders.
},
 year = {2025}
}
Copy
|
Download
-
TY  - JOUR
T1  - Spatial Modeling of Mental Health on Outpatient Morbidity in Kenya

AU  - Ndegwa Ruth Wambui
AU  - Mwalili Samuel
AU  - Wamwea Charity
Y1  - 2025/06/25
PY  - 2025
N1  - https://doi.org/10.11648/j.sjams.20251303.11
DO  - 10.11648/j.sjams.20251303.11
T2  - Science Journal of Applied Mathematics and Statistics
JF  - Science Journal of Applied Mathematics and Statistics
JO  - Science Journal of Applied Mathematics and Statistics
SP  - 45
EP  - 55
PB  - Science Publishing Group
SN  - 2376-9513
UR  - https://doi.org/10.11648/j.sjams.20251303.11
AB  - The cognitive, emotional, and behavioral functioning of humans is greatly impacted by mental health issues. An increasing public health concern in Kenya is outpatient mental health morbidity. The geographic distribution of these symptoms and their correlation with infectious diseases have not, however, been thoroughly investigated. The objective of this research was to investigate the spatial distribution of mental health conditions in Kenya and their correlation with infectious diseases, including HIV, TB, and STIs. To evaluate the regional distribution of outpatient mental health cases, a spatial modeling approach was used. In order to find high-prevalence regions and possible links, the study used geostatistical approaches to integrate epidemiological data on infectious diseases and mental health issues. The results showed that mental health issues were not evenly distributed, with a higher emphasis in Nairobi and the Western areas. Infectious diseases and mental health disorders were shown to be strongly correlated, indicating possible connections between these health costs. High accuracy and validity were displayed by the spatial model, which provided insightful information for planning interventions and allocating resources. The distribution of mental health disorders and its relationship to infectious diseases in Kenya are better understood thanks to this study. The results emphasize the necessity of locally focused mental health treatments, especially in high-risk areas. These insights can be used by policymakers to enhance mental health services accessibility, optimize healthcare methods, and create integrated treatment plans for people with co-occurring disorders.

VL  - 13
IS  - 3
ER  -
Copy
|
Download