Over the past two decades, the population of naturalized citizens in the United States has grown at a faster rate than that of native-born citizens, resulting in foreign-born voters composing a substantial share of the national electorate. By 2024, naturalized citizens constituted at least 13% of the electorate despite many long-term eligible residents not pursuing attainment of citizenship. This demographic transformation, coupled with the rising prominence of immigration-related issues, has heightened the importance of understanding the political behavior of naturalized citizens. Previous scholarship has identified a significant gap in voter registration and turnout between naturalized and native-born citizens. However, limited longitudinal studies have been conducted to address questions about the durability of this divide over time. This paper investigates the extent to which nativity and other socio-economic and demographic characteristics shape electoral participation in the United States from 2010 to 2024. Using microdata from the U.S. Census Bureau’s biannual Current Population Survey Voting and Registration Supplement, we employ logistic regression models to evaluate the predictive power of nativity, income, education, race/ethnicity, gender, and age on both registration and turnout. Our analysis directly compares findings from this period with earlier studies covering 1996-2010, allowing us to assess whether participation gaps have narrowed, widened, or persisted. Results show that, while the foreign-born electorate has expanded in both absolute and relative terms, naturalized citizens continue to register and vote at lower rates than their native-born counterparts, even after controlling for socio-economic variables. We further highlight important demographic differences between naturalized and native-born voters, particularly in age distribution, educational attainment, and racial/ethnic composition. These findings confirm the persistence of an electoral participation gap, suggesting structural and institutional factors may continue to limit the full incorporation of naturalized citizens into the U.S. political system. Furthermore, while the salience of immigration policy may influence naturalization rates, this has not translated into an increase likelihood of registering to vote and/or subsequently turning out to vote.
| Published in | Social Sciences (Volume 14, Issue 5) |
| DOI | 10.11648/j.ss.20251405.18 |
| Page(s) | 545-559 |
| Creative Commons |
This is an Open Access article, distributed under the terms of the Creative Commons Attribution 4.0 International License (http://creativecommons.org/licenses/by/4.0/), which permits unrestricted use, distribution and reproduction in any medium or format, provided the original work is properly cited. |
| Copyright |
Copyright © The Author(s), 2025. Published by Science Publishing Group |
Native-Born, Foreign-Born, Voting, Electoral Participation, Naturalized Citizens
U.S. Election Year | Voter Turnout Rate (as percentage of eligible voters) |
|---|---|
2024 | 63.9% |
2022 | 46.2% |
2020 | 66.6% |
2018 | 50.0% |
2016 | 60.1% |
2014 | 36.7% |
2012 | 58.6% |
2010 | 41.8% |
2008 | 62.2% |
2006 | 41.3% |
2004 | 60.7% |
2002 | 40.5% |
Variable | All Citizens Model | Naturalized Citizens Model | ||
|---|---|---|---|---|
coef | std_err | coef | std_err | |
Persons age | 0.03* | (0.000) | 0.02* | (0.001) |
Family Income | 0.06* | (0.001) | 0.05* | (0.003) |
Education_Advanced degree | 2.33* | (0.021) | 1.58* | (0.048) |
Education_Bachelor's degree | 2.01* | (0.016) | 1.14* | (0.039) |
Education_High school grad. or GED | 0.65* | (0.012) | 0.32* | (0.034) |
Education_Some college or Assoc. degree | 1.39* | (0.013) | 0.93* | (0.038) |
Time in Country_Entered between 1950-1964 | -1.12* | (0.100) | ||
Time in Country_Entered before 1950 | -1.04* | (0.169) | ||
Time in Country_Entered between 1965-1985 | -1.48* | (0.081) | ||
Time in Country_Entered in 1986 or later | -1.74* | (0.074) | ||
Length of Stay at Current Address_1-2 years | -0.47* | (0.013) | -0.36* | (0.042) |
Length of Stay at Current Address_3-4 years | -0.23* | (0.014) | -0.13+ | (0.041) |
Length of Stay at Current Address_5 years or longer | 0.03+ | (0.010) | 0.14* | (0.031) |
Length of Stay at Current Address_Less than 1 year | -0.65* | (0.014) | -0.47* | (0.049) |
Gender_Female | 0.19* | (0.008) | 0.10* | (0.024) |
Employment Status_Employed | 0.31* | (0.009) | 0.27* | (0.029) |
Employment Status_Unemployed | 0.16* | (0.019) | 0.34* | (0.068) |
Citizen Status_Native born | -1.82* | (0.021) | ||
Citizen Status_Naturalized | -2.66* | (0.025) | ||
Features | All Citizens Model | Naturalized Citizens Model | ||
|---|---|---|---|---|
coef | std_err | coef | std_err | |
Persons age | 0.03* | (0.000) | 0.02* | (0.001) |
Family Income | 0.07* | (0.001) | 0.05* | (0.003) |
Education_Advanced degree | 2.04* | (0.016) | 1.26* | (0.041) |
Education_Bachelor's degree | 1.80* | (0.013) | 0.95* | (0.035) |
Education_High school grad. or GED | 0.66* | (0.012) | 0.29* | (0.033) |
Education_Some college or Assoc. degree | 1.25* | (0.012) | 0.75* | (0.035) |
Time in Country_Entered between 1950-1964 | -1.72* | (0.090) | ||
Time in Country_Entered before 1950 | -1.90* | (0.136) | ||
Time in Country_Entered between 1965-1985 | -2.02* | (0.075) | ||
Time in Country_Entered in 1986 or later | -2.15* | (0.069) | ||
Length of Stay at Current Address_1-2 years | -0.42* | (0.011) | -0.32* | (0.039) |
Length of Stay at Current Address_3-4 years | -0.20* | (0.011) | -0.11* | (0.037) |
Length of Stay at Current Address_5 years or longer | 0.00* | (0.008) | 0.05* | (0.027) |
Length of Stay at Current Address_Less than 1 year | -0.62* | (0.012) | -0.47* | (0.046) |
Gender_Female | 0.10* | (0.006) | 0.07* | (0.021) |
Employment Status_Employed | 0.16* | (0.008) | 0.15* | (0.026) |
Employment Status_Unemployed | 0.02* | (0.018) | 0.24* | (0.062) |
Citizen Status_Native born | -2.72* | (0.019) | ||
Citizen Status_Naturalized | -3.36* | (0.022) | ||
CPS | Current Population Survey |
CSV | Comma Separated Value |
FBC | Foreign-Born Citizens |
LPR | Lawful Permanent Residents |
NBC | Native-Born Citizens |
USCIS | United States Citizenship and Immigration Services |
| [1] |
Sanchez, G. R., & Frimpong, K. America’s immigrant voters and the 2024 presidential election. Brookings . 2024 Nov 13.
https://www.brookings.edu/articles/americas-immigrant-voters-and-the-2024-presidential-election/ |
| [2] | Nepal, S. Participating in the American Dream: How Naturalized Immigrants are Voting and Running for Office | Bipartisan Policy Center. 2020 Nov 20. |
| [3] |
Afzal, M., & Omosun, F. Who gets to come in: How political engagement shapes views on legal immigration. 2025.
https://www.econstor.eu/bitstream/10419/314938/1/Afzal-Omosun-MPSA-2025-Research-Draft.pdf |
| [4] | Harder, J., & Krosnick, J. A. (2008). Why Do People Vote? A Psychological Analysis of the Causes of Voter Turnout. Journal of Social Issues, 64(3), 525. |
| [5] |
Bass, L. E., & Casper, L. M. Are There Differences in Registration and Voting Behavior Between Naturalized and Native-born Americans? Population Division: US Bureau of the Census. 1999 Feb.
https://www.census.gov/library/working-papers/1999/demo/POP-twps0028.html |
| [6] |
Crissey, S., & File, T. Voting Behavior of Naturalized Citizens: 1996-2010. U.S. Census Bureau. 2012.
https://www.census.gov/content/dam/Census/library/working-papers/2012/demo/crissey-01.pdf |
| [7] | Lopez, A. B., Noe-Bustamante, L., & Hugo, M. Naturalized Citizens Make Up Record One-in-Ten U.S. Eligible Voters in 2020. Pew Research Center. 2020 Feb 26. |
| [8] | Kent, D. (2024, September 19). 1 in 10 eligible voters in the U.S. are naturalized citizens. Pew Research Center. |
| [9] |
File T, Crissey S. Population Characteristics Voting and Registration in the Election of November 2008. 2012 Jul.
https://www.census.gov/library/publications/2012/demo/p20-562rv.html |
| [10] |
U.S. Citizenship and Immigration Services. Naturalization Statistics | USCIS.
www.uscis.gov . 2025 Jan 17. |
| [11] | Zamara, L. Naturalized Population: Characteristics and Trends. Bipartisan Policy Center. 2014 Jun 14. |
| [12] | Bass, L. E., & Casper, L. M. Impacting the Political Landscape: Who Registers and Votes among Naturalized Americans? Political Behavior. 2001; 23(2): 103-30. |
| [13] | Gotta, D. Rock the Naturalized Vote: How Data Can Improve the Political and Civic Inclusion of New Americans - USC Equity Research Institute (ERI). USC Equity Research Institute (ERI). 2024 Oct 8. |
| [14] |
Moslimani, M., & Passel, J. S. What the Data Says about Immigrants in the U.S. Pew Research Center; Pew Research Center. 2024 Sep 27.
https://www.pewresearch.org/short-reads/2024/09/27/key-findings-about-us-immigrants/ |
| [15] | Bass, L. E., & Casper, L. M. Differences in Registering and Voting between Native-Born and Naturalized Americans. Population Research and Policy Review. 2001; 20(6): 483-511. |
| [16] | US Citizenship and Immigration Services. Trends in Naturalization Rates: FY 2018 Update. 2021. |
| [17] | US Citizenship and Immigration Services. Characteristics of People Who Naturalized Between FY 2015 and FY 2019. 2021. |
| [18] | Marschall, M. (2001). Does the Shoe Fit? Urban Affairs Review, 37(2), 227. |
| [19] | Cho, W. K. T., Gimpel, J. G., & Dyck, J. J. (2005). Residential Concentration, Political Socialization, and Voter Turnout. The Journal of Politics, 68(1), 156. |
| [20] | Thomas, N. (1968). Voting Machines and Voter Participation in Four Michigan Constitutional Revision Referenda. The Western Political Quarterly, 21(3), 409. |
| [21] | Barreto, M., Ramirez, R., & Woods, N. Are Naturalized voters driving the California Latino Electorate? Measuring the effect of IRCA Citizens on Latino Voting. Social Science Quarterly. 2005; 86(4): 792-812. |
| [22] | DeSipio, L. Social science literature and the naturalization process. International Migration Review. 1987; 21(2): 390-405. |
| [23] |
Day, J. C., & Holder, K. Voting and Registration in the Election of November 2002. U.S. Census Bureau. 2004 Jul.
https://www.census.gov/library/publications/2004/demo/p20-552.html |
| [24] | Igielnik, R., & Budiman, A. The Changing Racial and Ethnic Composition of the U.S. Electorate. Pew Research Center; Pew Research Center. 2020 Sep 23. |
| [25] |
Jones-Correa, M. A., & Leal, D. L. (2001). Political Participation: Does Religion Matter? Political Research Quarterly, 54(4), 751-770.
https://doi.org/10.1177/106591290105400404 (Original work published 2001). |
| [26] | Immigration Task Force. Immigration Task Force. Bipartisan Policy Center. 2019. |
| [27] | Gonzalez-Barrera, A., & Krogstad, J. M. Naturalization rate among U.S. immigrants up since 2005, with India among the biggest gainers. Pew Research Center. 2018 Jan 18. |
| [28] |
Naturalization Statistics | USCIS. United States Citizenship and Immigration Services. 2021 Sep 17.
https://www.uscis.gov/citizenship-resource-center/naturalization-statistics |
| [29] |
File, T. The Diversifying Electorate-Voting Rates by Race and Hispanic Origin in 2012 (and Other Recent Elections). US Bureau of the Census. 2013.
https://www.census.gov/library/publications/2013/demo/p20-568.html |
| [30] | Frey, W. New voter turnout data from 2022 shows some surprises, including lower turnout for youth, women, and Black Americans in some states. Brookings; Brookings Institute. 2023 May 18. |
| [31] |
Batalova, J., & Marrow, B. Naturalized Citizens in the United States. Migration Policy Institute. 2024 Jul 9.
https://www.migrationpolicy.org/article/naturalization-trends-united-states-2024 |
| [32] | Knight, D. J., & Zhang, B. Residential mobility and persistently depressed voting among disadvantaged adults in a large housing experiment. Proceedings of the National Academy of Sciences. 2024; 121(20). |
| [33] | Fields, G. Why millions of Americans don’t vote in U.S. elections. AP News. 2024 Jan 3. |
| [34] | Rosenberg, S. Why Mexican lawful immigrants have not naturalized. Pew Research Center; Pew Research Center. 2017 Jun 29. |
| [35] |
Singh, S., & Fallon, K. Housing Instability Is a Critical Barrier to Voting Access. Housing Matters. 2024 Oct 23.
https://housingmatters.urban.org/articles/housing-instability-critical-barrier-voting-access |
| [36] | Sanchez, G. Immigration policy could determine the next president of the United States. Brookings. 2024 Mar 4. |
| [37] |
Chen, G., & Rosales-Zeledon, S. Our “Candidate” is Immigration: 2022 Election Results Recap. Aila.org; American Immigration Lawyers Association. 2022 Nov 9.
https://www.aila.org/blog/our-candidate-is-immigration-2022-election-results-recap |
| [38] | Bernal, R. Naturalized citizens fired up to vote this year: Poll. The Hill. 2024 Sep 9. |
APA Style
Irish-Bramble, K. G., Richardson, S. F. (2025). Nativity and Voter Participation 2010 - 2024: Exploring the Electoral Participation Gap Between Foreign-Born and Native-Born Citizen in the United States of America. Social Sciences, 14(5), 545-559. https://doi.org/10.11648/j.ss.20251405.18
ACS Style
Irish-Bramble, K. G.; Richardson, S. F. Nativity and Voter Participation 2010 - 2024: Exploring the Electoral Participation Gap Between Foreign-Born and Native-Born Citizen in the United States of America. Soc. Sci. 2025, 14(5), 545-559. doi: 10.11648/j.ss.20251405.18
@article{10.11648/j.ss.20251405.18,
  author = {Ken Georges Irish-Bramble and Sasha Franchesca Richardson},
  title = {Nativity and Voter Participation 2010 - 2024: Exploring the Electoral Participation Gap Between Foreign-Born and Native-Born Citizen in the United States of America
},
  journal = {Social Sciences},
  volume = {14},
  number = {5},
  pages = {545-559},
  doi = {10.11648/j.ss.20251405.18},
  url = {https://doi.org/10.11648/j.ss.20251405.18},
  eprint = {https://article.sciencepublishinggroup.com/pdf/10.11648.j.ss.20251405.18},
  abstract = {Over the past two decades, the population of naturalized citizens in the United States has grown at a faster rate than that of native-born citizens, resulting in foreign-born voters composing a substantial share of the national electorate. By 2024, naturalized citizens constituted at least 13% of the electorate despite many long-term eligible residents not pursuing attainment of citizenship. This demographic transformation, coupled with the rising prominence of immigration-related issues, has heightened the importance of understanding the political behavior of naturalized citizens. Previous scholarship has identified a significant gap in voter registration and turnout between naturalized and native-born citizens. However, limited longitudinal studies have been conducted to address questions about the durability of this divide over time. This paper investigates the extent to which nativity and other socio-economic and demographic characteristics shape electoral participation in the United States from 2010 to 2024. Using microdata from the U.S. Census Bureau’s biannual Current Population Survey Voting and Registration Supplement, we employ logistic regression models to evaluate the predictive power of nativity, income, education, race/ethnicity, gender, and age on both registration and turnout. Our analysis directly compares findings from this period with earlier studies covering 1996-2010, allowing us to assess whether participation gaps have narrowed, widened, or persisted. Results show that, while the foreign-born electorate has expanded in both absolute and relative terms, naturalized citizens continue to register and vote at lower rates than their native-born counterparts, even after controlling for socio-economic variables. We further highlight important demographic differences between naturalized and native-born voters, particularly in age distribution, educational attainment, and racial/ethnic composition. These findings confirm the persistence of an electoral participation gap, suggesting structural and institutional factors may continue to limit the full incorporation of naturalized citizens into the U.S. political system. Furthermore, while the salience of immigration policy may influence naturalization rates, this has not translated into an increase likelihood of registering to vote and/or subsequently turning out to vote.
},
 year = {2025}
}
TY  - JOUR
T1  - Nativity and Voter Participation 2010 - 2024: Exploring the Electoral Participation Gap Between Foreign-Born and Native-Born Citizen in the United States of America

AU  - Ken Georges Irish-Bramble
AU  - Sasha Franchesca Richardson
Y1  - 2025/10/27
PY  - 2025
N1  - https://doi.org/10.11648/j.ss.20251405.18
DO  - 10.11648/j.ss.20251405.18
T2  - Social Sciences
JF  - Social Sciences
JO  - Social Sciences
SP  - 545
EP  - 559
PB  - Science Publishing Group
SN  - 2326-988X
UR  - https://doi.org/10.11648/j.ss.20251405.18
AB  - Over the past two decades, the population of naturalized citizens in the United States has grown at a faster rate than that of native-born citizens, resulting in foreign-born voters composing a substantial share of the national electorate. By 2024, naturalized citizens constituted at least 13% of the electorate despite many long-term eligible residents not pursuing attainment of citizenship. This demographic transformation, coupled with the rising prominence of immigration-related issues, has heightened the importance of understanding the political behavior of naturalized citizens. Previous scholarship has identified a significant gap in voter registration and turnout between naturalized and native-born citizens. However, limited longitudinal studies have been conducted to address questions about the durability of this divide over time. This paper investigates the extent to which nativity and other socio-economic and demographic characteristics shape electoral participation in the United States from 2010 to 2024. Using microdata from the U.S. Census Bureau’s biannual Current Population Survey Voting and Registration Supplement, we employ logistic regression models to evaluate the predictive power of nativity, income, education, race/ethnicity, gender, and age on both registration and turnout. Our analysis directly compares findings from this period with earlier studies covering 1996-2010, allowing us to assess whether participation gaps have narrowed, widened, or persisted. Results show that, while the foreign-born electorate has expanded in both absolute and relative terms, naturalized citizens continue to register and vote at lower rates than their native-born counterparts, even after controlling for socio-economic variables. We further highlight important demographic differences between naturalized and native-born voters, particularly in age distribution, educational attainment, and racial/ethnic composition. These findings confirm the persistence of an electoral participation gap, suggesting structural and institutional factors may continue to limit the full incorporation of naturalized citizens into the U.S. political system. Furthermore, while the salience of immigration policy may influence naturalization rates, this has not translated into an increase likelihood of registering to vote and/or subsequently turning out to vote.

VL  - 14
IS  - 5
ER  -
Medgar Evers College (CUNY), New York, United States
Biography: Ken Georges Irish-Bramble is an Associate Professor in the Department of Social and Behavioral Sciences at Medgar Evers College (CUNY), the Faculty Director of CUNY ICORP at Medgar Evers College (CUNY), a 2025 Fellow with the Rockefeller Institute of Government’s Institute on Immigrant Integration Research and Policy and the former Interim Director of the Caribbean Research Center at Medgar Evers College. He holds a BA in Political Science from the City University of New York (CUNY); a MA in Comparative Politics from New York University (NYU); a MA in Secondary Education from Pace University and a Ph.D. in Comparative Politics from NYU. Dr. Irish-Bramble is currently pursuing a Master’s degree in International Migration Studies at the CUNY Graduate Center. His publications include Bricks, Ballots, and Bullets: Political and Communal Violence in Jamaica; Retrieving the American Past: A Supplementary reader (2008) and Violence and Power: A Collection of Essays (2018).
Research Fields: Political and Communal Violence, Caribbean-American Diasporic Voting, Caribbean Regional Integration, Voting behavior of Naturalized Citizens, CARICOM Intra-regional migration.
Medgar Evers College (CUNY), New York, United States
Biography: Sasha Franchesca Richardson serves as the Assistant Program Coordinator for CUNY’s Innovative Career Opportunity and Research Program (ICORP) at Medgar Evers College. In her role, she leads undergraduates in the application of advanced data analysis and visualization techniques to Social Science research initiatives. Ms. Richardson possesses a B.S. in Computer Science from Fayetteville State University, an M.S. in Business Analytics from Baruch College, and is preparing to pursue an M.A. in Digital Humanities at The CUNY Graduate Center. Her work is centered on translating complex datasets into policy recommendations, combining academic knowledge with practical applications.
Research Fields: Cultural Analysis, Textual Studies, Social & Cultural Computing, Immigration Studies, Voting Behavior
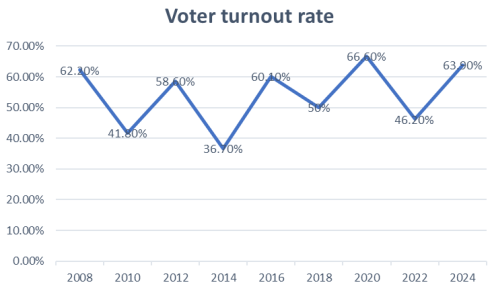
Figure 1. Voter turnout in United States elections.
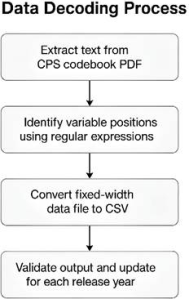
Figure 2. Data Decoding Process.
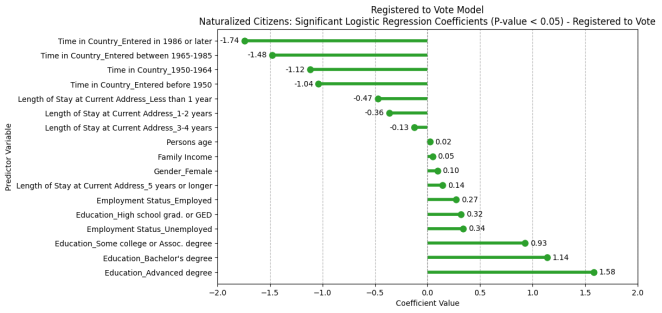
Figure 3. Logistic Regression Coefficients for voter registration among naturalized citizens.
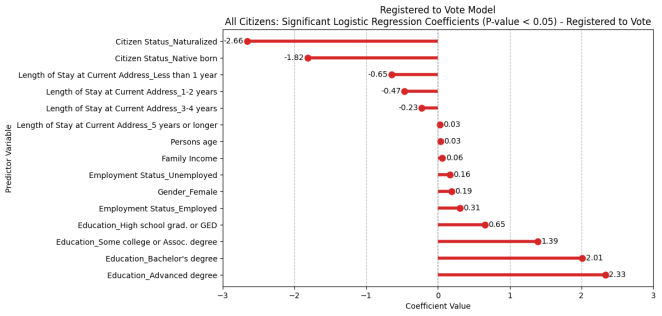
Figure 4. Logistic Regression Coefficients for voter registration among all citizens.
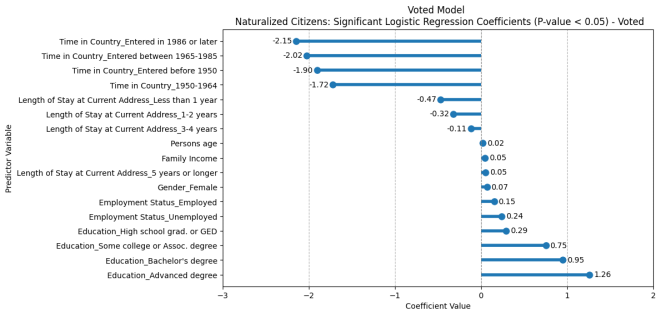
Figure 5. Logistic Regression Coefficients for voting among naturalized citizens.
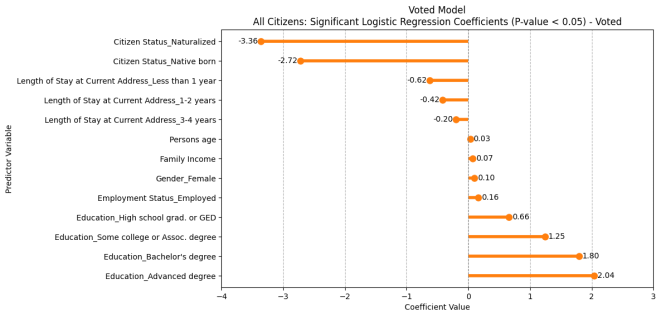
Figure 6. Logistic Regression Coefficients for voting among all citizens.
Information

