Abstract
The convergence of terrestrial wireless and satellite communication systems within Satellite–Terrestrial Integrated Networks (STINs) for sixth-generation (6G) communications has increased the need for accurate and adaptive link performance prediction. Conventional analytical and empirical propagation models often fail to capture the nonlinear effects of atmospheric impairments, particularly rain attenuation in tropical regions. This study evaluates two supervised machine learning algorithms, Random Forest (RF) and Support Vector Machine (SVM), for predicting the signal-to-noise ratio (SNR), a key wireless communication link budget parameter. Rain rate, rain attenuation, and link budget were used as input variables with propagation datasets collected from ten climatically diverse locations across Nigeria. The datasets were partitioned into training, validation, and testing sets using a 70:15:15 ratio, while Bayesian optimization determined the optimal hyper-parameters of both models. Performance was evaluated using Root Mean Square Error (RMSE), Mean Absolute Error (MAE), Mean Squared Error (MSE), coefficient of determination (R2), regression analysis, and actual-versus-predicted time-series comparisons. Results show that both models accurately captured the nonlinear relationship between propagation parameters and SNR across all study locations. However, SVM consistently outperformed RF, recording lower RMSE, MAE, and MSE values in nine of the ten locations and achieving R2 values between 0.99 and 1.00. SVM also tracked severe fading events caused by intense rain attenuation more accurately, whereas RF exhibited larger deviations during deep fades. Minna was the only location where RF produced lower prediction errors. These findings demonstrate that SVM provides superior prediction accuracy and generalization for SNR estimation under tropical propagation conditions, making it a reliable tool for wireless link budget prediction and future 6G satellite–terrestrial network planning.
Keywords
Satellite–Terrestrial Integrated Networks, Wireless Communication, Link Budget, Signal-to-Noise Ratio Optimization, Support Vector Machine, Random Forest, Rain Attenuation, Sixth Generation (6G) Networks
1. Introduction
The continuous growth in demand for high-capacity, reliable, and ubiquitous wireless communication has necessitated the integration of terrestrial wireless and satellite communication systems into unified network architectures
. Wireless communication systems broadly comprise terrestrial wireless links, where transmission occurs between ground-based stations, and satellite communication links, where signals propagate between Earth stations and spaceborne platforms
. Satellite communication is therefore a subset of wireless communication, distinguished by longer propagation paths and unique atmospheric impairments, yet increasingly integrated with terrestrial wireless networks to provide wide-area coverage, service continuity, and network resilience, particularly in regions with limited terrestrial infrastructure
| [3] | P. Wang, J. Zhang, X. Zhang, Z. Yan, B. G. Evans & W. Wang, “Convergence of Satellite and Terrestrial Networks: A Comprehensive Survey”, IEEE Access, 8, 5550–5588, 2020.
https://doi.org/10.1109/ACCESS.2019.2963223 |
[3]
.
In modern and emerging communication paradigms, especially within the framework of sixth-generation (6G) networks, Satellite–Terrestrial Integrated Networks (STINs) have emerged as a critical solution for achieving seamless global connectivity
| [4] | N. Chen, Y. Song, Y. Cao, Z. Sun, B. Zhao, M. Wang, D. He & G. Peng, “Network-Layer Perspectives on Satellite–Terrestrial Integrated Networks in 6G: A Comprehensive Review”, Engineering, 54, 69–92, 2025.
https://doi.org/10.1016/j.eng.2025.05.012 |
[4]
. The terrestrial networks can provide high-speed data service at low cost, satellite-based access is one way to complement the terrestrial-based networks for achieving ubiquitous, 100% geographic coverage. A satellite network is an ideal solution to address such a dilemma. One satellite is able to cover areas of thousands of kilometers in radius instead of several kilometers with a terrestrial base station
. The coexistence and cooperation between terrestrial and satellite networks are of great potential in future communication networks.
. Recent studies emphasize that the performance of such integrated networks is fundamentally constrained by link budget parameters, including free-space path loss, antenna gains, system noise temperature, atmospheric absorption, and rain attenuation. Huang provides a comprehensive review of satellite–terrestrial integrated networks from a network-layer perspective, identifying link reliability and propagation variability as key challenges that directly impact end-to-end system performance in future 6G systems
| [7] | S. L. Huang, “Performance Analysis for Integrated Sensing and Communication Systems in Rainfall Scenarios”, Atmosphere, 16(11): 1249, 2025. |
[7]
.
Accurate link budget modeling and prediction are therefore essential for the efficient design, planning, and optimization of both terrestrial and satellite wireless links. Traditional analytical and empirical propagation models, while widely used, often exhibit limited accuracy in highly dynamic environments due to their reliance on simplified assumptions and region-specific parameters
| [8] | J. A. Azevedo & F. Mendonça, “A Critical Review of the Propagation Models Employed in LoRa Systems”,Sensors, 24(12), 3877, 2024. https://doi.org/10.3390/s24123877 |
[8]
. This limitation is particularly evident in tropical climates, such as , where severe rainfall, high humidity, and atmospheric variability significantly affect microwave, millimeter-wave, and satellite frequency bands
. Highlights that the integration of terrestrial and satellite wireless systems introduces additional complexity in link budget estimation, as heterogeneous propagation conditions and network configurations must be jointly considered.
Recent research within the context of 6G further underscores the need for intelligent and adaptive modeling approaches. Chai demonstrated that efficient resource management and performance optimization in satellite–terrestrial integrated networks are strongly dependent on accurate prediction of link quality metrics derived from link budget calculations, the link budget however determines the received signal power, which in turn influence the signal-to-noise ratio (SNR)
. Similarly, an IEEE reviewidentified propagation uncertainty, spectrum sharing, and dynamic channel conditions as open challenges in integrated wireless networks, reinforcing the inadequacy of static link budget models for next-generation systems
| [11] | A. Gbenga?Ilori, “Artificial Intelligence Empowering Dynamic Spectrum Access in Advanced Wireless Communications: A Comprehensive Overview”, AI (an MDPI open?access journal; includes IEEE?relevant topic coverage and is indexed in engineering databases), vol. 6, no. 6, art. 126, 2025, https://doi.org/10.3390/ai6060126 |
[11]
.
To address these challenges, artificial intelligence (AI) and machine learning techniques have been increasingly adopted for wireless system modeling and prediction. Javaid and co-workers illustrated the potential of AI-driven frameworks in integrated satellite–aerial–terrestrial networks, showing that data-driven models can effectively capture complex nonlinear relationships between environmental factors and link performance
| [12] | A. Javaid, “Leveraging Large Language Models for Integrated Satellite?Aerial?Terrestrial Networks: Recent Advances and Future Directions”, IEEE Open Journal of the Communications Society, Article (2024–2025),
https://doi.org/10.1109/OJCOMS.2024.3522103 |
[12]
. In the context of link budget and SNR prediction, deep neural networks (DNNs) and related artificial intelligence (AI) models offer significant advantages in learning from large datasets of propagation measurements, enabling improved prediction accuracy under diverse and time-varying conditions. Faster decision making is one of the primary advantages of AI on satellites is the capacity to make judgements more quickly. AI can make real-time judgements by analyzing data on the satellite. This is especially useful for applications that demand rapid reactions, such as disaster response when time is critical
| [13] | H. Ekta, A comprehensive systematic literature review on artificial intelligence for error correction and modulation schemes in next-generation satellite communications”, SpringerArtificial Intelligence Review, 2025.
https://doi.org/10.1007/s10462-025-11317-4 |
[13]
.
Furthermore, propagation impairments such as rain attenuation remain dominant factors affecting link budget degradation in high-frequency satellite and terrestrial wireless systems. Cano and colleagues addressed this issue through adaptive gateway diversity techniques for high-throughput satellite systems, highlighting the importance of accurate attenuation modeling for maintaining link or signal availability
| [14] | G. Cano, “AIRIS2: A Smart Gateway Diversity Algorithm for Very High?Throughput Satellite Systems”, IEEE Wireless Communications Letters, 14(7), 2189–2193, 2025.
https://doi.org/10.1109/LWC.2025.3565705 |
[14]
. These findings further motivate the development of AI-based predictive models capable of incorporating atmospheric and climatic variables into link budget estimation frameworks
| [15] | A. Singh, “Rain attenuation modelling for millimetre-wave communication links in tropical climates,”. IEEE Access, vol. 8, PP.123456–123465, 2020. |
[15]
.
Conceptually, the relationship between terrestrial wireless and satellite communication within an integrated network can be likened to transportation systems: wireless communication represents road transport in general, terrestrial wireless communication corresponds to vehicles operating on land, and satellite communication resembles aircraft operating in airspace
| [16] | S. B. R. Tirmizi, Y. Chen, S. Lakshminarayana, W. Feng & A. A. Khuwaja, “Hybrid Satellite–Terrestrial Networks toward 6G: Key Technologies and Open Issues”, Sensors, 22(21), 8544, 2022. https://doi.org/10.3390/s22218544 |
| [17] | Basir, R., Khan, H. Z., Fakhar, U., et al. (2026). Synergizing User Association: A Comprehensive Survey of Satellite–Terrestrial Integrated Networks. Computer Communications. Explains that STINs provide enhanced coverage, reliability, quality of service, and seamless end-to-end connectivity by combining satellite and terrestrial infrastructures.
https://doi.org/10.1016/j.comcom.2026.108489 |
[16, 17]
. Although these systems differ in operational characteristics and constraints, they are inherently complementary. Their integration enables robust end-to-end communication, just as combined land and air transport systems enhance overall mobility. This analogy reinforces the necessity of unified modeling approaches, such as AI-based link budget prediction, to support efficient operation across heterogeneous wireless environments
| [17] | Basir, R., Khan, H. Z., Fakhar, U., et al. (2026). Synergizing User Association: A Comprehensive Survey of Satellite–Terrestrial Integrated Networks. Computer Communications. Explains that STINs provide enhanced coverage, reliability, quality of service, and seamless end-to-end connectivity by combining satellite and terrestrial infrastructures.
https://doi.org/10.1016/j.comcom.2026.108489 |
[17]
.
The International Telecommunication Union–Radiocommunication Sector (ITU-R) provides standardized models for rain attenuation prediction uses ITU-R P.838 (P.838-3, 2005) for specific attenuation
and P.837 (P.837-7, 2017) for rain rate distributions
| [19] | ITU-R P.837-7, I.-R. (2017). Characteristics of precipitation for propagation modelling. International Telecommunication Union — Radiocommunication Sector (ITU-R). |
[19]
, yet these models may require localization or enhancement when applied to non-temperate regions. Empirical studies within Nigeria have explored rain rate distributions and attenuation effects for satellite and terrestrial links, underscoring the necessity for region-specific modelling frameworks
| [20] | R. Patel, “Machine learning-based prediction of rain attenuation for millimetre-wave links in tropical environments”, IEEE Transactions on Vehicular Technology, vol. 70, (no. 5), pp. 4567–4576, 2021. |
| [21] | A. Dalia, “Study of rain attenuation effects for 5G Mmwave cellular communication in tropical location”, 2018. The,
https://doi.org/10.1049/iet-map.2017.1029www.ietdl.org |
[20, 21]
.
Concurrently, the rapid evolution of artificial intelligence (AI), machine learning (ML), and deep learning (DL) techniques has transformed data-centric modelling across scientific domains. Supervised learning models such as support vector machines (SVM) and random forests (RF) offer robust regression and classification capabilities
, while deep learning architectures including convolutional neural networks (CNNs) and long short-term memory (LSTM) networks are capable of capturing complex spatial and temporal dependencies within large scale datasets. These techniques have been successfully applied to wireless network optimization, channel modelling, and propagation prediction problems
| [23] | V. A. Akpan, E. C. Njoku and E. I. Obi, “Slice-Specific Learning Models for Intrusion Detection in 5G Telecommunication Networks”, International Journal of Wireless Communication and Mobile Computing, vol. 12, no. 2, pp. 93 – 118, 2025.
https://doi.org/10.11648/j.wcmc.20251202.14 |
| [24] | F. Ahmed-Ade, V. A. Akpan and E. O. Ogolo, “OFDM Variants and FPGA Implementation: A Comprehensive Analysis of Algorithm Comparison, Optical Wireless Integration, Neural Network Mapping, and FPGA Realization”, American Journal of Embedded Systems and Applications, vol. 11, no. 1, pp. 16 – 38, 2025.
https://doi.org/10.11648/j.ajesa.20251101.13 |
| [25] | F. Ahmed-Ade, V. A. Akpan, E. O. Ogolo and D. J. Koffa, “CNN and Hybrid CNN-LSTM Artificial Intelligence-Based Algorithms for Adaptive Channel Estimation of Optical Plus Filtered OFDM For LTE Telecommunication Systems Design,” Journal of Electronics and Communication Engineering, vol. 12, no. 2, pp. 5 – 33, 2026.
https://doi.org/10.35629/5941-12020533 |
| [26] | F. Ahmed-Ade, V. A. Akpan, M. A. Umeche, D. Y. Odoma and N. M. Esuga-Mopah, “Adaptive Channel Estimation of Beamforming O+F OFDM Signal in 6G Optical Wireless Communication Systems using Deep Machine Learning Techniques with FPGA Implementation”, Journal of Electronics and Communication Engineering, vol. 12, no. 4, pp. 1 – 32, 2026.
https://doi.org/10.35629/5941-12040132 |
[23-26]
.
Machine learning enables systems to learn from data and improve performance over time without explicit programming
| [27] | V. A. Akpan and G. D. Hassapis, “Training dynamic feedforward neural networks for online nonlinear model identification and control applications”, International Reviews of Automatic Control: Theory & Applications,., 4(3), 335–350, 2011. |
| [28] | V. A. Akpan, “Nonlinear model identification and adaptive model predictive control using neural networks”. ISA Transactions, 5(2), 177–194, 2011.
https://doi.org/10.1016/j.isatra.2010.12.007 |
[27, 28]
. Within this paradigm, models are broadly categorized into discriminative and generative approaches. Discriminative models focus on predicting outputs or classifying data based on observed inputs, whereas generative models learn the underlying data distribution to produce new, realistic samples. This generative capability is essential for tasks such as speech synthesis, visual object recognition, and text generation, allowing meaningful information to be extracted from complex sensory data.
Training such models, particularly large-scale deep learning and generative architectures, requires extensive datasets. For example, Large Language Models (LLMs) leverage vast natural language corpora to achieve advanced natural language understanding and generation, while generative deep learning models are capable of producing human-like synthetic images
| [29] | V. A. Akpan, D. A. Adegoke, E. A. Adejayan and K. A. Adepoju, “Artificial Intelligence-Based YOLOv3 using DarkNet-53 Deep Convolutional Neural network Model Architecture for Automatic Vehicle Inventory System Design with a Dynamic Relational Database System and Google Cloud Storage”, Journal of Electrical and Computer Engineering Innovations, vol. 14, no. 2, pp. 435 – 472, 2026.
https://doi.org/10.22061/jecei.2026.12552.889 |
| [30] | V. A. Akpan and N. O. Raji, “Development of Deep Convolutional Neural Network Algorithms Based on DenseNet Model for Adaptive Classification of Chest Diseases”, International Journal of Biophotonics and Biomedical Engineering, vol. 5, no. 2, Article 9, pp. 1 – 28, 2025.
https://doi.org/10.57647/ijbbe.2025.0502.09 |
[29, 30]
. The multi-layered, non-linear processing structure of deep learning architectures makes them particularly effective for modelling complex data distributions. As a subset of AI, machine learning architectures identify hidden patterns and relationships within training data, with deep learning techniques being especially well-suited for high-fidelity data generation and representation learning
.
2. Related Works
Many works have been carried out by researchers to improve the quality of service in wireless and satellite network. Crane carried out research on prediction of the effect of rain on satellite communication, in temperate region, his research shows that the effect can be calculated if the distribution of rain intensity is known in both time and space
.Furthermore, Ghorbanzadeh and co-researchers worked on Cellular Communications Systems in Congested Environments Resource Allocation and End-to-End Quality of Service Solutions with MATLAB, his work was to manage the concept of radio resources allocation for cellular communication system operating in congested and contested environment with emphasis on the end- to– end quality of service (QoS)
| [33] | Ghorbanzadeh, M., Abdelhadi, A., & Clancy, C. (2017).Cellular Communications Systems in CongestedEnvironments: Resource Allocation and End-to-End Quality of Service Solutions with MATLAB. Springer International Publishing.
https://doi.org/10.1007/978-3-319-46267-7 |
[33]
.
In another development, Harb and colleagues carried out severalresearches on quality of service improvement in weather impacted satellite using markov model to predict weather attenuation to maintain quality of service via an intelligent awareness control system
| [34] | K. Harb, A. Srinivasan, B. Cheng and C. Huang, ‘Prediction method to maintain QoS in weather-impacted wireless and satellite networks’, In Proceedings of the IEEE international conference on Systems, Man and Cybernetics (SMC), pp. 4008 – 4013, 2007. https://doi.org/10.1109/ICSMC.2007.4414255 |
| [35] | K. Harb, A. Srinivasan, B. Cheng and C. Huang, ‘QoS in weather-impacted satellite networks’, In proceedings of the IEEE Pacific Rim Conference on Communications, Computers and Signal Processing. (PACRIM 2007) pp. 178 – 181, 2007. |
| [36] | K. Harb, A. Srinivasan, B. Cheng and C. Huang, ‘Intelligent weather aware scheme for satellite systems’, IEEE International Conference on Communications (ICC), pp. 1930 – 1936, 2008. https://doi.org/ 10.1109/ICC.2008.370 |
| [37] | K. Harb, F. R. Yu, P. Dakhal and A. Srinivasan, ‘An intelligent QoS control system for satellite networks based on Markovian weather prediction’, IEEE Vehicular Technology Conference (VTC 2010- Fall), Ottawa, Ontario, Canada, pp. 1 – 5. 2010. https://doi.org/10.1109/VETECF.2010.5594097 |
| [38] | K. Harb, F. R. Yu, P. Dakhal and A. Srinivasan, “Performance Evolution in Satellite Communication Networks Along with Markovian Channel Prediction,”Journal of Wireless Networking and Communications, vol. 2, no. 5, pp. 143 – 157, 2012. https://doi.org/10.5923/j.jwnc.20120205.09 |
[34-38]
. Similarly, Dhafer and co-workers also carried out a research to simplify the factors for ad hoc network on mobile phones using fuzzy techniques, it was concluded that higher throughput does not usually mean high quality of service
| [39] | R. Z. Dhafer, S. Thulfiqar, A. Aldeen and A. Al-Wahab, ‘Simplified the QoS factor for the ad hoc network using fuzzy technique’, International Journal of Communications, Network and System Sciences, Vol. 6, pp. 381 – 387, 2013.
https://doi.org/10.4236/ijcns.2013.69041 |
[39]
.
Kim worked on Matlab deep learning with machine learning, neural network and artificial intelligence, book provides a strong practical foundation for neural network architecture for regression and prediction, backpropagation-based training algorithms, deep learning implementation in MATLAB, CNN architectures that can be adapted for wireless communication datasets and MATLAB programming techniques for developing AI models
. Although the examples focus mainly on image recognition, the same deep learning principles can be applied to predicting link budget, SNR, rain attenuation, and other wireless communication parameters by replacing image data with your communication dataset.
Gbenga-Ilori investigated the application of artificial intelligence (AI) in empowering dynamic spectrum access (DSA) for advanced wireless communication systems
| [11] | A. Gbenga?Ilori, “Artificial Intelligence Empowering Dynamic Spectrum Access in Advanced Wireless Communications: A Comprehensive Overview”, AI (an MDPI open?access journal; includes IEEE?relevant topic coverage and is indexed in engineering databases), vol. 6, no. 6, art. 126, 2025, https://doi.org/10.3390/ai6060126 |
[11]
. The authors reported that cognitive radio (CR) technology has become a vital approach for improving spectrum utilization through dynamic spectrum access mechanisms. They further observed that conventional spectrum management techniques are increasingly constrained by the growing complexity of modern wireless communication environments. Consequently, deep learning (DL) and reinforcement learning (RL) algorithms have emerged as effective AI techniques for enhancing spectrum sensing, resource allocation (RA), and cooperative network management. The study concluded that these AI-driven approaches significantly improve adaptive learning capabilities, spectrum sensing accuracy, detection performance, and data processing efficiency, thereby enhancing the overall performance of wireless communication networks.
3. Research Methodology
The procedure begins with the acquisition and preprocessing of rainfall and satellite communication datasets. Rain attenuation is subsequently estimated using SST and incorporated into the link budget model. Machine learning and deep learning algorithms are then developed and comparatively evaluated using standard statistical performance metrics.
Table 1. Data collection site location and State, geographical and climatic zone, latitude, longitude and altitude.
S/N | Data Collection Site Location and State | Geographical and Climatic Zone | Latitude (°N) | Longitude (°E) | Altitude (m) |
1 | Abuja, Federal Capital Territory (FCT) | North Central geopolitical zone, Tropical Savannah climate zone | 9.0667 | 7.4833 | 536 |
2 | Akure, Ondo State | South West geopolitical zone, Tropical Rainforest climate zone | 7.25 | 5.2 | ~300–400 (varies) |
3 | Bauchi, Bauchi State | North East geopolitical zone, Tropical Dry climate zone (Sahel) | 10.3167 | 9.8333 | ~600–700 (varies) |
4 | Enugu, Enugu State | South East geopolitical zone, Tropical Rainforest climate zone | 6.45 | 7.5 | ~200–300 (varies) |
5 | Jos, Plateau State | North Central geopolitical zone, Highland climate zone | 9.9167 | 8.8833 | ~1,200–1,300 (varies) |
6 | Oshodi, Lagos State | South West geopolitical zone, Tropical Rainforest climate zone | 6.55 | 3.3333 | ~10–20 (varies) |
7 | Makurdi, Benue State | North Central geopolitical zone, Tropical Savannah climate zone | 7.7333 | 8.5167 | ~100–200 (varies) |
8 | Minna, Niger State | North Central geopolitical zone, Tropical Savannah climate zone | 9.6167 | 6.5667 | ~200–300 (varies) |
9 | Port Harcourt, Rivers State | South South geopolitical zone, Tropical Rainforest climate zone | 4.7833 | 7.0167 | ~10–20 (varies) |
10 | Yola, Adamawa State | North East geopolitical zone, Tropical Savannah climate zone | 9.2333 | 12.4667 | ~200–300 (varies) |
3.1. Research Design
This study adopts an experimental and comparative research design involving:
1) Collection of five-year rainfall datasets with one-minute integration time,
2) Estimation of rain attenuation using the Synthetic Storm Technique (SST),
3) Development of empirical link budget and signal-to-Noise Ratio (SNR) datasets,
4) Design and training of machine learning models,
5) Design and training of deep learning architectures,
6) Comparative performance evaluation of all developed models.
The methodology integrates both deterministic propagation models and data-driven intelligent models to improve predictive reliability under tropical weather conditions.
3.2. Study Area
The study covers ten states across Nigeria representing the six geo-climatic zones to ensure climatic diversity and spatial representation of rainfall characteristics as listed in
Table 1. The selected states include: Abuja, Akuire, Bauchi, Enugu, Jos, lagos, Makurdi, Minna, Port Harcourt, Yola from the six geoclimatic zones.
The locations on
Table 1 were selected because of variations in rainfall intensity, climatic conditions, atmospheric humidity, geographical terrain, tropical propagation characteristics. Southern Nigeria experiences higher rainfall intensity and rain attenuation compared to northern regions, making the selected locations suitable for comparative propagation analysis.
3.3. Data Collection
3.3.1. Rainfall Data Acquisition
Five-year rainfall datasets covering the period from 08/08/2007 12:50 to 17/04/2012 12:50 were obtained from the Nigerian Meteorological Agency (NiMet), Tropospheric Data Acquisition Network (TRODAN)/Tropical Rainfall Measuring Mission (TRMM) satellite rainfall databases, National Agency for Space Administration (NASA) precipitation datasets, local meteorological stations, and ITU rainfall databases where applicable. The datasets contained rain rate measurements with a five-minute integration time, which were converted to equivalent one-minute rain rates using the ITU-R recommended empirical conversion model. Other parameters obtained from the datasets included rainfall duration, rainfall intensity, and seasonal precipitation characteristics.
3.3.2. Project Site and Study Stations
The results presented in this study are based on TRODAN data collected and managed by the Centre for Atmospheric Research (CAR), National Space Research and Development Agency (NASRDA), Federal Ministry of Science and Technology, Anyigba, Nigeria.
The study utilized data obtained from the Abuja meteorological station located in the Federal Capital Territory (FCT), Nigeria. The station details are as follows: Station is Abuja; Station Code is ABJ; Latitude is 9.0667 °N; Longitude is 7.4833 °E; Altitude is 536 m.
The dataset header contains thirteen rows, beginning with the date and time recorded in the same cell using the format ddmmyyyyhhmm (which implies days months years hours minutes). The second row specifies the CR1000 record, which represents the data logger type used for data acquisition. The third row contains the CR1000 battery voltage information, while the fourth row introduces the meteorological parameters. The meteorological parameters recorded include: 1). Rain Rate (mm); 2). Solar Radiation (SlrW) in W/m2; 3). Air Temperature (AirTC) in °C; 4). Relative Humidity (RH) in %; 5). Soil Temperature (T107) in °C; 6). Wind Speed (WS) in m/s; 7). Wind Direction in degrees; 8). Barometric Pressure (BarPress) in mbar; 9). Volumetric Water Content (VW ×100); and 10). PA_us conversion for unified soil measurements related to volumetric water content.
Each column of the dataset also contains the serial number corresponding to the recorded data entries.
Figure 1 and
Figure 2 shows a laboratory equipment setup and the data collection work station respectively. The five-minute rain rate data obtained from TRODAN were converted to equivalent one-minute rain rate values using the ITU-R P.530 recommended conversion model
. This conversion was necessary because one-minute integration time provides a more accurate representation of short-term rainfall fluctuations and is widely recommended for rain attenuation prediction and microwave.
Figure 1. The laboratory equipment setup.
Figure 2. The data collection work station.
Figure 3. Schematic diagram of Rain structure for Synthetic Storm Technique.
3.3.3. Rain Attenuation Estimation Using Synthetic Storm Technique (SST)
The Synthetic Storm Technique (SST) was adopted for rain attenuation estimation due to its effectiveness in transforming rain rate time-series data into attenuation statistics. The Synthetic Storm Technique (SST), shown in
Figure 3, is a geometry used to estimate rain attenuation along an Earth-to-satellite communication path. The SST model has been widely validated for tropical propagation studies and has demonstrated improved attenuation prediction accuracy when compared with conventional empirical models. The SST method is very useful for designing communication satellite systems and improving their performance for calculating rain attenuation over a satellite path
| [43] | J. S. Ojo, V. A. Akpan, O. G. Ajileye and O. L. Ojo, O. L. “QoS Improvement Using Intelligent Algorithm Under Dynamic Tropical Weather for Earth-Space Satellite Applications,” International Journal of Computer & Information Engineering, vol. 11, no. 9, pp. 1104 – 1110, 2017. Available:
https://waset.org/publications/10008802/qos-improvement-using-intelligent-algorithm-under-dynamic-tropical-weather-for-earth-space-satellite-applications |
| [44] | O. G. Ajileye, J. S. Ojo and V. A. Akpan, V. A. (2026): Comparative Analysis of Machine Learning Algorithms for Good Quality of Service on Terrestrial and Satellite Network Systems Over Nigeria,” International Journal of Networks and Communications, vol. 15, no. 1, pp. 1 – 12, 2026.
https://doi.org/10.5923/j.ijnc.20261501.01 |
[43, 44]
. During rain, the troposphere’s vertical structure of the troposphere separates into two layers. A is the rain layer and B is the melting layer as shown in
Figure 2[45-48].
The Synthetic Storm Technique is a physical–mathematical radio propagation model used to generate reliable rain attenuation time-series by converting rain rate time-series measured at a specified location into corresponding rain attenuation time-series
| [45] | E. Matricciani, ‗Physical-mathematical model of the dynamics of rain attenuation based on rain rate time series and a two-layer vertical structure of precipitation‘, Radio Science, Vol. 31, No. 2, pp. 281-295, 1996. https://doi.org/10.1029/95RS03129 |
| [46] | E. Matricciani, “Global formulation of the Synthetic Storm Technique to calculate rain attenuation only from rain rate probability distributions,” In the Proceedings of the 2008 IEEE Antennas and Propagation Society International Symposium, San Diego, CA, USA, 5 – 11 July, 2008, pp. 1 – 4, 2008. https://doi.org/10.1109/APS.2008.4619006 |
| [47] | R. Nalinggam, W. Ismail, J. S. Mandeep, M. T. Islam, K. Y. You, A. M. Al-Hetar and T. A. Rahman, “Development of rain attenuation model for Southeast Asia equatorial climate,” IET Communications, 7(10), 1008–1014, 2013.
https://doi.org/10.1049/iet-com.2012.0298 |
| [48] | M. R. Islam, Y. A. Abdulrahman and T. A. Rahman, “An improved ITU-R rain attenuation prediction model over terrestrial microwave links in tropical region,” EURASIP Journal on Wireless Communications and Networking, 2012, Article 189, 2012. https://doi.org/0.1186/1687-1499-2012-189 |
[45-48]
. The technique requires local meteorological and propagation parameters such as rain rate, the length of the signal path through the rain cell, and the rain cell velocity at the study location.
Furthermore, the SST method can be applied to generate rain attenuation time-series for any operating frequency and signal polarization, as well as for slant propagation paths above approximately 10°, provided that the assumption of long-term isotropy of the rainfall spatial field is satisfied. The SST approach is particularly valuable in the design and performance evaluation of satellite communication systems, especially for the estimation of rain attenuation along satellite propagation paths.
During rainfall events, the vertical structure of the troposphere is generally divided into two distinct layers: the rain layer (Layer A) and the melting layer (Layer B), as illustrated in
Figure 3. According to Matricciani’s two-layer Synthetic Storm Technique, the vertical precipitation structure is represented as follows
| [45] | E. Matricciani, ‗Physical-mathematical model of the dynamics of rain attenuation based on rain rate time series and a two-layer vertical structure of precipitation‘, Radio Science, Vol. 31, No. 2, pp. 281-295, 1996. https://doi.org/10.1029/95RS03129 |
| [46] | E. Matricciani, “Global formulation of the Synthetic Storm Technique to calculate rain attenuation only from rain rate probability distributions,” In the Proceedings of the 2008 IEEE Antennas and Propagation Society International Symposium, San Diego, CA, USA, 5 – 11 July, 2008, pp. 1 – 4, 2008. https://doi.org/10.1109/APS.2008.4619006 |
[45, 46]
:
(a). Layer A: the lower liquid-rain layer, extending from the ground to height

and
(b). Layer B: the melting layer above it, extending from

to

with an assumed thickness of about 0.4 km.
The rain rate measured by the ground rain gauge is assigned to Layer A; where R is the measured one-minute rain rate in mm/h, apparent rain rate in Layer B; Layer B contains melting hydrometeors—a mixture of ice, water and partially melted particles. These particles cause more microwave attenuation than ordinary liquid raindrops associated with the same precipitation flux.
Matricciani therefore represents their attenuation effect using an equivalent or apparent rain rate,

rather than treating

as an independently measured rainfall rate
| [45] | E. Matricciani, ‗Physical-mathematical model of the dynamics of rain attenuation based on rain rate time series and a two-layer vertical structure of precipitation‘, Radio Science, Vol. 31, No. 2, pp. 281-295, 1996. https://doi.org/10.1029/95RS03129 |
| [46] | E. Matricciani, “Global formulation of the Synthetic Storm Technique to calculate rain attenuation only from rain rate probability distributions,” In the Proceedings of the 2008 IEEE Antennas and Propagation Society International Symposium, San Diego, CA, USA, 5 – 11 July, 2008, pp. 1 – 4, 2008. https://doi.org/10.1109/APS.2008.4619006 |
[45, 46]
. The relationship is
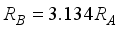
. Thus, the apparent rain rate in the melting layer is 3.134 times the rain rate in the liquid-rain layer.
3.3.4. Calculating Attenuation Using Synthetic Storm Techniques
Traditional empirical rain attenuation models, particularly the ITU-R recommendations, have been widely adopted for the design and analysis of satellite and terrestrial communication links because of their simplicity and global applicability. However, several studies have shown that these models exhibit limited prediction accuracy in tropical regions due to their reliance on generalized global datasets and simplified assumptions regarding rainfall distribution, rain height, and attenuation characteristics
| [47] | R. Nalinggam, W. Ismail, J. S. Mandeep, M. T. Islam, K. Y. You, A. M. Al-Hetar and T. A. Rahman, “Development of rain attenuation model for Southeast Asia equatorial climate,” IET Communications, 7(10), 1008–1014, 2013.
https://doi.org/10.1049/iet-com.2012.0298 |
| [48] | M. R. Islam, Y. A. Abdulrahman and T. A. Rahman, “An improved ITU-R rain attenuation prediction model over terrestrial microwave links in tropical region,” EURASIP Journal on Wireless Communications and Networking, 2012, Article 189, 2012. https://doi.org/0.1186/1687-1499-2012-189 |
| [49] | M. A. Sodunke, J. S. Ojo and A. De, “Study of the seasonal characteristics of rainfall rate in Southwestern Nigeria and its effect on induced attenuation in earth-satellite communications,”Journal of Atmospheric and Solar-Terrestrial Physics, vol. 263, Article no: 106331, 2024.
https://doi.org/10.1016/j.jastp.2024.106331 |
| [50] | A. I. O. Yussuff, I. E. Koleoso and N. H. H. Khamis, “Investigating rain attenuation models for satellite links in tropical Nigeria,” Indonesian Journal of Electrical Engineering and Informatics (IJEEI), vol. 6, no. 1, pp. 61 – 69, 2018.
https://doi.org/10.11591/ijeei.v6i1.263 |
[47-50]
. Tropical environments are characterized by intense convective rainfall, large raindrop sizes, high rainfall variability, and pronounced spatial and temporal inhomogeneity, resulting in attenuation characteristics that differ significantly from those observed in temperate climates. Consequently, the ITU-R models frequently underestimate or overestimate rain attenuation when applied to tropical locations, leading to inaccurate link budget estimation and reduced communication reliability
| [47] | R. Nalinggam, W. Ismail, J. S. Mandeep, M. T. Islam, K. Y. You, A. M. Al-Hetar and T. A. Rahman, “Development of rain attenuation model for Southeast Asia equatorial climate,” IET Communications, 7(10), 1008–1014, 2013.
https://doi.org/10.1049/iet-com.2012.0298 |
| [48] | M. R. Islam, Y. A. Abdulrahman and T. A. Rahman, “An improved ITU-R rain attenuation prediction model over terrestrial microwave links in tropical region,” EURASIP Journal on Wireless Communications and Networking, 2012, Article 189, 2012. https://doi.org/0.1186/1687-1499-2012-189 |
| [49] | M. A. Sodunke, J. S. Ojo and A. De, “Study of the seasonal characteristics of rainfall rate in Southwestern Nigeria and its effect on induced attenuation in earth-satellite communications,”Journal of Atmospheric and Solar-Terrestrial Physics, vol. 263, Article no: 106331, 2024.
https://doi.org/10.1016/j.jastp.2024.106331 |
| [50] | A. I. O. Yussuff, I. E. Koleoso and N. H. H. Khamis, “Investigating rain attenuation models for satellite links in tropical Nigeria,” Indonesian Journal of Electrical Engineering and Informatics (IJEEI), vol. 6, no. 1, pp. 61 – 69, 2018.
https://doi.org/10.11591/ijeei.v6i1.263 |
[47-50]
. Several researchers have therefore proposed modifications to the ITU-R models or developed region-specific prediction models for tropical countries, including Nigeria, Malaysia, and other equatorial regions, to improve prediction accuracy
| [47] | R. Nalinggam, W. Ismail, J. S. Mandeep, M. T. Islam, K. Y. You, A. M. Al-Hetar and T. A. Rahman, “Development of rain attenuation model for Southeast Asia equatorial climate,” IET Communications, 7(10), 1008–1014, 2013.
https://doi.org/10.1049/iet-com.2012.0298 |
| [48] | M. R. Islam, Y. A. Abdulrahman and T. A. Rahman, “An improved ITU-R rain attenuation prediction model over terrestrial microwave links in tropical region,” EURASIP Journal on Wireless Communications and Networking, 2012, Article 189, 2012. https://doi.org/0.1186/1687-1499-2012-189 |
| [49] | M. A. Sodunke, J. S. Ojo and A. De, “Study of the seasonal characteristics of rainfall rate in Southwestern Nigeria and its effect on induced attenuation in earth-satellite communications,”Journal of Atmospheric and Solar-Terrestrial Physics, vol. 263, Article no: 106331, 2024.
https://doi.org/10.1016/j.jastp.2024.106331 |
| [50] | A. I. O. Yussuff, I. E. Koleoso and N. H. H. Khamis, “Investigating rain attenuation models for satellite links in tropical Nigeria,” Indonesian Journal of Electrical Engineering and Informatics (IJEEI), vol. 6, no. 1, pp. 61 – 69, 2018.
https://doi.org/10.11591/ijeei.v6i1.263 |
[47-50]
. Nevertheless, these modified empirical models remain constrained by fixed mathematical formulations and are unable to adequately capture the complex nonlinear relationships among rainfall intensity, atmospheric conditions, propagation parameters, and signal attenuation. Although modified ITU-R models have improved rain attenuation prediction in tropical regions, they remain constrained by fixed empirical formulations and are unable to adequately model the complex nonlinear propagation characteristics of tropical environments. Consequently, Random Forest (RF) and Support Vector Machine (SVM) provide a more robust and accurate data-driven alternative for link budget prediction.
Calculating rain attenuation using Synthetic Storm Techniques (SST) involves converting a local, time-based rain rate series into a path-based attenuation series by simulating storm movement, incorporating storm speed, path length, and dual-layer rain structures (rain layer + melting layer) for accuracy, using ITU-R models for specific attenuation

to link rain rate to dB/km, and validating the resulting attenuation time series against measured data for radio link design, particularly useful when real path data is unavailable
| [18] | ITU-R P.838-3, ‘International Telecommunication Union, Recommendation ITU-R P.838-3: Specific attenuation model for rain for use in prediction methods’, Geneva: ITU, 2005. Available:
https://www.itu.int/dms_pubrec/itu-r/rec/p/R-REC-P.838-3-200503-I!!PDF-E.pdf |
| [19] | ITU-R P.837-7, I.-R. (2017). Characteristics of precipitation for propagation modelling. International Telecommunication Union — Radiocommunication Sector (ITU-R). |
| [42] | ITU-R P.838-2 (ITU-R, 201/3), “Specific attenuation model for rain for use in prediction methods,” Recommendation ITU-R P.838-2, pp. 1 – 5, 2003. Available:
https://www.itu.int/dms_pubrec/itu-r/rec/p/R-REC-P.838-2-200304-S!!PDF-E.pdf |
| [43] | J. S. Ojo, V. A. Akpan, O. G. Ajileye and O. L. Ojo, O. L. “QoS Improvement Using Intelligent Algorithm Under Dynamic Tropical Weather for Earth-Space Satellite Applications,” International Journal of Computer & Information Engineering, vol. 11, no. 9, pp. 1104 – 1110, 2017. Available:
https://waset.org/publications/10008802/qos-improvement-using-intelligent-algorithm-under-dynamic-tropical-weather-for-earth-space-satellite-applications |
| [45] | E. Matricciani, ‗Physical-mathematical model of the dynamics of rain attenuation based on rain rate time series and a two-layer vertical structure of precipitation‘, Radio Science, Vol. 31, No. 2, pp. 281-295, 1996. https://doi.org/10.1029/95RS03129 |
| [46] | E. Matricciani, “Global formulation of the Synthetic Storm Technique to calculate rain attenuation only from rain rate probability distributions,” In the Proceedings of the 2008 IEEE Antennas and Propagation Society International Symposium, San Diego, CA, USA, 5 – 11 July, 2008, pp. 1 – 4, 2008. https://doi.org/10.1109/APS.2008.4619006 |
| [51] | A. K. Lwas, M. R. Islam, J. Chebil, M. H. Habaebi, A. F. Ismail, A. Zyoud and H. Dao, “Rain Attenuation Analysis Using Synthetic Storm Technique in Malaysia,” In the Proceedings of the 5th International Conference on Mechatronics (ICOM’13), IOP Conference Series: Material Science and Engineering, vol. 53, no. 012045, pp. 1 – 7, 2013.
https://doi.org/10.1088/1757-899X/53/1/012045 |
| [52] | D. Nandi, F. Pérez-Fontán, V. Pastoriza-Santos and F. Machado, “Application of synthetic storm technique for rain attenuation prediction at Ka and Q band for a temperate Location, Vigo, Spain,” Advances in Space Research, pp. 1 – 10, 2026. https://doi.org/10.1016/J.ASR.2020.04.046 |
[18, 19, 42, 43, 45, 46, 51, 52]
. The SST analysis from the specific attenuation as
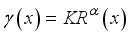 (1)
(1)  (2)
(2)  (3)
(3) 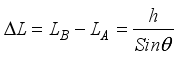 (4)
(4) where h = assumed depth of melting layer = 0.4km; L = rainy path.; γR= specific attenuation; R = rain rate; θ = propagation angle; LA = path length at layer A; LB= path length at layer B; and γR= specific attenuation.
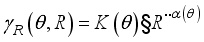 (5)
(5) where RP = R0.01 = rain rate; P = 0.01%; K and α are the frequency dependent coefficients
| [45] | E. Matricciani, ‗Physical-mathematical model of the dynamics of rain attenuation based on rain rate time series and a two-layer vertical structure of precipitation‘, Radio Science, Vol. 31, No. 2, pp. 281-295, 1996. https://doi.org/10.1029/95RS03129 |
| [46] | E. Matricciani, “Global formulation of the Synthetic Storm Technique to calculate rain attenuation only from rain rate probability distributions,” In the Proceedings of the 2008 IEEE Antennas and Propagation Society International Symposium, San Diego, CA, USA, 5 – 11 July, 2008, pp. 1 – 4, 2008. https://doi.org/10.1109/APS.2008.4619006 |
[45, 46]
. Also, K
A, α
A and K
B, α
B are constant coefficient of vertical and horizontal polarization defined by ITU-R (Rec. ITU-R P.838-2)
;
θ is the path elevation angle and
τ is the polarization tilt angle relative to the horizontal (
τ and
θ = 45° for circular polarization).
The vertical adjustment factor (
VP) can be calculated at 0.01% of time;
X depend on the latitude (
φ) of the earth station;
X = 1.5°; using the assumed bandwidth conventional GEO fixed-satellite link, 36 MHz is a generally accepted and widely used full-transponder bandwidth. (ITU technical documents frequently use 36 MHz as a representative satellite-transponder bandwidth)
| [53] | T. H. Nguyen, “Evaluation of rain attenuation models for high-frequency wireless communication in tropical regions”, IEEE Transactions on Antennas and Propagation, 69(10): pp. 6789–6798, 2021. |
[53]
.
3.3.5. Total Attenuation
We considered rain attenuation only since Fog and Cloud attenuation are not prevalent in this region; rain attenuation is the values assumed for the total attenuation. Different sources of noise in antenna are summarized in
Table 2 [34-38].
Table 2. Noise Temperature in Antenna.
S/N | Antenna Noise Temperature | Sources | Temperature (Kelvin) |
1 | Directional Satellite antenna | Earth from space | 290 |
2 | Directional | Space from earth at 90° elevation | 3 - 1 0 |
terminal | Space from earth at 10° elevation | ~ 80 |
antenna | Sun {1...10 GHz) | 105…104 |
3 | Hemispherical | At night | 290 |
terminal | Cloudy sky | 360 |
antenna | Clear sky with sunshine | 400 |
3.3.6. Link Budget Modeling
The link budget model was developed using propagation and atmospheric attenuation parameters. The received signal power was estimated using:
 (6)
(6)  (7)
(7) where Pr = received power, Pt = transmit power, Gt = transmitter antenna gain, Gr = receiver antenna gain, Lr = rain attenuation loss, and La = atmospheric loss.
Free-space path loss can be calculated using:
 (8)
(8) where f = frequency (GHz) and d = distance (km).
The generated link budget values served as target input for machine learning and deep learning prediction models. SNR is usually measured in decibels (dB), it is the ratio of signal (C) and noise power spectral density (N0).
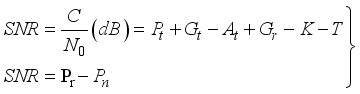 (9)
(9) where
where
 (10)
(10) where B = assumed ITU satellite Bandwidth = 36MHz = 36000000Hz;Pt = transmitted power Gt and Gr are Antenna gain at transmitter and receiver respectively; K is Boltzman constant= 1.38 x 10⁻²³ W/K = -228.6dbW/K; T = effective noise temperatures; NF = Receiver Noise figure in dB; -174 dBm per Hz is the thermal noise density at approximately 290 K.
Any information like temperature can be gotten from ITU-R P.835-5
. The specific rain attenuation was computed using the ITU-R P.838 model. The SST procedure involved rain cell modeling, storm translation velocity estimation, attenuation time-series generation, cumulative attenuation distribution computation.
4. Development of Machine Learning Models
4.1. Support Vector Machine (SVM) Model
The Support Vector Machine (SVM) is a powerful and versatile supervised machine learning algorithm used mainly for classification, but it can also be used for regression (SVR) and outlier detection. SVM finds the best decision boundary (called a hyperplane) that separates different classes in the data with the maximum possible margin. The goal is to create the widest possible gap between the classes so that new, unseen data can be classified more confidently and accurately
.
The structural architecture of the support vector machine is shown in
Figure 4 while the mapping of the kernel function from the input space to the feature space of the SVM is illustrated in
Figure 5. The SVM regression model was developed to predict Signal to Noise ratios under varying rainfall conditions. The Radial Basis Function (RBF) kernel was adopted because of its ability to model nonlinear propagation characteristics. In SVM Classification, the hyperplane is a clear decision boundary that separates classes. In SVM Regression (SVR), the hyperplane becomes a regression line/plane (or a more complex surface in higher dimensions) that tries to fit the data points within a margin called the ε-tube (epsilon tube).
Figure 4. The structural architecture of the support vector machine (SVM).
Figure 5. Mapping of the kernel function from the input space to the feature space of the SVM.
The SVM optimization function is expressed as in the linear equation as:
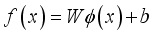 (11)
(11) where
W = weight vector (defines the orientation of the hyperplane) or the weight vector perpendicular to the hyperplane;

= feature mapping (via kernel trick for non-linear data) or input feature vector;
b = bias. The hyper-parameter optimization involved, kernel selection, penalty parameter tuning, gamma optimization, cross-validation. Grid search optimization was also employed to determine optimal parameters of the SVM scheme.
The Kernel Functions
When data is non-linearly separable in its original lower-dimensional space, SVM uses the Kernel Trick. It maps the original features into a higher-dimensional space where a linear hyperplane can easily separate the classes, without explicitly computing the coordinates in that high-dimensional space (saving immense computational power).Common kernel functions include:
(1). Linear Kernel: Used when data is already linearly separable.
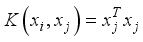 (12)
(12) (2). Polynomial Kernel: Useful for image processing and curved boundaries.
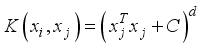 (13)
(13) (3). Radial Basis Function (RBF)/Gaussian Kernel: The most widely used kernel; maps data into an infinite-dimensional space. Ideal for highly complex, non-linear boundaries.
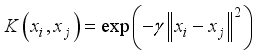 (14)
(14) 4.2. Random Forest (RF) Model
Random Forest is a machine learning algorithm that uses many decision trees to make better predictions as illustrated in
Figure 6. Each tree looks at different random parts of the data and their results are combined by voting for classification or averaging for regression which makes it as ensemble learning technique. This helps in improving accuracy and reducing errors
.
The hierarchical structure of the random forest algorithm as a collection of non-linear decision-making model is shown in
Figure 7. The Random Forest algorithm was developed as an ensemble learning model for comparative analysis. The RF model consists of multiple decision trees trained using bootstrap aggregation algorithm. The Root and Internal Nodes are the Points where the data is split based on a specific feature threshold (e.g., SNR > 20dB). The split is determined by maximizing information gain or minimizing impurity (e.g., Gini Impurity or Entropy for classification; Mean Squared Error for regression).
Figure 6. Architecture of the random forest model.
Figure 7. Hierarchical structure of the RF as a collection of non-linear decision-making model.
The Leaf Nodes is the final terminal nodes that contain the predicted class or continuous value while the Ensemble Layer is the mechanism that aggregates the outputs of all N trees.
Technically, Random Forest does not use kernel functions like an SVM does. It is a non-parametric, rule-based algorithm that operates in the original feature space by recursively partitioning it into rectangular regions. However, in this research mapped its behavior to kernel concepts for comparative reasons by:
(1). Implicit Proximity Matrix: RF calculates proximity between data points. The data was simulated through the forest, and count how many times two distinct samples land in the exact same leaf node. This "proximity score" acts similarly to an RBF kernel, measuring data similarity in a highly non-linear way.
(2). No High-Dimensional Mapping: Unlike SVM, which mathematically transforms data into higher dimensions via explicit formulas, RF handles non-linear boundaries natively by simply creating complex, jagged step-like decision borders.
The RF output prediction function is expressed as:
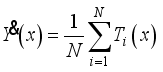 (15)
(15) where

is the prediction from individual tree and
N = number of trees.
The Random Forest (RF) model hyper-parameters considered in this study include the number of trees, minimum leaf size, and the number of predictors sampled at each split. These hyper-parameters were optimized using Bayesian optimization to improve the predictive performance of the model
.
4.3. Dataset Partitioning
The processed datasets were partitioned into three subsets with 70% used for training, 15% used for validation, and 15% reserved for as testing data. The training set was used to train the machine learning models, while the validation set was employed for hyper-parameter optimization and model selection using Bayesian optimization. The testing set was kept completely unseen during both the training and optimization stages and was used solely for the final evaluation of model performance
| [27] | V. A. Akpan and G. D. Hassapis, “Training dynamic feedforward neural networks for online nonlinear model identification and control applications”, International Reviews of Automatic Control: Theory & Applications,., 4(3), 335–350, 2011. |
| [28] | V. A. Akpan, “Nonlinear model identification and adaptive model predictive control using neural networks”. ISA Transactions, 5(2), 177–194, 2011.
https://doi.org/10.1016/j.isatra.2010.12.007 |
[27, 28]
.
To ensure a fair and unbiased comparison between the Random Forest (RF) and Support Vector Machine (SVM) models, the following procedures were adopted:
The same training, validation, and testing data partitions were used for both the RF and SVM models, ensuring that both models were trained and evaluated on identical data samples.
Bayesian optimization was applied to both models for hyper-parameter tuning. For the RF model, the optimized hyper-parameters included the number of trees, minimum leaf size, and the number of predictors sampled at each split. For the SVM model, the optimized hyper-parameters included the Box Constraint, Kernel Scale, and Epsilon.
The predictive performances of both models were evaluated using the same 15% testing dataset based on the Mean Absolute Error (MAE), Mean Squared Error (MSE), Root Mean Squared Error (RMSE), and the coefficient of determination (R2).
To improve the robustness and reliability of the performance evaluation, repeated cross-validation was incorporated during model development and hyper-parameter optimization. However, the final performance metrics reported in this study were obtained exclusively from the independent testing dataset, which remained completely unseen throughout the training and optimization processes.
5. Result and Discussion
The simulation results for the actual versus predicted values for all the ten locations are shown in
Figures 8, 10, 12, 14, 16, 18, 20, 22, 24, and 26. In these figures, the
black line represents the actual values, the
blue line represents the Random Forest (RF) predictions, and the
redline represents the Support Vector Machine (SVM) predictions.
The time-series plots indicate that both models successfully capture the overall trend of the data. However, the SVM model follows the actual values more closely, particularly during sharp downward spikes (deep fades), whereas the RF model exhibits slightly larger deviations by either underestimating or overestimating these abrupt drops.
The separate regression (scatter) plots for the two models are presented in
Figures 9, 11, 13, 15, 17, 19, 21, 23, 25, and 27. In these plots, a perfect prediction would place all data points exactly on the red dashed diagonal line, indicating complete agreement between the predicted and actual values. The SVM predictions are clustered very closely around the reference line, yielding exceptionally high coefficients of determination (R
2) ranging from 0.998 to 1.000. Although the RF model also demonstrates excellent predictive performance, its data points exhibit slightly greater dispersion around the reference line, with R
2 values generally ranging from 0.94 to 0.99 and a few instances of lower performance.
Figure 8. ABUJA SVM and RF: Actual Vs. Predicted Values.
Figure 9. ABUJA SVM and RF Regression.
Figure 10. AKURE SVM and RF: Actual Vs. Predicted Values.
Figure 11. AKURE SVM and RF Regression.
Figure 12. BAUCHI SVM and RF: Actual Vs. Predicted Values.
Figure 13. BAUCHI SVM and RF Regression.
Figure 14. ENUGU SVM and RF: Actual Vs. Predicted Values.
Figure 15. ENUGU SVM and RF Regression.
Figure 16. JOS SVM and RF: Actual Vs. Predicted Values.
Figure 17. JOS SVM and RF Regression.
Figure 18. LAGOS SVM and RF: Actual Vs. Predicted Values.
Figure 19. LAGOS SVM and RF Regression.
Figure 20. MAKURDI SVM and RF: Actual Vs. Predicted Values.
Figure 21. MAKURDI SVM and RF regression.
Figure 22. MINNA SVM and RF: Actual Vs. Predicted Values.
Figure 23. MAKURDI SVM and RF: regression.
Figure 24. PORT HARCOURT SVM and RF: Actual Vs. Predicted Values.
Figure 25. PORT HARCOURT SVM and RF Regression.
Figure 26. YOLA SVM and RF: Actual Vs. Predicted Values.
Figure 27. YOLA SVM and RF Regression.
Table 3 shows that both Random Forest (RF) and Support Vector Machine (SVM) achieved high regression coefficients (R
2), indicating excellent predictive accuracy in modelling the nonlinear relationship between rain attenuation and SNR. Overall, SVM outperformed RF, recording higher R
2 values in nine of the ten study locations. SVM achieved perfect regression (R
2 = 1.000) in Bauchi, Enugu, Makurdi, Port Harcourt, and Yola, while maintaining excellent performance (R
2 ≥ 0.9985) in Abuja, Akure, Jos, and Lagos. Its lowest performance was observed in Minna (R
2 = 0.9328).
Similarly, RF demonstrated strong predictive capability, with R2 values ranging from 0.9425 to 0.9999. The model achieved its highest performance in Enugu (0.9999) and maintained excellent accuracy across most locations. However, comparatively lower R2 values were recorded in Abuja (0.9425), Lagos (0.9823), and Minna (0.9822). Notably, Minna was the only location where RF outperformed SVM, suggesting that RF was more robust in handling the propagation characteristics at that location. Overall, the results indicate that while both models are highly effective for SNR prediction, SVM exhibits superior generalization and predictive performance across the majority of the study locations.
It should be noted from
Table 3 that both RF and SVM achieved very high regression coefficients, indicating excellent predictive accuracy. It can be observed that SVM outperformed RF in most locations, achieving near-perfect or perfect regression (R
2 ≈ 1.000) in several cases.Furthermore, the models effectively captured the nonlinear relationship between rain attenuation and SNR across diverse climatic regions. The consistently high R
2 values demonstrate the suitability of both algorithms for AI-based link budget and SNR prediction.
Table 3. Experimental Regression (R2) results.
S/N | Location (State) | Report Regression for Machine Learning Algorithm |
Random Forest (RF) | Support Vector Machine (SVM) |
1 | Abuja | 0.9425 | 0.9985 |
2 | Akure | 0.9987 | 0.9998 |
3 | Bauchi | 0.9992 | 1.000 |
4 | Enugu | 0.9999 | 1.000 |
5 | Jos | 0.9970 | 0.9985 |
6 | Lagos | 0.9823 | 0.9992 |
7 | Makurdi | 0.9985 | 1.000 |
8 | Minna | 0.9822 | 0.9328 |
9 | Port Harcourt | 0.9984 | 1.000 |
10 | Yola | 0.9992 | 1.000 |
Figure 28. Mean Absolute Error for all the locations.
Figure 29. Model Ranking for all the locations.
Figure 30. Mean Squared Error for all the locations.
Figure 31. Overall Ranking for the Two Models.
Figure 32. Coefficients of Determination for all the locations.
Figure 33. Root Mean Square Error Comparison for all the locations.
On the other hand, SVM showed reduced performance in Minna (R2 = 0.9328), indicating sensitivity to certain propagation conditions while RF exhibited lower and more variable regression performance than SVM in some locations, particularly Abuja and Lagos. Similarly, the perfect R2 values may indicate potential overfitting and should be interpreted alongside other performance metrics such as RMSE, MAE, and MSE. Finally, the regression coefficients alone do not fully evaluate model performance and should be complemented with error-based metrics for comprehensive assessment.
The six plots shown in
Figures 28 through
Figure 33 compares the Support Vector Machine (SVM) and Random Forest (RF) for predicting SNR (dB) across 10 Nigerian locations (Abuja, Akure, Bauchi, Enugu, Jos, Lagos, Makurdi, Minna, Port Harcourt, Yola). The SVM clearly outperforms Random Forest in the large majority of cases. SVM wins in 9 out of 10 locations, RF is better only in Minna with the Cumulative ranking score of SVM 74 to RF 16 (see
Figure 31). This is consistent across the actual versus predicted time-series plots, the regression scatter plots (R
2), and the summary error metrics (MAE, MSE, RMSE, R
2).
Table 4 presents a comparative summary of the performance of the Random Forest (RF) and Support Vector Machine (SVM) models using six evaluation metrics. Overall, the results indicate that SVM consistently outperformed RF, demonstrating superior predictive accuracy and generalization across the ten study locations.
S/N | Metric | Winner | Observation |
1 | MAE(see Figure 28) | SVM in most cities | One location (Minna) shows a large SVM MAE spike |
2 | Model Ranking by Location (see Figure 29) | SVM dominant | Red (SVM) bars much higher than blue (RF) in 9/10 places |
3 | MSE(see Figure 30) | SVM | One large outlier for both models |
4 | Overall Model Ranking(see Figure 31) | SVM | SVM total score ~74, RF ~16 |
5 | Coefficients of determinant (see Figure 32) | SVM | Both high, but SVM closer to 1.0 almost everywhere |
6 | RMSEsee Figure 33) | SVM | Same pattern as MAE/MSE |
Based on the Mean Absolute Error (MAE) (see
Figure 28), SVM recorded the lowest prediction errors in most locations, indicating more accurate SNR predictions. However, an exception was observed in Minna, where SVM exhibited a noticeably higher MAE, suggesting that the model encountered greater difficulty in capturing the propagation characteristics at that location.
The model ranking by location (see
Figure 29) further confirms SVM's superiority, as it achieved higher overall rankings in nine out of the ten study locations. This demonstrates that SVM provided more reliable performance across diverse climatic conditions than RF.
Similarly, the Mean Squared Error (MSE) results (see
Figure 30) show that SVM generally produced lower squared prediction errors than RF, although both models exhibited a significant outlier in one location, indicating the presence of unusually large prediction errors under specific propagation conditions.
The overall model ranking (see
Figure 31) strongly favours SVM, with an aggregate performance score of approximately 74 compared to 16 for RF. This substantial difference highlights the superior overall predictive capability and consistency of the SVM model.
The coefficient of determination (R
2) results (see
Figure 32) indicate that both models achieved high goodness-of-fit values, reflecting excellent agreement between predicted and observed SNR values. Nevertheless, SVM consistently produced R
2 values closer to 1.0, confirming its stronger ability to explain the variability in the measured data.
Finally, the Root Mean Square Error (RMSE) results (see
Figure 33) followed the same trend as the MAE and MSE analyses, with SVM generally recording lower RMSE values across most locations. This further demonstrates its ability to minimize prediction errors while maintaining high accuracy.
Overall, the comparative analysis across all six performance metrics demonstrates that Support Vector Machine (SVM) is the superior model for SNR prediction in the study, providing higher predictive accuracy, lower error metrics, and better generalization than Random Forest. The only notable limitation was its reduced performance in Minna, where RF proved to be more robust. Despite this exception, SVM remains the preferred model for AI-based link budget and SNR prediction under the diverse propagation conditions considered in this study.
5.1. Reason Behind the Successes of SVM
The SNR data appear to have sharp, non-linear fades. SVM (especially with an appropriate kernel) is often better at capturing these complex decision boundaries/regression surfaces. Random Forest is an ensemble of trees and is very robust, but in this particular dataset it is slightly less precise on the extreme values. The near-perfect R2 values for SVM (many ≥ 0.999) indicate the model is capturing almost all the variance in the measured SNR. For predicting or modelling SNR at these locations, Support Vector Machine is the preferred model. It delivers lower error (MAE/MSE/RMSE) and higher explanatory power (R2) in 9 of the 10 cities examined. The only exception is Minna, where Random Forest is modestly better.
5.2. Reason Behind the Success of RF at Minna
An important observation from this study is that Minna was the only study location where the Random Forest (RF) model outperformed the Support Vector Machine (SVM) model. RF achieved a higher coefficient of determination (R² = 0.9822) than SVM (R² = 0.9328), together with lower prediction errors, indicating that RF better captured the relationship between the input variables and SNR at this location.
An examination of the Minna dataset reveals characteristics that differ from the other study locations. First, the dataset exhibits a highly skewed distribution, with the majority of observations concentrated within a narrow range of rainfall conditions but containing a few extremely large rain attenuation and SNR values. Such heterogeneous data distributions are known to favour tree-based ensemble models because they partition the feature space into multiple localized regions rather than fitting a single global regression function. Second, throughout the Minna dataset, rain rate and rain attenuation are the principal explanatory variables. Under these conditions, Random Forest was better able to model localized nonlinear relationships and threshold effects, whereas the SVM model attempted to represent the entire dataset using a single kernel-based regression function.
Furthermore, the Minna dataset contains limited unique rainfall and attenuation levels, indicating a discretized distribution of the predictor variables. Decision-tree ensembles such as RF generally perform well under such conditions because repeated partitioning of the predictor space effectively captures piecewise nonlinear relationships. In contrast, SVM performance is more sensitive to the global kernel function and associated hyperparameters, which may reduce prediction accuracy when the data contain localized nonlinearities or extreme observations.
It is also noteworthy that the Minna dataset includes a small number of extreme attenuation/SNR observations relative to the remaining locations. These observations have a greater influence on the optimization of the SVM regression function than on the RF ensemble, whose bootstrap aggregation mechanism naturally reduces the influence of individual extreme samples. Consequently, RF produced more accurate predictions for Minna despite SVM outperforming RF across the remaining nine study locations.
Therefore, the Minna result should be regarded as a location-specific exception arising from the statistical characteristics of the dataset rather than evidence of the overall superiority of RF. Across the ten study locations, SVM consistently achieved higher prediction accuracy and better generalization performance, while the Minna case demonstrates that tree-based ensemble methods can provide greater robustness when datasets exhibit localized nonlinear behaviour, skewed distributions, and extreme observations. Minna is situated within the Guinea Savannah climatic zone, where rainfall is dominated by intense convective storms interspersed with stratiform precipitation. The resulting rainfall exhibits moderate to irregular temporal distribution and considerable variability, producing localized nonlinear attenuation characteristics. Such heterogeneous propagation conditions are more effectively captured by the Random Forest model, whose ensemble decision-tree architecture partitions the feature space into localized regions. In contrast, the Support Vector Machine constructs a single global regression function, which may be less effective in representing localized nonlinearities and extreme rainfall events. Consequently, RF achieved superior performance at Minna, whereas SVM remained the best-performing model across the other nine study locations.
6. Conclusion and Future Direction
6.1. Conclusion
The comparative evaluation demonstrates that Support Vector Machine (SVM) consistently outperformed Random Forest (RF) in predicting Signal-to-Noise Ratio (SNR) across the ten Nigerian cities, achieving superior performance in nine out of ten locations, with RF performing better only in Minna. SVM produced more accurate predictions by closely tracking the measured SNR values, particularly during deep fading events, and achieved consistently higher coefficients of determination (R2> 0.998, often reaching 1.000). It also recorded lower MAE, MSE, and RMSE values than RF in most locations, resulting in a substantially higher overall ranking score (74 versus 16). The superior performance of SVM is attributed to its ability to model complex nonlinear propagation characteristics using kernel-based learning, whereas RF tends to smooth extreme variations due to its ensemble averaging approach. Although Minna exhibited comparatively better RF performance, the overall findings confirm that SVM is the more accurate, robust, and generalizable model for AI-based SNR prediction and radio-network planning across diverse climatic and topographical conditions in Nigeria.
6.2. Future Directions
Although this study demonstrated the effectiveness of Random Forest (RF) and Support Vector Machine (SVM) for predicting Signal-to-Noise Ratio (SNR) under tropical rain conditions. It is important to note that the dataset was derived from ten representative locations in Nigeria. Although these locations cover different climatic zones, they may not fully represent propagation characteristics across all tropical and subtropical environments. The models primarily utilized rain rate, rain attenuation, and link budget parameters. Other influential atmospheric variables, such as humidity, atmospheric refractivity, temperature, wind speed, cloud liquid water content, and terrain characteristics can considered as future investigation. Rain attenuation was estimated using the Synthetic Storm Technique (SST) rather than long-term measured attenuation data from operational satellite links. While SST is well validated, measured attenuation datasets could further improve model realism.
In the context of modeling algorithms, future research could extend this work by investigating advanced deep learning architectures, including Convolutional Neural Networks (CNNs), Long Short-Term Memory (LSTM) networks, Bidirectional Long Short-Term Memory (BiLSTM) networks, Transformer-based models, and hybrid CNN–LSTM architectures. CNNs are highly effective in automatically extracting complex spatial features from large-scale propagation datasets, whereas LSTM and BiLSTM networks are specifically designed to capture long-term temporal dependencies in rain attenuation and SNR time-series data. Hybrid CNN–LSTM models integrate the spatial feature learning capability of CNNs with the temporal sequence modelling strength of LSTMs, offering the potential for improved prediction accuracy and robustness over conventional machine learning models. Furthermore, hybrid and ensemble AI frameworks that combine traditional machine learning algorithms, such as Random Forest (RF) and Support Vector Machine (SVM), with deep learning models may further enhance prediction performance, improve generalization, and increase resilience under highly dynamic propagation conditions. Future investigations should also evaluate these advanced AI models within 6G Satellite–Terrestrial Integrated Network (STIN) architectures, where intelligent channel prediction, adaptive resource allocation, and proactive link management will be essential for achieving reliable, ubiquitous, low-latency, and high-capacity wireless communications.
Abbreviations
STIN | Satellite–Terrestrial Integrated Networks |
RF | Random Forest |
SVM | Support Vector Machine |
SNR | Signal-to-Noise Ratio |
RMSE | Root Mean Square Error |
MAE | Mean Absolute Error |
MSE | Mean Squared Error |
R2 | Coefficient of Determination (Regression) |
6G | Sixth Generation |
DNNs | Deep Neural Networks |
AI | Artificial Intelligence |
ITU-R | International Telecommunication Union –Radiocommunication |
ML | Machine Learning |
DL | Deep Learning |
CNNs | Convolutional Neural Networks |
LSTM | Long Short-Term Memory |
BiLSTM | Bidirectional Long Short-Term Memory |
LLMs | Large Language Models |
QoS | Quality of Service |
MATLAB | Matrix Laboratory |
DSA | Dynamic Spectrum Access |
CR | Cognitive Ratio |
RL | Reinforcement Learning |
RA | Resource Allocation |
SST | Synthetic Storm Technique |
NiMet | Nigerian Meteorological Agency |
NASA | National Agency for Space Administration |
CAR | Centre for Atmospheric Physics |
NARSDA | National Space Research and Development Agency |
FCT | Federal Capital Territory |
TRODAN | Tropospheric Data Acquisition Network |
TRMM | Tropical Rainfall Measuring Mission |
dB | Decibels |
C | Ratio of Signal |
N0 (PSD) | Power Spectral Density |
NF | Receiver Noise Figure |
K | Boltzmann Constant |
SVR | Support Vector Machine Regression |
Author Contributions
Oladayo Gbolahan Ajileye: Conceptualization, Data curation, Formal Analysis, Funding acquisition, Investigation, Methodology, Resources, Software, Validation, Visualization, Writing – original draft, Writing – review &editing
Vincent Andrew Akpan: Conceptualization, Formal Analysis, Investigation, Methodology, Project administration, Software, Supervision, Validation, Visualization, Writing – original draft, Writing – review &editing
Joseph Sunday Ojo: Conceptualization, Formal Analysis, Investigation, Methodology, Project administration, Supervision, Validation, Writing – original draft, Writing – review &editing
Data Availability Statement
The data supporting the outcome of this research work has been reported in this manuscript.
Conflicts of Interest
The authors declare no conflicts of interest.
References
| [1] |
H. Yao, L. Wang, X. Wang,L. Zhou & Y. Liu, (2018). “The Space-Terrestrial Integrated Network: An Overview”, IEEE Communications Magazine, 56(9), 178–185, 2018.
https://doi.org/10.1109/MCOM.2018.1700038
|
| [2] |
G. Maral, M. Bousquet & Z. Sun, Satellite Communications Systems: Systems, Techniques and Technology (6th ed.), 2020. Wiley.
https://doi.org/10.1002/9781119673811
|
| [3] |
P. Wang, J. Zhang, X. Zhang, Z. Yan, B. G. Evans & W. Wang, “Convergence of Satellite and Terrestrial Networks: A Comprehensive Survey”, IEEE Access, 8, 5550–5588, 2020.
https://doi.org/10.1109/ACCESS.2019.2963223
|
| [4] |
N. Chen, Y. Song, Y. Cao, Z. Sun, B. Zhao, M. Wang, D. He & G. Peng, “Network-Layer Perspectives on Satellite–Terrestrial Integrated Networks in 6G: A Comprehensive Review”, Engineering, 54, 69–92, 2025.
https://doi.org/10.1016/j.eng.2025.05.012
|
| [5] |
S. Cakaj, LEO Coverage. In Ground Station Design and Analysis for LEO Satellites: Analytical, Experimental and Simulation Approach, 2022. Wiley.
https://doi.org/10.1002/9781119899280.ch5
|
| [6] |
K. Linling, “Terrestrial-satellite communication network: transceivers designs and resources allocation”, Wireless Network, 2018.
https://welib.org/md5/efc43e3396c19d873752f99d4dc9729d
|
| [7] |
S. L. Huang, “Performance Analysis for Integrated Sensing and Communication Systems in Rainfall Scenarios”, Atmosphere, 16(11): 1249, 2025.
|
| [8] |
J. A. Azevedo & F. Mendonça, “A Critical Review of the Propagation Models Employed in LoRa Systems”,Sensors, 24(12), 3877, 2024.
https://doi.org/10.3390/s24123877
|
| [9] |
C. Parker, “Integration of Satellite and Terrestrial Wireless Communication Systems”, Journal of Electrical & Electronic Systems, vol.14(1), 2025;
https://doi.org/10.37421/2332-0796.2025.14.164
|
| [10] |
Y. Chai, Y. (2026). Satellite–Terrestrial Network Integration for 6G: Enhancing Global Connectivity and Seamless Communication, Lecture Notes in Networks and Systems (LNNS), Vol. 1698, pp. 493–506, 2026.
https://doi.org/10.1007/978?3?032?09694?4_38:Springer
|
| [11] |
A. Gbenga?Ilori, “Artificial Intelligence Empowering Dynamic Spectrum Access in Advanced Wireless Communications: A Comprehensive Overview”, AI (an MDPI open?access journal; includes IEEE?relevant topic coverage and is indexed in engineering databases), vol. 6, no. 6, art. 126, 2025,
https://doi.org/10.3390/ai6060126
|
| [12] |
A. Javaid, “Leveraging Large Language Models for Integrated Satellite?Aerial?Terrestrial Networks: Recent Advances and Future Directions”, IEEE Open Journal of the Communications Society, Article (2024–2025),
https://doi.org/10.1109/OJCOMS.2024.3522103
|
| [13] |
H. Ekta, A comprehensive systematic literature review on artificial intelligence for error correction and modulation schemes in next-generation satellite communications”, SpringerArtificial Intelligence Review, 2025.
https://doi.org/10.1007/s10462-025-11317-4
|
| [14] |
G. Cano, “AIRIS2: A Smart Gateway Diversity Algorithm for Very High?Throughput Satellite Systems”, IEEE Wireless Communications Letters, 14(7), 2189–2193, 2025.
https://doi.org/10.1109/LWC.2025.3565705
|
| [15] |
A. Singh, “Rain attenuation modelling for millimetre-wave communication links in tropical climates,”. IEEE Access, vol. 8, PP.123456–123465, 2020.
|
| [16] |
S. B. R. Tirmizi, Y. Chen, S. Lakshminarayana, W. Feng & A. A. Khuwaja, “Hybrid Satellite–Terrestrial Networks toward 6G: Key Technologies and Open Issues”, Sensors, 22(21), 8544, 2022.
https://doi.org/10.3390/s22218544
|
| [17] |
Basir, R., Khan, H. Z., Fakhar, U., et al. (2026). Synergizing User Association: A Comprehensive Survey of Satellite–Terrestrial Integrated Networks. Computer Communications. Explains that STINs provide enhanced coverage, reliability, quality of service, and seamless end-to-end connectivity by combining satellite and terrestrial infrastructures.
https://doi.org/10.1016/j.comcom.2026.108489
|
| [18] |
ITU-R P.838-3, ‘International Telecommunication Union, Recommendation ITU-R P.838-3: Specific attenuation model for rain for use in prediction methods’, Geneva: ITU, 2005. Available:
https://www.itu.int/dms_pubrec/itu-r/rec/p/R-REC-P.838-3-200503-I!!PDF-E.pdf
|
| [19] |
ITU-R P.837-7, I.-R. (2017). Characteristics of precipitation for propagation modelling. International Telecommunication Union — Radiocommunication Sector (ITU-R).
|
| [20] |
R. Patel, “Machine learning-based prediction of rain attenuation for millimetre-wave links in tropical environments”, IEEE Transactions on Vehicular Technology, vol. 70, (no. 5), pp. 4567–4576, 2021.
|
| [21] |
A. Dalia, “Study of rain attenuation effects for 5G Mmwave cellular communication in tropical location”, 2018. The,
https://doi.org/10.1049/iet-map.2017.1029www.ietdl.org
|
| [22] |
C. Cortes, “Support Vector Machines (SVM): Support-Vector Networks”, Machine Learning, 20(3), 273–297, 1995.
https://doi.org/10.1007/BF00994018
|
| [23] |
V. A. Akpan, E. C. Njoku and E. I. Obi, “Slice-Specific Learning Models for Intrusion Detection in 5G Telecommunication Networks”, International Journal of Wireless Communication and Mobile Computing, vol. 12, no. 2, pp. 93 – 118, 2025.
https://doi.org/10.11648/j.wcmc.20251202.14
|
| [24] |
F. Ahmed-Ade, V. A. Akpan and E. O. Ogolo, “OFDM Variants and FPGA Implementation: A Comprehensive Analysis of Algorithm Comparison, Optical Wireless Integration, Neural Network Mapping, and FPGA Realization”, American Journal of Embedded Systems and Applications, vol. 11, no. 1, pp. 16 – 38, 2025.
https://doi.org/10.11648/j.ajesa.20251101.13
|
| [25] |
F. Ahmed-Ade, V. A. Akpan, E. O. Ogolo and D. J. Koffa, “CNN and Hybrid CNN-LSTM Artificial Intelligence-Based Algorithms for Adaptive Channel Estimation of Optical Plus Filtered OFDM For LTE Telecommunication Systems Design,” Journal of Electronics and Communication Engineering, vol. 12, no. 2, pp. 5 – 33, 2026.
https://doi.org/10.35629/5941-12020533
|
| [26] |
F. Ahmed-Ade, V. A. Akpan, M. A. Umeche, D. Y. Odoma and N. M. Esuga-Mopah, “Adaptive Channel Estimation of Beamforming O+F OFDM Signal in 6G Optical Wireless Communication Systems using Deep Machine Learning Techniques with FPGA Implementation”, Journal of Electronics and Communication Engineering, vol. 12, no. 4, pp. 1 – 32, 2026.
https://doi.org/10.35629/5941-12040132
|
| [27] |
V. A. Akpan and G. D. Hassapis, “Training dynamic feedforward neural networks for online nonlinear model identification and control applications”, International Reviews of Automatic Control: Theory & Applications,., 4(3), 335–350, 2011.
|
| [28] |
V. A. Akpan, “Nonlinear model identification and adaptive model predictive control using neural networks”. ISA Transactions, 5(2), 177–194, 2011.
https://doi.org/10.1016/j.isatra.2010.12.007
|
| [29] |
V. A. Akpan, D. A. Adegoke, E. A. Adejayan and K. A. Adepoju, “Artificial Intelligence-Based YOLOv3 using DarkNet-53 Deep Convolutional Neural network Model Architecture for Automatic Vehicle Inventory System Design with a Dynamic Relational Database System and Google Cloud Storage”, Journal of Electrical and Computer Engineering Innovations, vol. 14, no. 2, pp. 435 – 472, 2026.
https://doi.org/10.22061/jecei.2026.12552.889
|
| [30] |
V. A. Akpan and N. O. Raji, “Development of Deep Convolutional Neural Network Algorithms Based on DenseNet Model for Adaptive Classification of Chest Diseases”, International Journal of Biophotonics and Biomedical Engineering, vol. 5, no. 2, Article 9, pp. 1 – 28, 2025.
https://doi.org/10.57647/ijbbe.2025.0502.09
|
| [31] |
M. Kishor, “Generative AI in Nuerology: Advancing Neurodegenerative disease treatment”, 2026.
https://doi.org/10.1201/9781003644392
|
| [32] |
R. K. Crane, ‘Prediction of the effects of rain on satellite communication systems’, Proceedings of the IEEE, Vol. 65, No. 3, pp. 456–474, 1977.
https://doi.org/10.1109/PROC.1977.10522
|
| [33] |
Ghorbanzadeh, M., Abdelhadi, A., & Clancy, C. (2017).Cellular Communications Systems in CongestedEnvironments: Resource Allocation and End-to-End Quality of Service Solutions with MATLAB. Springer International Publishing.
https://doi.org/10.1007/978-3-319-46267-7
|
| [34] |
K. Harb, A. Srinivasan, B. Cheng and C. Huang, ‘Prediction method to maintain QoS in weather-impacted wireless and satellite networks’, In Proceedings of the IEEE international conference on Systems, Man and Cybernetics (SMC), pp. 4008 – 4013, 2007.
https://doi.org/10.1109/ICSMC.2007.4414255
|
| [35] |
K. Harb, A. Srinivasan, B. Cheng and C. Huang, ‘QoS in weather-impacted satellite networks’, In proceedings of the IEEE Pacific Rim Conference on Communications, Computers and Signal Processing. (PACRIM 2007) pp. 178 – 181, 2007.
|
| [36] |
K. Harb, A. Srinivasan, B. Cheng and C. Huang, ‘Intelligent weather aware scheme for satellite systems’, IEEE International Conference on Communications (ICC), pp. 1930 – 1936, 2008.
https://doi.org/ 10.1109/ICC.2008.370
|
| [37] |
K. Harb, F. R. Yu, P. Dakhal and A. Srinivasan, ‘An intelligent QoS control system for satellite networks based on Markovian weather prediction’, IEEE Vehicular Technology Conference (VTC 2010- Fall), Ottawa, Ontario, Canada, pp. 1 – 5. 2010.
https://doi.org/10.1109/VETECF.2010.5594097
|
| [38] |
K. Harb, F. R. Yu, P. Dakhal and A. Srinivasan, “Performance Evolution in Satellite Communication Networks Along with Markovian Channel Prediction,”Journal of Wireless Networking and Communications, vol. 2, no. 5, pp. 143 – 157, 2012.
https://doi.org/10.5923/j.jwnc.20120205.09
|
| [39] |
R. Z. Dhafer, S. Thulfiqar, A. Aldeen and A. Al-Wahab, ‘Simplified the QoS factor for the ad hoc network using fuzzy technique’, International Journal of Communications, Network and System Sciences, Vol. 6, pp. 381 – 387, 2013.
https://doi.org/10.4236/ijcns.2013.69041
|
| [40] |
P. Kim (2017). MATLAB deep learning: With machine learning, neural networks and artificial intelligence. Apress.
https://doi.org/10.1007/978-1-4842-2845-6
|
| [41] |
ITU-R P.835-5, “Reference Standard Atmospheres: P Series Radiowave Propagation,” Recommendation ITU-R P.853-5 (02/2012), pp. 1 – 12, 2013. Available:
https://www.itu.int/dms_pubrec/itu-r/rec/p/R-REC-P.835-5-201202-S!!PDF-E.pdf
|
| [42] |
ITU-R P.838-2 (ITU-R, 201/3), “Specific attenuation model for rain for use in prediction methods,” Recommendation ITU-R P.838-2, pp. 1 – 5, 2003. Available:
https://www.itu.int/dms_pubrec/itu-r/rec/p/R-REC-P.838-2-200304-S!!PDF-E.pdf
|
| [43] |
J. S. Ojo, V. A. Akpan, O. G. Ajileye and O. L. Ojo, O. L. “QoS Improvement Using Intelligent Algorithm Under Dynamic Tropical Weather for Earth-Space Satellite Applications,” International Journal of Computer & Information Engineering, vol. 11, no. 9, pp. 1104 – 1110, 2017. Available:
https://waset.org/publications/10008802/qos-improvement-using-intelligent-algorithm-under-dynamic-tropical-weather-for-earth-space-satellite-applications
|
| [44] |
O. G. Ajileye, J. S. Ojo and V. A. Akpan, V. A. (2026): Comparative Analysis of Machine Learning Algorithms for Good Quality of Service on Terrestrial and Satellite Network Systems Over Nigeria,” International Journal of Networks and Communications, vol. 15, no. 1, pp. 1 – 12, 2026.
https://doi.org/10.5923/j.ijnc.20261501.01
|
| [45] |
E. Matricciani, ‗Physical-mathematical model of the dynamics of rain attenuation based on rain rate time series and a two-layer vertical structure of precipitation‘, Radio Science, Vol. 31, No. 2, pp. 281-295, 1996.
https://doi.org/10.1029/95RS03129
|
| [46] |
E. Matricciani, “Global formulation of the Synthetic Storm Technique to calculate rain attenuation only from rain rate probability distributions,” In the Proceedings of the 2008 IEEE Antennas and Propagation Society International Symposium, San Diego, CA, USA, 5 – 11 July, 2008, pp. 1 – 4, 2008.
https://doi.org/10.1109/APS.2008.4619006
|
| [47] |
R. Nalinggam, W. Ismail, J. S. Mandeep, M. T. Islam, K. Y. You, A. M. Al-Hetar and T. A. Rahman, “Development of rain attenuation model for Southeast Asia equatorial climate,” IET Communications, 7(10), 1008–1014, 2013.
https://doi.org/10.1049/iet-com.2012.0298
|
| [48] |
M. R. Islam, Y. A. Abdulrahman and T. A. Rahman, “An improved ITU-R rain attenuation prediction model over terrestrial microwave links in tropical region,” EURASIP Journal on Wireless Communications and Networking, 2012, Article 189, 2012.
https://doi.org/0.1186/1687-1499-2012-189
|
| [49] |
M. A. Sodunke, J. S. Ojo and A. De, “Study of the seasonal characteristics of rainfall rate in Southwestern Nigeria and its effect on induced attenuation in earth-satellite communications,”Journal of Atmospheric and Solar-Terrestrial Physics, vol. 263, Article no: 106331, 2024.
https://doi.org/10.1016/j.jastp.2024.106331
|
| [50] |
A. I. O. Yussuff, I. E. Koleoso and N. H. H. Khamis, “Investigating rain attenuation models for satellite links in tropical Nigeria,” Indonesian Journal of Electrical Engineering and Informatics (IJEEI), vol. 6, no. 1, pp. 61 – 69, 2018.
https://doi.org/10.11591/ijeei.v6i1.263
|
| [51] |
A. K. Lwas, M. R. Islam, J. Chebil, M. H. Habaebi, A. F. Ismail, A. Zyoud and H. Dao, “Rain Attenuation Analysis Using Synthetic Storm Technique in Malaysia,” In the Proceedings of the 5th International Conference on Mechatronics (ICOM’13), IOP Conference Series: Material Science and Engineering, vol. 53, no. 012045, pp. 1 – 7, 2013.
https://doi.org/10.1088/1757-899X/53/1/012045
|
| [52] |
D. Nandi, F. Pérez-Fontán, V. Pastoriza-Santos and F. Machado, “Application of synthetic storm technique for rain attenuation prediction at Ka and Q band for a temperate Location, Vigo, Spain,” Advances in Space Research, pp. 1 – 10, 2026.
https://doi.org/10.1016/J.ASR.2020.04.046
|
| [53] |
T. H. Nguyen, “Evaluation of rain attenuation models for high-frequency wireless communication in tropical regions”, IEEE Transactions on Antennas and Propagation, 69(10): pp. 6789–6798, 2021.
|
| [54] |
Hastie, T., Tibshirani, R., & Friedman, J. (2009). The Elements of Statistical Learning: Data Mining, Inference, and Prediction (2nd ed.). Springer.
https://doi.org/10.1007/978-0-387-84858-7
|
| [55] |
Breiman, L. (2001). Random forests. Machine Learning, 45(1), 5–32.
https://doi.org/10.1023/A:1010933404324
|
| [56] |
The MathWorks, Inc. MATLAB® and Simulink® 2025. Natick, MA., U.S.A., 2025.
https://www.mathworks.com/
|
Cite This Article
-
APA Style
Ajileye, O. G., Akpan, V. A., Ojo, J. S. (2026). Comparative Analysis of Random Forest and Bayesian Support Vector Machine for Signal-to-Noise Prediction in Satellite-Terrestrial Networks. International Journal of Wireless Communications and Mobile Computing, 13(1), 1-22. https://doi.org/10.11648/j.wcmc.20261301.11
 Copy
|
Copy
|
 Download
ACS Style
Ajileye, O. G.; Akpan, V. A.; Ojo, J. S. Comparative Analysis of Random Forest and Bayesian Support Vector Machine for Signal-to-Noise Prediction in Satellite-Terrestrial Networks. Int. J. Wirel. Commun. Mobile Comput. 2026, 13(1), 1-22. doi: 10.11648/j.wcmc.20261301.11
Copy
|
Download
AMA Style
Ajileye OG, Akpan VA, Ojo JS. Comparative Analysis of Random Forest and Bayesian Support Vector Machine for Signal-to-Noise Prediction in Satellite-Terrestrial Networks. Int J Wirel Commun Mobile Comput. 2026;13(1):1-22. doi: 10.11648/j.wcmc.20261301.11
Copy
|
Download
-
@article{10.11648/j.wcmc.20261301.11,
  author = {Oladayo Gbolahan Ajileye and Vincent Andrew Akpan and Joseph Sunday Ojo},
  title = {Comparative Analysis of Random Forest and Bayesian Support Vector Machine for Signal-to-Noise Prediction in Satellite-Terrestrial Networks},
  journal = {International Journal of Wireless Communications and Mobile Computing},
  volume = {13},
  number = {1},
  pages = {1-22},
  doi = {10.11648/j.wcmc.20261301.11},
  url = {https://doi.org/10.11648/j.wcmc.20261301.11},
  eprint = {https://article.sciencepublishinggroup.com/pdf/10.11648.j.wcmc.20261301.11},
  abstract = {The convergence of terrestrial wireless and satellite communication systems within Satellite–Terrestrial Integrated Networks (STINs) for sixth-generation (6G) communications has increased the need for accurate and adaptive link performance prediction. Conventional analytical and empirical propagation models often fail to capture the nonlinear effects of atmospheric impairments, particularly rain attenuation in tropical regions. This study evaluates two supervised machine learning algorithms, Random Forest (RF) and Support Vector Machine (SVM), for predicting the signal-to-noise ratio (SNR), a key wireless communication link budget parameter. Rain rate, rain attenuation, and link budget were used as input variables with propagation datasets collected from ten climatically diverse locations across Nigeria. The datasets were partitioned into training, validation, and testing sets using a 70:15:15 ratio, while Bayesian optimization determined the optimal hyper-parameters of both models. Performance was evaluated using Root Mean Square Error (RMSE), Mean Absolute Error (MAE), Mean Squared Error (MSE), coefficient of determination (R2), regression analysis, and actual-versus-predicted time-series comparisons. Results show that both models accurately captured the nonlinear relationship between propagation parameters and SNR across all study locations. However, SVM consistently outperformed RF, recording lower RMSE, MAE, and MSE values in nine of the ten locations and achieving R2 values between 0.99 and 1.00. SVM also tracked severe fading events caused by intense rain attenuation more accurately, whereas RF exhibited larger deviations during deep fades. Minna was the only location where RF produced lower prediction errors. These findings demonstrate that SVM provides superior prediction accuracy and generalization for SNR estimation under tropical propagation conditions, making it a reliable tool for wireless link budget prediction and future 6G satellite–terrestrial network planning.},
 year = {2026}
}
Copy
|
Download
-
TY  - JOUR
T1  - Comparative Analysis of Random Forest and Bayesian Support Vector Machine for Signal-to-Noise Prediction in Satellite-Terrestrial Networks
AU  - Oladayo Gbolahan Ajileye
AU  - Vincent Andrew Akpan
AU  - Joseph Sunday Ojo
Y1  - 2026/09/22
PY  - 2026
N1  - https://doi.org/10.11648/j.wcmc.20261301.11
DO  - 10.11648/j.wcmc.20261301.11
T2  - International Journal of Wireless Communications and Mobile Computing
JF  - International Journal of Wireless Communications and Mobile Computing
JO  - International Journal of Wireless Communications and Mobile Computing
SP  - 1
EP  - 22
PB  - Science Publishing Group
SN  - 2330-1015
UR  - https://doi.org/10.11648/j.wcmc.20261301.11
AB  - The convergence of terrestrial wireless and satellite communication systems within Satellite–Terrestrial Integrated Networks (STINs) for sixth-generation (6G) communications has increased the need for accurate and adaptive link performance prediction. Conventional analytical and empirical propagation models often fail to capture the nonlinear effects of atmospheric impairments, particularly rain attenuation in tropical regions. This study evaluates two supervised machine learning algorithms, Random Forest (RF) and Support Vector Machine (SVM), for predicting the signal-to-noise ratio (SNR), a key wireless communication link budget parameter. Rain rate, rain attenuation, and link budget were used as input variables with propagation datasets collected from ten climatically diverse locations across Nigeria. The datasets were partitioned into training, validation, and testing sets using a 70:15:15 ratio, while Bayesian optimization determined the optimal hyper-parameters of both models. Performance was evaluated using Root Mean Square Error (RMSE), Mean Absolute Error (MAE), Mean Squared Error (MSE), coefficient of determination (R2), regression analysis, and actual-versus-predicted time-series comparisons. Results show that both models accurately captured the nonlinear relationship between propagation parameters and SNR across all study locations. However, SVM consistently outperformed RF, recording lower RMSE, MAE, and MSE values in nine of the ten locations and achieving R2 values between 0.99 and 1.00. SVM also tracked severe fading events caused by intense rain attenuation more accurately, whereas RF exhibited larger deviations during deep fades. Minna was the only location where RF produced lower prediction errors. These findings demonstrate that SVM provides superior prediction accuracy and generalization for SNR estimation under tropical propagation conditions, making it a reliable tool for wireless link budget prediction and future 6G satellite–terrestrial network planning.
VL  - 13
IS  - 1
ER  -
Copy
|
Download



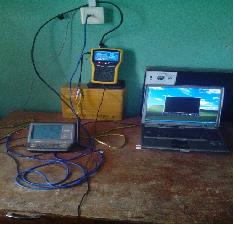
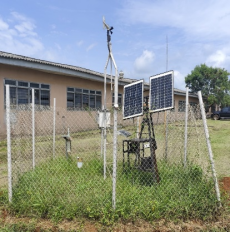
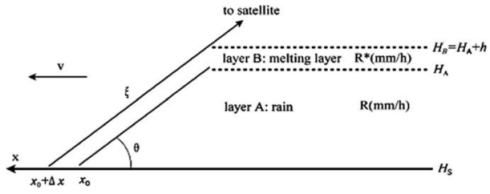
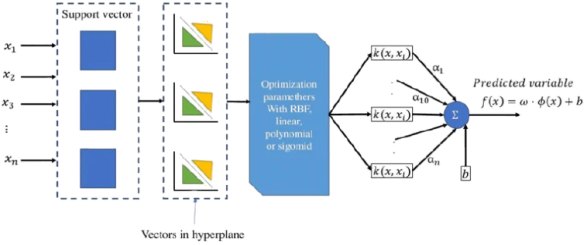
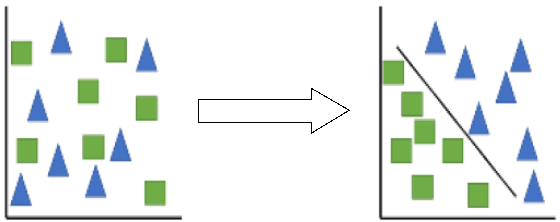
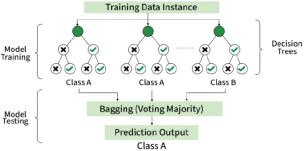
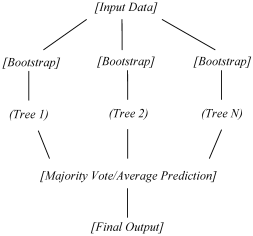
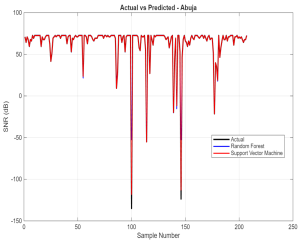
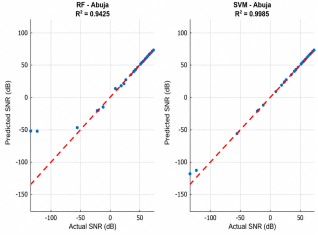
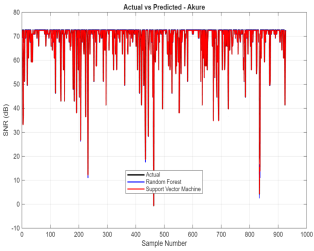
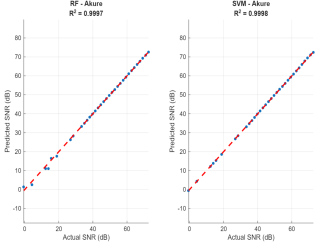
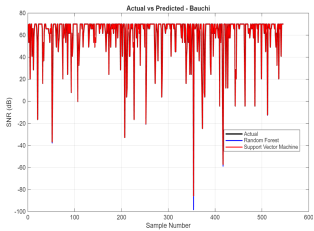
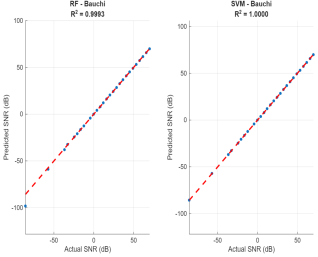
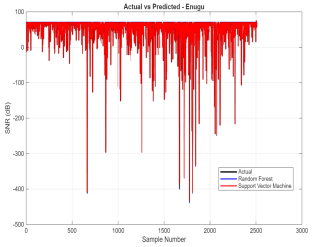
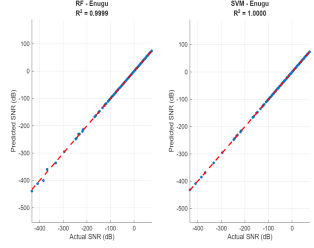
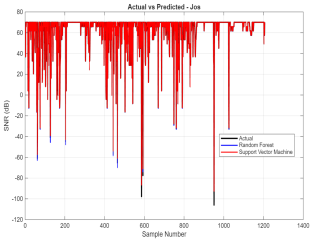
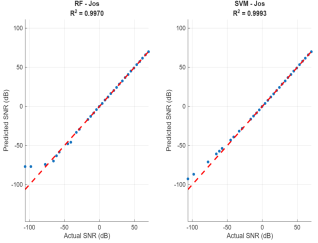
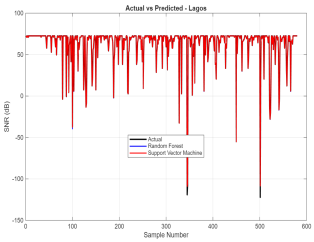
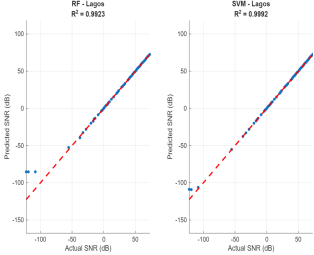
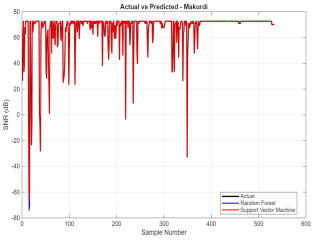
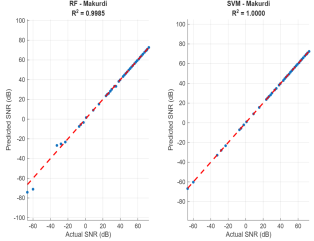
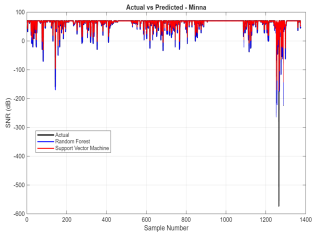
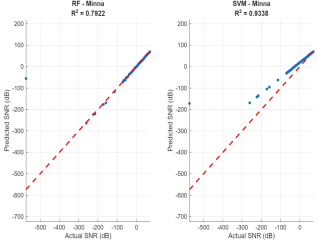
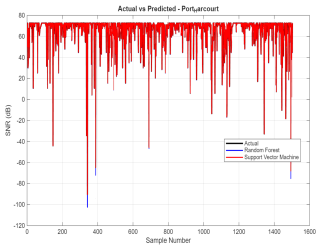
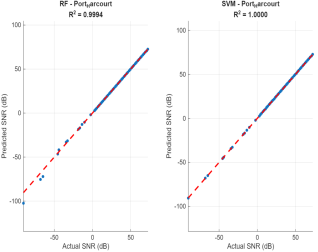
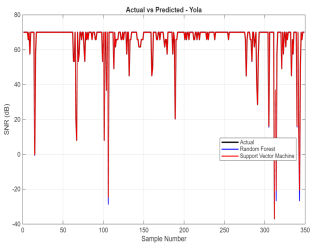
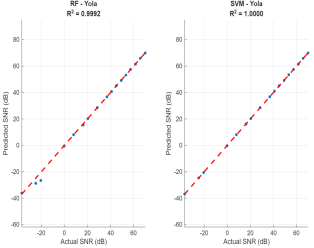
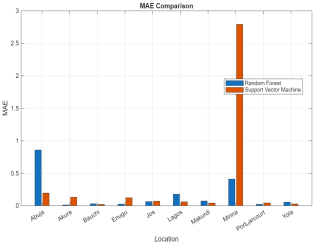
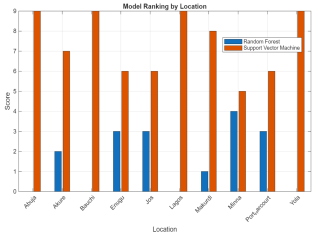
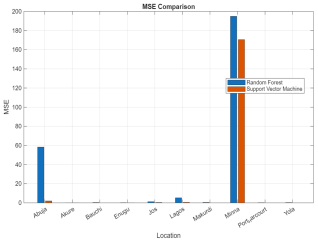
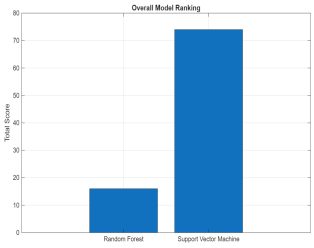
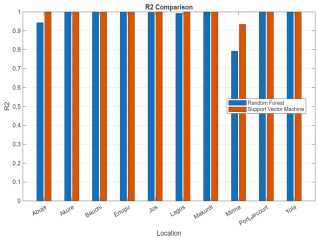
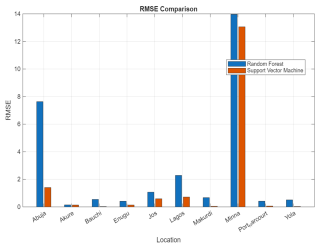




 Share This Article
 Twitter
 Linked In
 Facebook