Research Article | | Peer-Reviewed

Temporal and Spatial Distribution Characteristics of Torrential Flooding Disasters with Different Intensities in Tarim Basin

Received: 3 March 2024    Accepted: 7 April 2024    Published: 29 April 2024
Views:       Downloads:
Abstract

As torrential flooding often cause huge economic losses and casualties, analyzing the spatio-temporal variation characteristics of torrential flooding events is of great significance to disaster prevention and reduction. Based on five indicators for torrential floodingin the Tarim Basin in 1990-2019, ratio weighting and non-dimensional linear summation were employed to calculate disastrous loss indicators that represent disaster intensity. Afterwards, percentile method was used to divide disasters into four levels, i.e., general, relatively severe, severe and extremely severe. The results showed that the regions where Level-1 to Level-4 disasters frequently and recurrently occur are concentrated in Kizilsu Kirghiz Autonomous Prefecture, Aksu Prefecture and Kashgar Prefecture and that such disasters often take place from April to July. The interannual variation of the frequency and intensity of Level-1 disasters presented a linear upward trend, and the frequency and disastrous loss indicator increased by 14.6 and 0.8 per 10a, respectively. The interannual variation of the frequency and intensity of Level-2 to Level-4 disasters did not show a linear increase or decrease trend. The threshold for 12-hour precipitation that may cause torrential flooding in the basin from March and October is 10mm. The annual frequency of 12-hour precipitation exceeding the threshold increased year by year, so did the frequency and intensity of Level-1 disasters.

Published in Earth Sciences (Volume 13, Issue 2)
DOI 10.11648/j.earth.20241302.12
Page(s) 58-66
Creative Commons

This is an Open Access article, distributed under the terms of the Creative Commons Attribution 4.0 International License (http://creativecommons.org/licenses/by/4.0/), which permits unrestricted use, distribution and reproduction in any medium or format, provided the original work is properly cited.

Copyright

Copyright © The Author(s), 2024. Published by Science Publishing Group

Keywords

Torrential Flooding Disaster, Disaster Exponent, Disaster Intensity, Temporal and Spatial Distribution, Tarim Basin

1.Introduction
Torrential flooding refers to the disasters caused by torrential rains or long-time heavy rainfalls, such as mountain torrents, debris flows and urban waterlogging [1]. Torrential flooding is one of the most frequent and serious natural disasters in China, causing huge economic losses and casualties every year [2, 3]. The number of deaths caused by floods in China in 1953-2013 showed an overall downward trend, but economic losses and flood-affected crop areas were on the rise [4]. Given warm and humid climates, heavy precipitation events in some parts of China are increasing [5, 6], and the hazards from torrential flooding resulting from heavy rainfalls have escalated. In recent decades, urbanization and socioeconomic development led to increased exposure and vulnerability of material wealth in the process of population growth, and floods exerted growing impacts.
The research methods for torrential floodingin China and abroad are mainly divided into two categories. The first is to set comprehensive disaster indicators and disaster levels based on multiple factors such as disastrous loss, meteorological and hydrological elements and geographic information, and analyze the pattern of spatio-temporal changes in disasters on this basis. Chen Ying et al. discussed the change characteristics and influencing factors of floods in China according to the data regarding floods, arable area and annual precipitation in eastern China from the end of 19th century to the beginning of 21st century, after which they pointed out that scale periods were varied in flooding in the country and that there was a good correspondence between annual precipitation and flood variation cycle in eastern China. The second is to study disaster indicators in small time and space scales according to various factors such as disaster-causing factors, disaster-bearing environment and disaster-bearing bodies, and make division and prediction on this basis.
The relatively high-intensity rainstorms and the small vegetation cover area make the Tarim Basin highly prone to floods. The Tarim Basin saw a significantly higher proportion of direct economic losses caused by torrential flooding in annual GDP than most parts of China. Therefore, studies on the pattern of spatio-temporal changes in torrential flooding in the region are of important guiding significance to strengthening the disaster risk prevention ability. Up to now, Chinese scholars have carried out some research on torrential flooding in Xinjiang. For instance, Wang Ni et al. used linear regression to analyze precipitation and GDP data from 1984 to 2016 and found that the frequency of torrential flooding in Xinjiang was positively correlated with precipitation and GDP. Wu Meihua et al. analyzed the disaster-hit area and annual precipitation from 1949 to 2014 via the information diffusion theory and found that the elevated frequency and intensity of precipitation was the direct cause of increased floods in Xinjiang.
However, no studies have been conducted on the characteristics and causes of climates that may cause torrential flooding of different intensities in the Tarim Basin. With five disaster elements, namely the death toll, the number of collapsed houses, the number of collapsed folds, the number of livestock deaths and the disaster-hit area, regarding torrential flooding that occurred in 42 counties (cities) in the Tarim Basin from 1990 to 2019, the author used statistical methods to determine disastrous loss indicators that could comprehensively express disaster intensity. The disastrous loss indicator was used to rate disaster events by intensity. Based on these, analysis was conducted on the spatial and temporal distribution characteristics of torrential flooding of different intensities, and discussions were held on the causes of spatial and temporal variations in disasters according to short-time heavy precipitation.
2.Data and Methods

2.1. Data

The disaster information of 42 counties and cities around the Tarim Basin from 1990 to 2019 was collated according to records of torrential flooding kept by the Civil Affairs Department of Xinjiang Uygur Autonomous Region. The information was based on 1,191 records about the occurrence date (MM/DD/YYYY), occurrence region (county/city), death toll (persons), the number of collapsed houses (houses), the number of collapsed folds (folds), the number of livestock deaths (animals) and the disaster-hit area (hm2). In the case of torrential flooding occurred once in a county or city, the number of torrential flooding in the county or city was recorded as 1.
The causes of spatial and temporal distribution were analyzed based on 12-hour precipitation data from 38 meteorological stations around the Tarim Basin at night (20:00-08:00) and during the day (08:00-20:00) from the National Meteorological Information Centre.

2.2. Methods

Due to the different units of the five disaster elements, it is impossible to directly compare different disaster events. A disastrous loss indicator ( ) that can express the five disaster elements is required to facilitate the comparison of the intensity of each disaster event. The weight of each disaster element was determined by the ratio method, based on which was determined with the use of non-dimensional linear summation.
Assuming that each disaster element is composed of samples ( =1,191), a disaster element evaluation matrix Xn×5 can be created. The formula to calculate the disastrous loss indicator Zi is:
(1)
Where, =1, 2, …, , =1, 2, …, 5, and represent the mean value and weight of the th disaster element. The formula to calculate is:
(2)
Where, represents the maximum value of the th disaster element.
From the above formula, it can be seen that the maximum value is nondimensionalized in the determination of the weight, which can ensure the equivalence of the five disaster elements. The mean value is nondimensionalized in the calculation of the disastrous loss indicator, which can ensure certain difference in the disastrous loss indicator. After the calculation of Formula (1), the weight coefficient, the average and the maximum value of five disaster factors can be noted in Table 1.
Table 1. Weight coefficient, average and maximum value of disaster factors.

Deaths (persons)

Collapsed houses (houses)

Collapsed sheds (seats)

Livestock deaths (heads)

Crops affected area (hm2)

Weight

0.11

0.35

0.12

0.21

0.20

Average

0.4

159.1

72.3

441.8

1386.1

Maximum

35

4354

5854

20366

66530

The closeness between the disastrous loss indicator and disaster elements is determined from the correlation coefficient between the two. The correlation coefficients between the disastrous loss indicator and the death toll, the number of collapsed houses, the number of collapsed folds, the number of livestock deaths and the disaster-hit area were 0.45, 0.83, 0.68, 0.62, 0.37, respectively, and they were positively correlated and higher than the significance level of 0.001. This indicates that the disastrous loss indicator can not only comprehensively express the five disaster elements but reflect the intensity of the disaster event. The percentile method is used to determine the damage exponent grade. Percentile is a kind of position exponent. According to the range of threshold change, the disaster is divided into four grades representing different strengths (specificresults are listed in Table 2).
Table 2. Grading criteria of storm flood disasters in Tarim Basin.

Percentile r (%)

Disaster exponent Zi

Disaster grade

r≤50

Zi≤0.29692

Mild (Grade 1)

50.1≤r≤75

0.29693≤Zi≤1.10682

Moderate (Grade 2)

75.1≤r≤90

1.10683≤Zi≤2.97784

Severe (Grade 3)

r≥90.1

Zi≥2.97785

Extremely severe (Grade 4)

3. Results and Analysis

3.1. Spatial Distribution

The GIS natural breaks classification was adopted to make the spatial distribution of torrential flooding by frequency and disastrous loss indicator. This method can fully express the similarity and difference between the data (Figure 1). The regions were ranked by annual frequency in descending order: Aksu Prefecture in the northern basin, Kizilsu Kirgiz Autonomous Prefecture (referred to as “Kezhou”) and Kashgar Prefecturein western basin, Hotan Prefecturein southern basin, and Mongolia Bayinguoleng Autonomous Prefecture (referred to as “Bazhou”) in eastern basin. The regions were ranked by disastrous loss indicator in descending order: Kashgar Prefecture, Aksu Prefecture, Kezhou, Hotan Prefecture and Bazhou. Therefore, disasters frequently and recurrently occurred in Aksu Prefecture, Kashgar Prefecture and Kezhou. Much attention should be paid to the prevention of disasters in these regions. The top three counties by annual frequency are Baicheng, Wensu and Akto, while the top three counties by disastrous loss indicator are Shache, Aksu and Jiashi.
The 12-hour precipitation sequence corresponding to the disaster event was composed by the maximum precipitation for 20:00-08:00 and 08:00-20:00 periods on the day when a torrential flood event occurred. The threshold for 12-hour precipitation that may cause torrential flooding is 10mm, which was calculated with the use of percentile method under r = 20. Torrential flooding often took place from March to October (see the following section for details). Data was collected about the frequency (Nk, k = 1, 2, …, 38) of 12-hour precipitation greater than or equal to 10mm from 38 meteorological stations around the Tarim Basin from March to October in 1990-2019, indicating that the region with a high value of Nk is a region where disasters frequently and recurrently occurred.
Figure 1. Geographical distribution of annual occurrence times (a) and annual disaster exponent (b) of storm flood disasters in Tarim Basin.
The geographical distribution of the annual frequency of Level-1 to Level-4 disasters shows obvious difference (Figure 2). Level-1 disasters occurred most in Kezhou, followed by Aksu Prefecture. Level-2 disasters occurred most in Aksu Prefecture, followed by Hotan Prefecture. Level-3 disasters occurred most in Kashgar Prefecture, followed by Aksu Prefecture. Level-4 disasters occurred most in Aksu Prefecture, followed by Kashgar Prefecture. The top four counties by annual frequency of Level-1 to Level-4 disasters are Baicheng, Wensu, Akto and Shache.
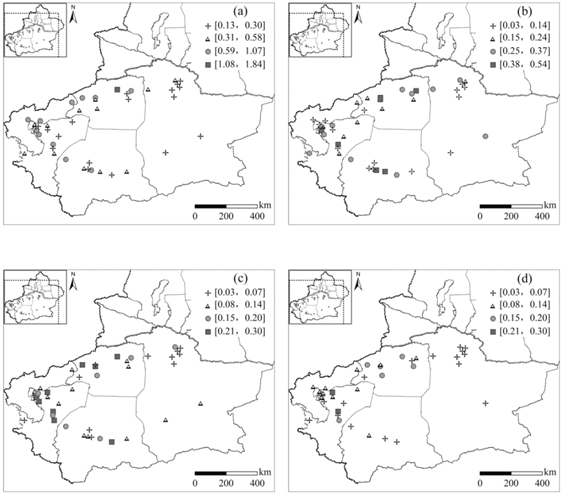
Figure 2. Geographical distribution of annual occurrence times of storm flood disasters with grades 1 to 4 in Tarim Basin. (a), (b), (c) and (d) respectively represent grade 1 to 4 disasters.

3.2. Monthly and Seasonal Variation

The frequency of a certain level of disasters in a month refers to the result of the total number of disasters in 42 counties and cities from 1990 to 2019 divided by 30 (years), which is similar to the method to calculate the disastrous loss indicator and the frequency (RM) of 12-hour precipitation exceeding 10mm. Torrential flooding in the basin often took place from March to October, presenting an unimodal distribution. June saw the highest number of torrential floods, which were concentrated in May-August, with frequency accounting for 82% of the total. Level-1 and Level-2 disasters were concentrated in May-August, with peaks in July and June, respectively. Level-3 and Level-4 disasters were concentrated in April-July, with peaks in June and July, respectively (Figure 3).
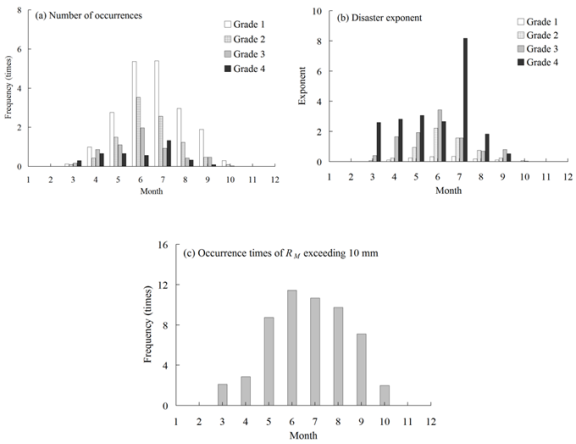
Figure 3. The seasonal distribution of occurrence times (a) and disaster exponent (b) of storm flood disasters with grade 1 to 4 in Tarim Basin, and the seasonal distribution of occurrence times of precipitation exceeding 10mm in 12h from March to October (c) in Tarim Basin.
Both the intensities of torrential flooding and Level-1 to Level-4 disasters were higher in April-July and the highest in July. As shown in Figure 3c, the monthly distribution of RM is very similar to that of the frequency and the intensity of disasters. This suggested that 12-hour heavy rainfalls were easy to cause flooding in the basin.

3.3. Interannual Variation

The interannual variation of the frequency and disastrous loss indicator for Level-1 to Level-4 torrential floods in the Tarim Basin shows diversity (Figure 4). The frequency and disastrous loss indicator of Level-1 disasters demonstrated a linear upward trend (Figure 4a and Figure 4b), up by 14.6 and 0.8 per 10a, respectively. The frequency and disastrous loss indicator of Level-2 disasters fluctuated around the climate normal at 9.9 and 6.0 (Figure 4c and Figure 4d), showing no linear increase or decrease trend. The maximum values appeared in 1992, 1996 and 2010 respectively. The frequency and disastrous loss indicator of Level-3 disasters moved around the climate normal at 5.6 and 9.3 (Figure 4e and Figure 4f). The frequency and disastrous loss indicator of Level-4 disasters fluctuated around the climate normal at 4.0 and 21.5 (Figure 4g and Figure 4h). The maximum values appeared in 1996 and 1999.
RY expresses the number of meteorological stations that detected 12-hour precipitation of more than 10mm from March to October in a year. As shown in Figure 4h, RY increased amid fluctuations. The regression equation for RY and the frequency (Y1) of Level-1 disasters: Y1 = 0.28RY+ 4.31 (R = 0.43, P = 0.02), and the regression equation for RY and the disastrous loss indicator (Z1) of Level-1 disasters: Z1 = 0.02RY+ 0.06 (R = 0.49, P = 0.005). The correlation coefficient R and significance level P in the regression equations fully indicate that Y1, Z1 are closely related to RY. Therefore, as RY increased year by year, Y1 and Z1 showed a linear upward trend.
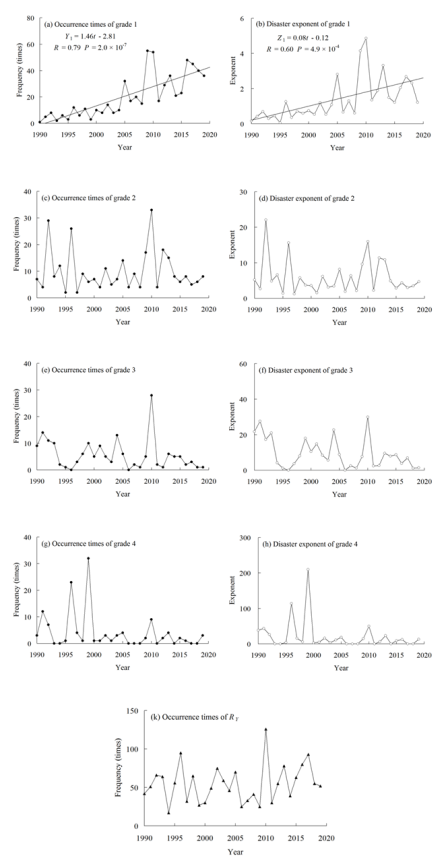
Figure 4. Interannual variation of occurrence times and damage exponent of storm flood disasters with 1-4 (a-h) in Tarim Basin, occurrence times of precipitation exceeding 10mm in 12h (k) in Tarim Basin.
Figure 5 shows the interannual variation of the frequency (Y) and disastrous loss indicator (Z) for torrential flooding. The Y value for a given year is the sum of frequencies of Level-1 to Level-4 disasters, and the Z value for the given year is the sum of disastrous loss indicators of Level-1 to Level-4 disasters. Y and Z demonstrate the frequency and intensity of torrential flooding in the basin. The ratio of the average frequency of Level-1 to Level-4 disasters to the mean value of Y represents the contribution rate of the frequency of Level-1 to Level-4 disasters to Y. Similarly, the contribution rate of the disastrous loss indicator of Level-1 to Level-4 disasters to Z can be calculated. The results showed that the contribution rate of the frequency of Level-1 to Level-4 disasters to Y is 50%, 25%, 15% and 10% respectively, and the contribution rate of the disastrous loss indicator of Level-1 to Level-4 disasters to Z is 4%, 16%, 24% and 56% respectively. It can be seen that the interannual variation of Y is mainly affected by Level-1 disasters, while the interannual variation of Z is mainly affected by Level-4 disasters. Therefore, the frequency of disasters in the basin presented a significant linear uptrend, and the disastrous loss indicator fluctuated around the climate normal. The maximum values appeared in 1996 and 1999.
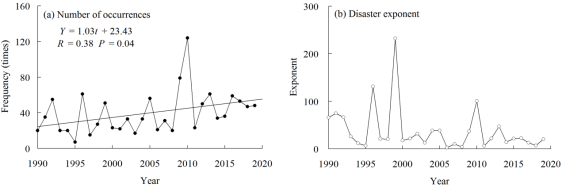
Figure 5. Interannual variation of occurrence times (a) and disaster exponent (b) of storm flood disasters in Tarim Basin.
4. Conclusions
From the perspective of spatial distribution, the regions where torrential flooding frequently and recurrently occurred in the Tarim Basin are Aksu Prefecturein northern basin and Kezhou and Kashgar Prefecturein western basin. Much attention should be paid to the prevention of disasters in these regions. The two regions that saw the highest frequency of Level-1disasters are Kezhou and Aksu Prefecture, Aksu Prefecture and Hotan Prefecture for Level-2 disasters, Kashgar Prefecture and Aksu Prefecture for Level-3 disasters, and Aksu Prefecture and Kashgar Prefecture for Level-4 disasters. The regions with 12-hour precipitation of more than 10mm in March-October are the regions where disasters frequently and recurrently occurred.
In terms of monthly distribution, torrential floods in the basin often took place from March to October and were concentrated in May-August. Level-1 and Level-2 disasters were concentrated in May-August, with peaks in July and June, respectively. Level-3 and Level-4 disasters were concentrated in April-July, with peaks in June and July, respectively. The intensity of disasters in the basin was higher in April-July. The monthly distribution of the intensity of Level-1 to Level-4 disasters was similar to that of the frequency of disasters. The monthly distribution of the frequency of 12-hour precipitation of more than 10mm was consistent with that of the frequency and intensity of disasters.
As far as interannual variation is concerned, the frequency and intensity of Level-1 disasters showed a significant linear uptrend, up by 14.6 and 0.8 per 10a, respectively. The frequency and disastrous loss indicator of Level-2 to Level-4 disasters fluctuated around the climate normal, showing no linear increase or decrease trend. There is a remarkable positive correlation between the frequency (RY) of 12-hour precipitation of more than 10mm in March-October and the frequency and disastrous loss indicator of Level-1disasters. This indicates that the continuous increase of RY led to a linear increase in the frequency and intensity of Level-1 disasters.
The research shows that short-term heavy rainfall is the disaster causing factor of torrential flooding, and short-term heavy rainfall can be used to carry out the research on forecasting methods of torrential flooding in the future.
Abbreviations
Kezhou: Kizilsu Kirghiz Autonomous Prefecture
Bazhou: Mongolia Bayinguoleng Autonomous Prefecture
Author Contributions
Nuyiyeti: Writing – original draft
Chenliang Liu: Resources, Visualization
Xiaofeng Xie: Project administration
Ming Hu: Data curation
Lei Hao: Conceptualization, Writing – review & editing
Acknowledgments
This work was supported by Jin Feng Hua Yun Development Fund Project (Climatic characteristics of flood disasters caused by rainstorm with different intensities in Tarim Basin).
Conflicts of Interest
The authors declare no conflicts of interest.
References
[1] CHEN Baoxin, CHEN Kan, WANG Xi, et al.. (2022) Spatial and temporal distribution characteristics of rainstorm and flood disasters around Tarim Basin [J]. Polish Journal of Environmental Studies, 31(3): 1-9.
[2] MA Zhongjing. (1994) China’s major natural disasters and disaster reduction countermeasures (general) [M]. Beijing: Science Press, 11-22.
[3] SONG Lanchong. (2015) Yearbook of meteorological disasters in China (2014) [M]. Beijing: Meteorological Press, 1-8.
[4] WAN Jinhong, ZHANG Baowei, LIU Jiangang, et al..(2016) The distribution of flood disaster loss during 1950-2013 [J]. Journal of Catastrophology, 31(2): 63-68.
[5] MIN Airong, LIAO Yishan, DENG Weng. (2016) The analysis of the distribution and trend for heavy rainfall based on the precipitation data from 2008 to 2013 in China [J]. Torrential Rain and Disasters, 35(6): 576-584.
[6] LI Weijing, ZUO Jinqing, SONG Yanlng, et al.. (2015) Changes in spatio-temporal distribution of drought/flood disaster in Southern China under global climate warming [J]. Meteorological Monthly, 41(3): 261-271.
[7] CAO J T, LI Y Y, SHEN F X, et al.. (2012) Drawing down our resources: estimating the total appropriation of water in China [J]. Water International, 37: 512-522.
[8] Barredo J I. (2007) Major flood disasters in Europe: 1950-2005 [J]. Natural Hazards, 42(1): 125-148.
[9] WEN Quanpei, ZHOU Youhwa, HUO Zhiguo, et al.. (2017) Risk changes of storm flood disasters in southeast China under climatic warming [J]. Chinese Journal of Ecology, 36(2): 483-490.
[10] WU Shaohong, YIN Yunhe. (2012) Impacts of climate extremes on human systems [J]. Advances in Climate Change Research, 8(2): 99-102.
[11] LIU Yanhua, LI Juzhang, ZHAO Yuolong. (1995) Regional characters of natural disaster in the last years in China [J]. Geographical Research, 14(3): 14-25.
[12] ZHAO Axing, MA Zongjin. (1993) Appraising study for the loss evaluation system of natural disasters [J]. Journal of Natural Disasters, 2(3): 1-7.
[13] JIANG Lingfeng. (2018) Analysis on the characteristics of flood disaster damage in China in recent 76 years [J]. Advances in Meteorological Science and Technology. 8(5): 11-16.
[14] ZHANG Pen, ZHANG Yunxia, SUN Zhou, et al. (2015) Natural disaster index: a quantitative measure for assessing natural disaster losses [J]. Journal of Catastrophology, 30(4): 74-78.
[15] XIANG Ying, ZHANG Yuqing, XU Qi, et al. (2019) Temporal and spatial distribution and evolution characteristics of major meteorological disasters in Jiangsu Province [J]. Chinese Agricultural Science Bulletin, 35(19): 112-119.
[16] LIAO Yongfeng, ZHAO Fei, WANG Zhiqiang, et al.. (2013) Spatial pattern analysis of natural disasters in China from 2000 to 2011 [J]. Journal of Catastrophology, 28(4): 55-60.
[17] SHEN Cheng, SUN Yan, YIN Dongping, et al.. (2015) Characteristic analysis of rainstorm-induced flood disaster in Jiangsu Province [J]. Journal of Natural Disasters, 24(2): 203-212.
[18] CHEN Ying, YIN Yixing, CHEN Xingwei. (2011) Change of flood disasters in China since the 1880s and some possible causes [J]. Journal of Natural Resources, 26(12): 2110-2120.
[19] LIU Shaojun, ZHANG Jinghons, CAI Daxin, et al.. (2015) Risk zoning of main meteorological disasters of natural rubber in Hainan Island [J]. Journal of Natural Disasters, 24(3): 177-183.
[20] MA Rong, BAI Tao, HUANG Qiang, et al.. (2017) MIKE 21 model and its application on urban waterlogging simulation [J]. Journal of Natural Disasters, 26(4): 172-179.
[21] GAO Chao, ZHANG Zhengtao, LIU Qing, et al.. (2018) Study on the optimal grid method in assessment of vulnerability to floods disaster-A case case study in the mainstream of Huaihe River Basin [J]. Journal of Natural Disasters, 27(3): 119-129.
[22] HUANG Yuxia, WANG Baojian, HUANG Wubin, et al.. (2019) A review on rainstorm research in northwest China [J]. Torrential Rain and Disasters, 38(5): 515-525.
[23] YU Li, XU Ying, ZHANG Yongxiang. (2018) Temporal and spatial variation of rainstorms and the impact of flood disasters due to rainstorms in China in the past 25 years [J]. Torrential Rain and Disasters, 37(1): 67-72.
[24] WANG Ni, CUI Caixia, LIU Yan. (2020) Temporal-spatial characteristics and the influencing factors of rainstorm-flood disasters in Xinjiang [J]. Arid Zone Research, 37(2): 325-330.
[25] WU Meihua, WANG Huaijun, SUN Guili, et al.. (2016) Formation and risk analysis of meteorological disasters in Xinjiang [J]. Arid Land Geography, 39(6): 1212-1220.
[26] JIA Junpimg. (2004) Statistics [M]. Beijing: Tsinghua University Press, 68-71.
[27] ZHAO Qingbo, LI Li. (1999) Method of calculating percentiles using original data [J]. China Health Statistics, 16(3): 185.
[28] LI Naiqiang, XU Guiyang. (2020) Grid analysis of land use based on natural breaks classification [J]. Bulletin of Surveying and Mapping, (4): 106-110, 156.
Cite This Article
  • APA Style

    Nuyiyeti, Liu, C., Xie, X., Hu, M., Hao, L. (2024). Temporal and Spatial Distribution Characteristics of Torrential Flooding Disasters with Different Intensities in Tarim Basin. Earth Sciences, 13(2), 58-66. https://doi.org/10.11648/j.earth.20241302.12

    Copy | Download

    ACS Style

    Nuyiyeti; Liu, C.; Xie, X.; Hu, M.; Hao, L. Temporal and Spatial Distribution Characteristics of Torrential Flooding Disasters with Different Intensities in Tarim Basin. Earth Sci. 2024, 13(2), 58-66. doi: 10.11648/j.earth.20241302.12

    Copy | Download

    AMA Style

    Nuyiyeti, Liu C, Xie X, Hu M, Hao L. Temporal and Spatial Distribution Characteristics of Torrential Flooding Disasters with Different Intensities in Tarim Basin. Earth Sci. 2024;13(2):58-66. doi: 10.11648/j.earth.20241302.12

    Copy | Download

  • @article{10.11648/j.earth.20241302.12,
      author = {Nuyiyeti and Chenliang Liu and Xiaofeng Xie and Ming Hu and Lei Hao},
      title = {Temporal and Spatial Distribution Characteristics of Torrential Flooding Disasters with Different Intensities in Tarim Basin
    },
      journal = {Earth Sciences},
      volume = {13},
      number = {2},
      pages = {58-66},
      doi = {10.11648/j.earth.20241302.12},
      url = {https://doi.org/10.11648/j.earth.20241302.12},
      eprint = {https://article.sciencepublishinggroup.com/pdf/10.11648.j.earth.20241302.12},
      abstract = {As torrential flooding often cause huge economic losses and casualties, analyzing the spatio-temporal variation characteristics of torrential flooding events is of great significance to disaster prevention and reduction. Based on five indicators for torrential floodingin the Tarim Basin in 1990-2019, ratio weighting and non-dimensional linear summation were employed to calculate disastrous loss indicators that represent disaster intensity. Afterwards, percentile method was used to divide disasters into four levels, i.e., general, relatively severe, severe and extremely severe. The results showed that the regions where Level-1 to Level-4 disasters frequently and recurrently occur are concentrated in Kizilsu Kirghiz Autonomous Prefecture, Aksu Prefecture and Kashgar Prefecture and that such disasters often take place from April to July. The interannual variation of the frequency and intensity of Level-1 disasters presented a linear upward trend, and the frequency and disastrous loss indicator increased by 14.6 and 0.8 per 10a, respectively. The interannual variation of the frequency and intensity of Level-2 to Level-4 disasters did not show a linear increase or decrease trend. The threshold for 12-hour precipitation that may cause torrential flooding in the basin from March and October is 10mm. The annual frequency of 12-hour precipitation exceeding the threshold increased year by year, so did the frequency and intensity of Level-1 disasters.
    },
     year = {2024}
    }
    

    Copy | Download

  • TY  - JOUR
    T1  - Temporal and Spatial Distribution Characteristics of Torrential Flooding Disasters with Different Intensities in Tarim Basin
    
    AU  - Nuyiyeti
    AU  - Chenliang Liu
    AU  - Xiaofeng Xie
    AU  - Ming Hu
    AU  - Lei Hao
    Y1  - 2024/04/29
    PY  - 2024
    N1  - https://doi.org/10.11648/j.earth.20241302.12
    DO  - 10.11648/j.earth.20241302.12
    T2  - Earth Sciences
    JF  - Earth Sciences
    JO  - Earth Sciences
    SP  - 58
    EP  - 66
    PB  - Science Publishing Group
    SN  - 2328-5982
    UR  - https://doi.org/10.11648/j.earth.20241302.12
    AB  - As torrential flooding often cause huge economic losses and casualties, analyzing the spatio-temporal variation characteristics of torrential flooding events is of great significance to disaster prevention and reduction. Based on five indicators for torrential floodingin the Tarim Basin in 1990-2019, ratio weighting and non-dimensional linear summation were employed to calculate disastrous loss indicators that represent disaster intensity. Afterwards, percentile method was used to divide disasters into four levels, i.e., general, relatively severe, severe and extremely severe. The results showed that the regions where Level-1 to Level-4 disasters frequently and recurrently occur are concentrated in Kizilsu Kirghiz Autonomous Prefecture, Aksu Prefecture and Kashgar Prefecture and that such disasters often take place from April to July. The interannual variation of the frequency and intensity of Level-1 disasters presented a linear upward trend, and the frequency and disastrous loss indicator increased by 14.6 and 0.8 per 10a, respectively. The interannual variation of the frequency and intensity of Level-2 to Level-4 disasters did not show a linear increase or decrease trend. The threshold for 12-hour precipitation that may cause torrential flooding in the basin from March and October is 10mm. The annual frequency of 12-hour precipitation exceeding the threshold increased year by year, so did the frequency and intensity of Level-1 disasters.
    
    VL  - 13
    IS  - 2
    ER  - 

    Copy | Download

Author Information