Research Article | | Peer-Reviewed

A Comprehensive Assessment of Meteorological and Hydrological Drought Under Climate Change over the Upper Baro Watershed

Received: 23 May 2025     Accepted: 11 June 2025     Published: 14 July 2025
Views:       Downloads:
Abstract

Drought is a complex natural hazard resulting from meteorological and hydrological phenomena. Meteorological drought, defined by precipitation shortfalls, frequently precedes hydrological drought, decreasing surface and groundwater availability. The Upper Baro Watershed, an important agricultural and hydrological hub in Ethiopia, is becoming more vulnerable to climate change-induced droughts. This article investigates the comprehensive assessment of the meteorological and hydrological drought, focusing on their roles in the hydrological cycle, the transition from meteorological to hydrological drought, and the consequences for water resources management. The Standardized Precipitation Index (SPI) and the Stream Drought Index (SDI) are used to perform a thorough evaluation of the hydrological and meteorological drought characteristics of historical and projected future drought in the upper Baro watershed. Historical model data from 1985 to 2014, along with estimates under the SSP2-4.5 and SSP5-8.5 emission scenarios for the middle of the century (2041-2070) and end of the century (2071-2000). The association between the SPI and SDI indices was studied over 30 years across the basin. Overlapping periods of 3, 6, 9, and 12 months were discovered. This study analyzes the top four climate models, including MPI-ESM1-2-HR, FGOLAS-g3, GFDL-ESM4, and INM-CM4-8. These models are assessed based on the upper Baro watershed. The findings reveal that in the study area, the MPI-ESM1-2-HR and INM-CM4-8 models are the best-performing climate models for the upper Baro watershed under the future climate scenarios SSP2-4.5 and SSP5-8. The comprehensive assessment of the meteorological and hydrological drought under SSP2-4.5 and SSP5-8.5 climate scenarios. The findings show that in mid-century (2041-2071), under the SSP2-4.5 and SSP5-8.5 emission scenarios, moderately wet to severely dry conditions will occur. Additionally, by the end of the century (2071-2100), under the SSP2-4.5 and SSP5-8.5 emission scenarios, moderately dry to severe drought conditions will emerge over the upper Baro watershed. The findings suggest that both the SPI and SDI indices are capable of catching major droughts in the upper Baro watershed over the last 30 years. The study recommended that understanding this link is crucial for successful drought monitoring, forecasting, and mitigation efforts.

Published in Earth Sciences (Volume 14, Issue 4)
DOI 10.11648/j.earth.20251404.11
Page(s) 129-141
Creative Commons

This is an Open Access article, distributed under the terms of the Creative Commons Attribution 4.0 International License (http://creativecommons.org/licenses/by/4.0/), which permits unrestricted use, distribution and reproduction in any medium or format, provided the original work is properly cited.

Copyright

Copyright © The Author(s), 2025. Published by Science Publishing Group

Keywords

Drought, Meteorological and Hydrological Drought, Climate Change, CMIP6

1. Introduction
Background
Drought is a long-term lack of water that has serious consequences for ecosystems, agriculture, and human societies . Droughts are often characterized as meteorological, hydrological, agricultural, or socioeconomic, with meteorological and hydrological droughts being intimately related throughout the hydrological cycle Droughts are becoming more frequent and severe around the world as the climate warms . Drought is a worldwide natural hazard and severely affects the social, environmental, and economic aspects . However, drought is one of the most common natural disasters that has a great negative impact on agriculture and water resources projects in a wide range .
The drought that occurred in East Africa between 2020 and 2023 had serious consequences, including widespread food insecurity, hunger, and displacement. More than 30 million people were food insecure, and millions of animals died. The drought also intensified existing tensions and conflicts, putting an additional strain on already vulnerable populations . Hydrological droughts are the most dangerous and worrying type of drought because they have multiple long-term detrimental effects on natural ecosystems, agricultural capacity, and a region's water regime.
The assessment of droughts affecting agricultural areas in Africa is highly relevant. Many African countries strongly rely on rain-fed agriculture. Since rainfall is commonly the limiting factor of rain-fed farm systems, droughts can lead to severe socioeconomic consequences like crop failure, food shortages, and even humanitarian crises . For example, drought events have caused over 800,000 deaths and affected about 262 million people in Africa from 1900 to 2013 . Ethiopia has also experienced severe droughts in recent years. Researchers have thought that severe drought has occurred once in three to ten-year recurrence intervals. Ethiopia has also faced severe drought in recent centuries .
The upper Baro watershed is one parts of the Baro Akobo River Basin. However, the watershed is extremely sensitive to hydro-climatic extremes, such as droughts and floods, which are exacerbated by climate variability and change. These extremes endanger water supply, food security, and livelihoods, especially in a region where more than 80% of the population depends on subsistence agriculture. The increasing frequency and severity of droughts, caused by global warming and regional climatic shifts, necessitate a thorough understanding of drought dynamics to enable adaptive water resource management and sustainable development. Pervious study evaluated the association between climate extremes and floods over Baro Akobo River River Basin. However it is little attention to assess the progation of the drought over the study area. The current study seeks to address the gap by evaluating the comprehensive assessment of meteorological and hydrological drought under climate change over the upper Baro watershed.
2. Materials and Methods
2.1. Description of the Study Area
The Upper Baro River Basin is located in southwestern Ethiopia and is a key portion of the Baro-Akobo Basin, a transboundary watershed that feeds into the Nile River. Geographically, it is located between latitudes 5°40′N and 10°50′N and longitudes 33°20′E and 36°20′E, spanning approximately 76,000 km². The basin is part of the Benishangul-Gumuz, Gambella, Oromia, and Southern Nations, Nationalities, and Peoples' Region (SNNPR) administrative areas, and its western edge forms an international border with South Sudan. Major tributaries include the Baro River, as well as the Alwero, Gilo, and Akobo rivers .
The Upper Baro River Basin features a diverse and complex topography, with challenging terrain that varies in elevation from 416 meters above sea level in the lowland plains to 3,266 meters in the western Ethiopian highlands. The basin includes high plateaus, mountainous areas, and extensive plains, particularly in the Gambella region. The highlands receive more rainfall, while the lowlands experience an unimodal rainfall pattern from February to November, decreasing westward and at lower elevations. Annual rainfall varies significantly, typically ranging from 800 to 2,000 mm, and temperatures show considerable diurnal changes that decrease with altitude . The basin is rich in freshwater resources, supporting irrigation, hydropower potential, and local livelihoods.
2.2. Data Types and Sources
2.2.1. Meteorological Data
For this study, daily rainfall data for 16 meteorological stations in the upper baro watershed were obtained from the Ethiopian Meteorological Institute (EMI) for the years from 1985-2020. From this data for climate model evaluation, we used (1985-2014), and for future analysis, we used (1991-2020). Additionally, the Enhanced National Climate Services (ENACTS) dataset (1985-2020) was acquired from the same institute and used to fill in missed data. The ENACTS dataset is a high-resolution gridded dataset (4 km x 4 km), and it is essential for a country like Ethiopia, where stations are sparse. The data are integrated with quality-controlled station data from the national observation network and regionally calibrated satellite-derived data .
2.2.2. GCM Dataset
The recently released GCM CMIP6 climate model data outputs were obtained from the Earth System Grid Federation (ESGF) (https://esgf-node.ipsl.upmc.fr/search/cmip6-ipsl). The ensemble member (r1i1p1f1) is used in all models . The baseline historical climate data spans from 1984 to 2014. The projection period is divided into the middle century (2041-2070) and the end of the century (2071-2100) under two shared socioeconomic pathways (SSP2-4.5 and SSP5-8.5). Choosing high (SSP5-8.5) and medium-low (SSP2-4.5) emission scenarios in climate research enables thorough risk assessment, policy relevance, and model development, providing crucial insights into the potential effects of different greenhouse gas emission levels and socioeconomic development paths on future climate change, and is also commonly used in climate change impact studies. In analyzing standardized extreme values, the WMO advises considering periods greater than 30 years and all available years with quality observations . We used the Multiple Models Ensemble Mean to project future meteorological and hydrological drought over the study area.
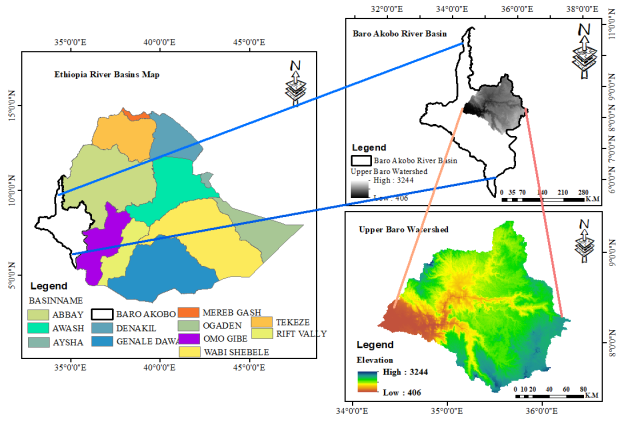
Figure 1. The study area Map for Upper Baro Watershed.
2.2.3. Hydrological Data
This study utilizes daily discharge data from Ethiopia's Ministry of Water and Energy (1991-2005). The continuity of the data may contain gaps due to factors such as observer absence, instrument failure, or quality issues. The discharge data outliers were examined using climate data tools (CDT), and the missing values were filled in using Stata 13 software. There are two main methods for filling streamflow data in the Stata 13 software R package (linear interpolation and mean imputation methods). For this study, we selected the linear interpolation method because it can effectively fill in the missing values by using linear interpolation . In this study, we used a 12.5m x 12.5m Resolution Digital Elevation Model (DEM) from the USGS Earth Explorer website (https://earthexplorer.usgs.gov/).
2.3. Methods
2.3.1. Data Quality Control
According to , meteorological data from stations might be affected by their location, changes in land use, instrument adjustments, observational issues, etc. These outcomes provide irrational values. To identify the inaccurate values in the weather datasets, the meteorological data from every station was quality-controlled and examined for data outliers. For this study, we are using Climate Data Tools (CDT) for data outlier and homogeneity tests.
2.3.2. GCM CMIP6 Climate Models Description and Evaluation
GCM CMIP6 climate models, in general, are a package of climate models; however, there are more than 40 models in the CMIP6 climate package; for this study, we selected recently released twelve GCM CMIP6 climate models based on the availability of data, different climate models do not hold all parameters, such as temperature (minimum and maximum) and precipitation, and ensemble member (r1i1p1f1) is used in all of the models. Using the Climate Data Operation (CDO) and Climate Data Tools (CDT) software, we extracted twelve chosen climate models at the station level on a regional scale. Since the various climate models have different spatial resolutions, we utilized the bilinear interpolation method to re-grid the models to a common resolution (10x10). The bilinear interpolation method, which extracted the data at the proper latitude and longitude, allowed for examinations at the same resolution. According to the previous study findings , we selected top four best-performed climate models over the basin such as MPI-ESM1-2-HR, INM-CM4-8, FGOALS-g3, and GFDL-ESM4 performed best for precipitation over the study area.
2.3.3. Bias Data Corrector Tools (CDBC)
Bias correction is the practice of eliminating systematic biases to enhance the fit between climate model outputs and historical observed data. By using bias correction techniques and projecting future data, this is achieved. The CDBC tool for bias correction of climate model outputs was developed using the quantile mapping approach because it is simple, effective, and low in computing cost. The quantile mapping approach (also known as 'probability mapping' and 'distribution mapping') involved developing the statistical relationship between observed and model-simulated outputs by replacing the simulated values with observed ones at the same cumulative density function (CDF) of the used distribution based on the climate variable. The distributions and equations used for the bias correction of precipitation.
Gamma/Precipitationx̅ms.corr=Foh-10 Fmhxms, xms>xth or xms<xth(1)
This technique uses Cumulative Distribution Functions (CDFs), which are objectively calculated from past data, to map simulated and observed data. The bias coefficient is used to correct future CMIP6 climate data (temperature and precipitation) after being adjusted based on historical and observed data.
2.3.4. HEC-HMS Hydrological Model Descriptions
The HEC-HMS (Hydrologic Modeling System) is a software tool created by the Hydrologic Engineering Center (HEC) of the United States Army Corps of Engineers to simulate watershed hydrologic processes. It is commonly used in rainfall-runoff modeling, flood forecasting, and water resource management . The HEC-HMS model is one of the hydrological models that needs little input data and provides a reliable result . It is widely used due to its ability to simulate short- and long-term floods and is very simple .
2.3.5. HEC-HMS Hydrological Calibration and Validation
Several efficiency metrics were used to calibrate and validate HEC-HMS hydrological models, including Nash-Sutcliffe efficiency, root mean square error, and coefficient of determination. The most common techniques for evaluating simulation performance are goodness of fit measures like Nash-Sutcliffe efficiency and percentage bias .
NSE=1-i=1nQsim,i-Qobs,i2i=1nQobs,i-Qobs,i̅2 (2)
R2=[i=1n(Qobs,i-Qobs̅)(Qsim,i-Qsim̅)]2i=1n(Qobs,i-Qobs̅)2i=1n(Qsim,i-Qsim̅)2 (3)
Where NSE is the Nash Sutcliffe efficiency, Qsm,iis the simulated flow,Qobs,iis the observed flow, Qobs,i̅ is the average of the observed, Qsim,i̅ is the average of the simulated flow, and n represents the length of the series, and R2 represents the coefficient of determination.
2.3.6. Standard Precipitation Index (SPI)
The Standard Precipitation Index (SPI) is a widely used meteorological index for quantifying precipitation deficits or surpluses over various periods, which aids in the assessment of drought and wet situations. According to , it was designed to determine how far precipitation deviates from the norm for a given location and period.
Table 1. The meteorological drought is characterized by SPI values.

Meteorological drought is characterized by SPI values

No

Criteria

Description

1

≥ 2.0

Extremely wet

2

1.5 to 1.99

Very wet

3

1.0 to 1.49

Moderately wet

4

-0.99 to 0.99

Near normal

5

-1.0 to -1.49

Moderately dry

6

-1.5 to -1.99

Severely dry

7

≤ -2.0

Extremely dry

2.3.7. Streamflow Drought Index (SDI)
The streamflow drought index clearly explains the repercussions of climatic anomalies for current hydrological circumstances, as opposed to climate-based indices that describe climate anomalies in isolation from their hydrological context . The Streamflow Drought Index (SDI) is a hydrological index that measures and monitors drought conditions in terms of streamflow. In addition, it is useful for determining water availability in rivers and streams during a certain period.
Table 2. Definition of states of hydrological drought classification based on SDI .

No

Description

Criterion

Probability (%)

0

Non-drought

0 < SDI

51.6

1

Mild drought

-1 < SDI < 0

25

2

Moderate drought

-0.5 < SDI < -1

12.5

3

Severe drought

-2 < SDI <0.5

10.9

4

Extreme drought

SDI < -2

0

3. Results and Discussions
3.1. Climate Models Performance Evaluation
The scatter plots of four GCM CMIP6 climate models against observed historical precipitation data sets over the study area are shown in Figure 2. The data sets below the line y=x (red line) indicate an overestimation of observed daily data by the climate models. Whereas, data sets falling below the line indicate under-estimation. For instance, a significant overestimation of precipitation, up to 80 mm, is shown by GFDL-ESM4 and FGOALS-g3. In contrast, MPI-ESM1-2-HR and INM-CM4-8 are closely related to observed rainfall. For this study, we selected two climate models and performed further climate analysis; we used the ensemble mean of the climate models.
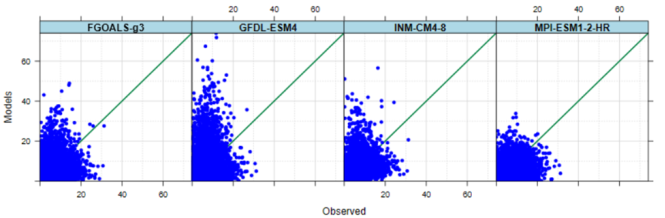
Figure 2. The scatter plot of four CMIP6 Climate Models' Performance Evaluation for Precipitation over the Basin.
3.2. Bias Correction Output
(Figure 3) depicts the Cumulative Distribution Function (CDF) plots of rainfall for each month at a specific location (Lat: 7.75, Lon: 35.37) using the MPI-ESM1-2-HR climate model. Each plot compares three datasets: actual rainfall (blue dots), model projections before adjustment (red line), and model predictions after correction (green line). Before Correction (red): The model overestimates rainfall compared to observed data, particularly in months 1, 2, 3, 9, and 12, where the red line consistently sits to the right of the blue dots. After correction (green), the corrected model predictions are significantly closer to the observed data across all months, indicating a notable increase in accuracy. Monthly Variation: Rainfall distribution changes from month to month. For example, months 4, 5, and 8 exhibit higher rainfall values (up to 100 mm), while months 6 and 11 show lower rainfall (mostly below 40 mm).
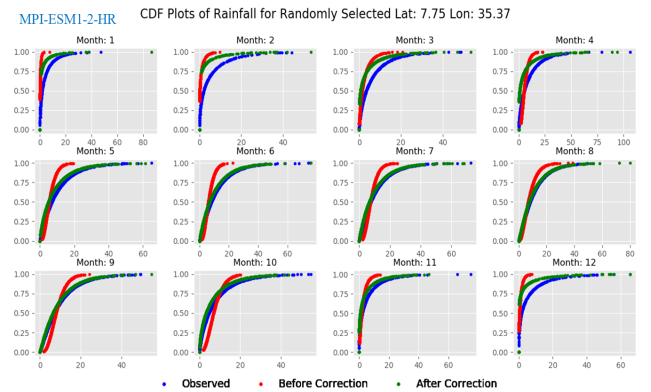
Figure 3. The bias correction of the MPI-ESM1-2-HR CMIP6 climate model.
Figure 4 illustrates the Cumulative Distribution Function (CDF) plots of rainfall data for a given location (Lat: 7.75, Lon: 35.37) during 12 months, comparing observed data to model outputs before and after bias adjustment. The model employed appears to be INM-CM4-8, most likely a climate model from the Coupled Model Inter-comparison Project (CMIP) architecture. Bias before correction: Most months (for example, months 1, 2, 3, 5, 9, and 10) show a considerable difference between the red line and the blue dots. For example, in month 1, the model overestimates rainfall at lower values (the red line is to the right of the blue dots for lower rainfall quantities) while underestimating rainfall at higher values. In month 4, the model significantly underestimates rainfall across the distribution. This suggests a consistent bias in the model's rainfall distribution, which might over- or under-predict rainfall depending on the month and intensity. Bias after Correction: In most months, the green line (after correction) closely follows the blue dots, indicating that the bias correction method was successful in aligning the model's rainfall distribution with the observed data. For example, in month 4, the green line shifts significantly to the right, matching the observed data and correcting the model's underestimation. In months 7 and 8, the correction reduces the model's overestimation of higher rainfall values, bringing the green line closer to the observed distribution.
3.3. HEC-HMS Model Calibration and Validation Results
We selected specific parameters to calibrate and validate the HEC-HMS model. These parameters include routing parameters (Muskingum K & X), transform parameters (storage coefficient & time of concentration), base flow (recession), and loss parameters (initial deficit, maximum deficit, and constant deficit). We calibrated the model using observed Streamflow data from 1991 to 2000. Then we validated the model using Streamflow data from 2001 to 2005 from the same station, the Baro gauge near Gambela. The calibration and validation results of the model, comparing simulated and observed flows, are illustrated in Figure 5.
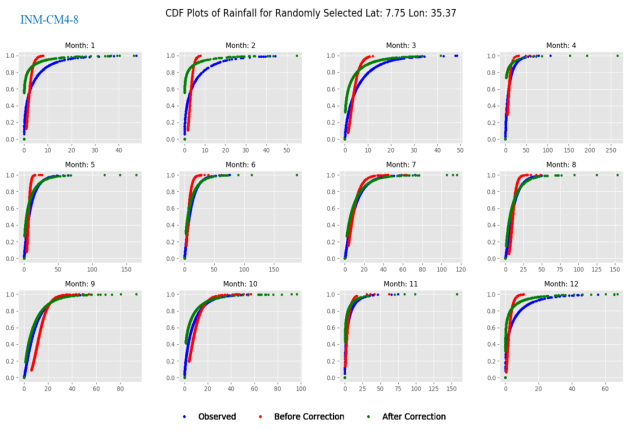
Figure 4. The bias correction of the INM-CM4-8 CMIP6 climate model.
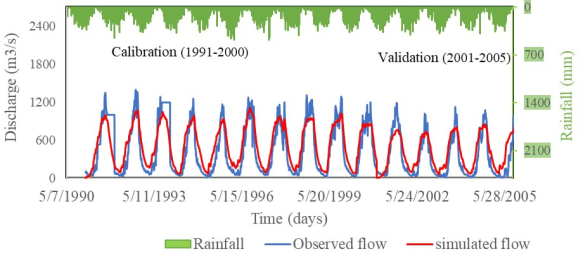
Figure 5. HEC-HMS Model calibration and validation output.
3.4. Performance of the HEC-HMS Model
We present the performance of the HEC-HMS model during calibration and validation in Table 2. The values of each performance evaluation metric lie where the model output is in very good agreement with observed Streamflow. The performance could even be improved if more of the Streamflow data is employed.
Table 2. HEC-HMS Model performance evaluations for calibration and validation.

Calibration

Validation

Objective function

Value

Performance

Value

Performance

NSE

0.78

Very good

0.72

Very good

RMSE

0.5

Very good

0.5

Very good

Bias

14.05%

Very good

22.87%

Good

3.5. Future Projection SPI Index Under Upper Baro Watershed
3.5.1. Observed Standard Precipitation Index (1991-2020)
From 1991 to roughly 2000, the SPI fluctuated between positive and negative readings, reflecting alternating rainy and dry seasons. There are multiple peaks in both directions, with some wet periods, reaching SPI values of 2.5, and dry spells dropping to approximately -2.5. From 2000 to 2010, the pattern remained similar; however, there appeared to be more frequent dry periods (red bars) than in the previous decade. From 2010 to 2020, the graph shows a clear tendency toward increasingly extreme dry conditions, particularly near the end of the timeframe. From 2018 to 2020, a large cluster of red bars, with SPI values as low as -5.0, signifying extreme drought conditions. Wet periods (blue bars) become less common and intense in the latter half of the graph, with fewer SPI values surpassing 2.0 after 2010.
3.5.2. Comprehensive Analysis of SPI and SDI at Mid-century (2040-2100) Under SSP2-4.5 Emission Scenarios
In the mid-century (2041-2070) under SSP2-4.5 emission scenarios, an analysis of three months (3-month SPI and SDI) over the study area reveals that the years 2043 and 2059 will experience moderate dryness. In contrast, the years 2047, 2048, 2051, 2060, 2064, and 2066 will be significantly wetter and will exhibit near-normal wet conditions. Additionally, during the mid-century (2071-210) under SSP2-4.5 emission scenarios, an analysis of SPI and SDI over three months (3 months) for the upper Baro watershed indicates that the years 2073 and 2089 will be severely dry. Refer to the detailed explanation (Figure 6).
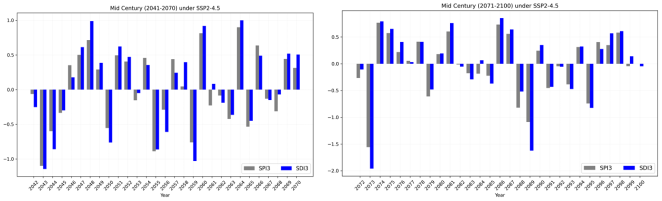
Figure 6. Association of three-month SDI and SPI in mid-century (2041-2100) under SSP2-4.5 scenarios.
In the mid-century (2041-2070) under SSP2-4.5 emission scenarios, the analysis of six months (6-month SPI and SDI) over the upper Baro watershed. The findings show that the years 2043, 2044, and 2059 will be moderately dry. Whereas in the years 2048 and 2064, moderately wet conditions are expected. The comprehensive assessment of the drought propagation in the mid-century (2071-210) under SSP2-4.5 emission scenarios, for six months of SPI and SDI indices over the upper Baro watershed. The findings show that in the year 2073 will occur extreme drought will occur, but in the year 2089 will occur severe drought will occur over the basin. Whereas in the years 2074, 2075, 2081, 2086, 2087, and 2097, mildly wet conditions will occur. Refer to the detailed explanation (Figure 7).
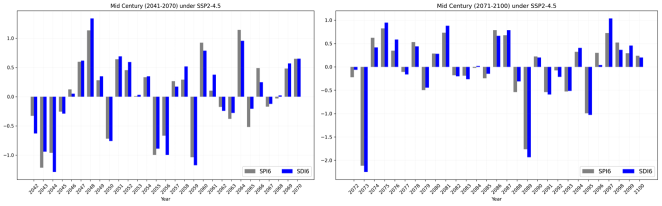
Figure 7. In mid-century (2041-2100) scenarios, the association between six-month SDI and SPI under SSP2-4.5.
In the mid-century (2041-2070) under SSP2-4.5 emission scenarios, an analysis spanning nine months (9-month SPI and SDI) was conducted over the upper Baro watershed. The findings indicate that moderately dry conditions were observed in the years 2044, 2056, and 2059, while the year 2048 experienced moderately wet conditions. Additionally, the relationship between SDI and SPI under SSP2-4.5 emission scenarios for the nine months was assessed over the Baro watershed. The results reveal that extreme drought is expected to occur in the study area in the years 2073 and 2089. Conversely, the years 2075, 2081, and 2087 are projected to experience moderately wet conditions. Refer to the detailed explanation (Figure 8).
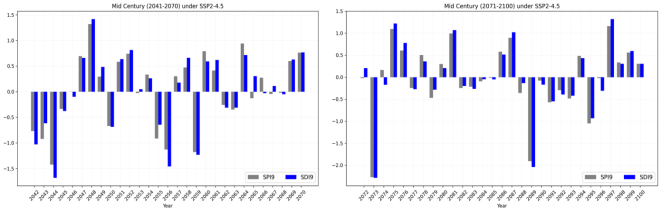
Figure 8. In mid-century (2041-2100) scenarios, the association between nine months SDI and SPI under SSP2-4.5.
In the mid-century (2041-2070) under SSP2-4.5 emission scenarios, the annual analysis of SPI and SDI (12 months) over the upper Baro watershed. The findings show that in the years 2044 and 2056 will occur severely dry. Whereas in the year 2048, moderately wet conditions. In addition, the linkage of SDI and SPI in mid-century (2071-2100) under SSP2-4.5 emission scenarios for twelve months evaluated over the Baro watershed. The findings show that in the years 2073 and 2089 will occur extremely drought will occur over the study area. Whereas in the years in the years 2075, 2081, 2087, and 2097, moderately wet conditions will occur. Refer to the detailed explanation (Figure 9).
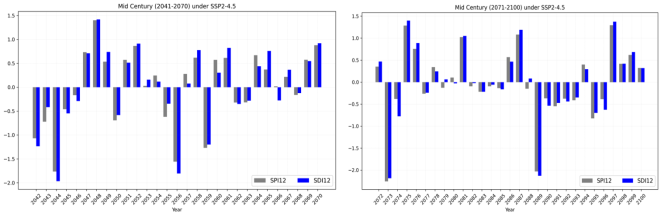
Figure 9. In mid-century (2041-2100) scenarios, the association between twelve-month SDI and SPI under SSP2-4
3.5.3. Examination of SPI and SDI at the End of the Century (2040-2100) Under SSP5-8.5 Emission Scenarios
In the upper Baro watershed, the major drought spells (negative values) are closely aligned for both indices, particularly around 2044-2045, 2048, 2052, and 2065-2066. During these times, low precipitation (negative SPI3) corresponds to lower streamflow (negative SDI), demonstrating how shortfalls in precipitation directly influences flow. High precipitation (positive SPI3) coincides with high streamflow (positive SDI), as seen in 2047, 2050, 2057, and 2069-2070. This suggests that increased rainfall leads to higher streamflow, as expected. Refer to the detailed explanation (Figure 10).
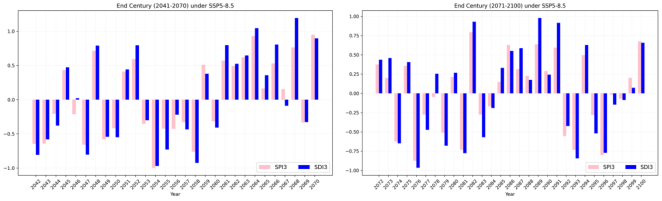
Figure 10. In End-century (2041-2100) scenarios, the association between twelve-month SDI and SPI under SSP5-8.5.
In the (Figure 11) below in mid-century (2040-2100) the association of SPI6 and SDI6 demonstrate a strong positive relationship, as they generally rise and fall together. Drought years (e.g., 2042, 2054, 2055, and 2058) indicate that moderately dry weather conditions will occur, while wet years (e.g., 2047, 2050, 2063, and 2069) reflect both rising above zero.
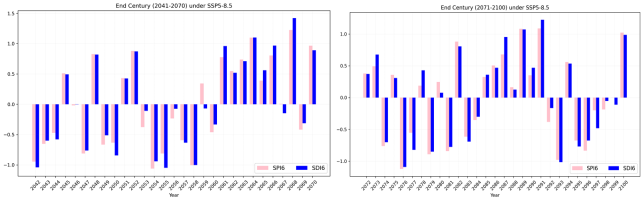
Figure 11. The relationship between six-month SDI and SPI under SSP5-8.5 in End-of-Century (2041-2100) scenarios.
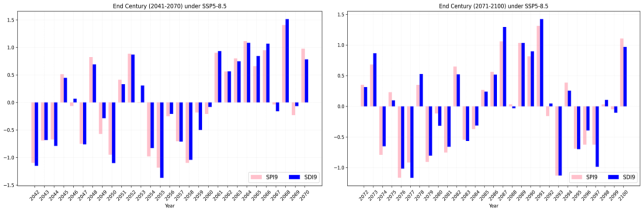
Figure 12. The relationship between nine-month SDI and SPI under SSP5-8.5 in End-of-Century (2041-2100) scenarios.
In Figure 13, a comprehensive assessment of twelve months of the SDI and SPI by the end of the century (2041-2070) under the SSP5-8.5 emission scenarios is presented. The findings indicate that moderate drought is expected in the basin during the years 2042, 2044, 2050, 2055, and 2058. Meanwhile, mildly wet conditions are anticipated in the years 2048, 2052, 2053, and from 2061 to 2066, with moderately wet conditions occurring in 2068. Additionally, severe drought is predicted for 2055, while moderate drought is also expected in 2042, 2050, and 2058 across the basin. Figure 13 shows the relationship between the 12-month SPI and SDI in the end-of-century SSP5-8.5 emission scenario. The results indicate that moderately dry conditions will appear in 2077, 2093, and 2097. In contrast, future emissions scenarios for 2073, 2087, 2089, 2090, and 2091 will experience moist conditions.
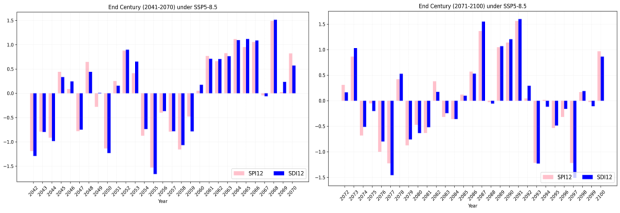
Figure 13. The relationship between twelve-month SDI and SPI under SSP5-8.5 in End-of-Century (2041-2100) scenarios.
4. Conclusion and Recommendation
The analysis reveals that the Upper Baro Watershed is experiencing a trend toward more frequent and severe meteorological droughts, driven by erratic precipitation patterns projected under various climate change scenarios (e.g., SSP2-4.5 and SSP5-8.5). This study analyzes the top four climate models, including MPI-ESM1-2-HR, FGOLAS-g3, GFDL-ESM4, and INM-CM4-8, which are assessed specifically for the Upper Baro Watershed. The findings indicate that the MPI-ESM1-2-HR and INM-CM4-8 models are the best-performing climate models in the study area. Under the future climate scenarios of SSP2-4.5 and SSP5-8.5, the comprehensive assessment included evaluations of both meteorological and hydrological droughts. The relationship between meteorological and hydrological droughts over the upper watershed was evaluated using the SPI and SDI indicators over 30 years across the basin, with overlapping periods of 3, 6, 9, and 12 months identified. The findings show that in mid-century (2041-2071), under the SSP2-4.5 and SSP5-8.5 emission scenarios, moderately wet to severely dry conditions will occur. Additionally, by the end of the century (2071-2100), under the SSP2-4.5 and SSP5-8.5 emission scenarios, moderately dry to severe drought conditions will emerge over the upper Baro watershed. According to the data, the basin experienced several moderate to severe droughts during the research period. This study confirms previous findings that under the SSP2-4.5 and SSP5-8.5 emission scenarios, regions may experience both moderately rainy and very dry conditions in the middle of the century (2041-2071) . The findings suggest that both the SPI and SDI indices can effectively detect major droughts in the upper Baro watershed over the last 30 years. The study suggests enhancing the Upper Baro watershed's resilience to expected shifts toward drier conditions in order to provide sustainable water usage, food security, and ecosystem health.
Abbreviations

EMI

Ethiopia Meteorological Institute

CMIP6

Coupled Model Inter-comparison Project Path Six

SPI

Standardized Precipitation Index

SDI

Standardized Stream Flow Index

GCM

Global Climate Model

SSPs

Shared Socio-economic Pathways

Author Contributions
The authors write the manuscript. Additionally, author reviewed, modified, and approved it. The author collected and analyzed the data, wrote the first text, and helped with the study's conceptualization and design. provided technical assistance, ideas for enhancements, and creative direction. The manuscript was prepared by the writers. The author also examined, edited, and approved it.
Funding
The authors did not receive support from any organization for the submitted work.
Data Availability Statement
The datasets generated during and/or analyzed during the current study are available from the corresponding author upon reasonable request.
Conflicts of Interest
The authors declare no conflicts interest.
References
[1] Basin, N. (2013). Earth Science & Climatic Change An Assessment of Temperature and Precipitation Change Projections using a Regional and a Global Climate Model for the Baro-Akobo Basin,. January.
[2] Bogale, G. A., & Erena, Z. B. (2022). Drought vulnerability and impacts of climate change on livestock production and productivity in different agro-Ecological zones of Ethiopia. Journal of Applied Animal Research, 50(1), 471-489.
[3] Chen, L. (2025). Supplementary Materials for Global increase in the occurrence and impact of multiyear droughts. JANUARY.
[4] CRED, 2016). (2007). Annual disaster statistical review. The numbers and trends. Proceedings of the Annual Hawaii International Conference on System Sciences, 2002-Janua, 1060-1069.
[5] Dinku, T., Faniriantsoa, R., Cousin, R., Khomyakov, I., Vadillo, A., Hansen, J. W., & Grossi, A. (2022). ENACTS: Advancing Climate Services Across Africa. Frontiers in Climate, 3(January), 1-16.
[6] Eyring, V., Bony, S., Meehl, G. A., Senior, C. A., Stevens, B., Stouffer, R. J., & Taylor, K. E. (2016). Overview of the Coupled Model Intercomparison Project Phase 6 (CMIP6) experimental design and organization. Geoscientific Model Development, 9(5), 1937-1958.
[7] Gao, Y., Taie Semiromi, M., & Merz, C. (2023). Efficacy of statistical algorithms in imputing missing data of streamflow discharge imparted with variegated variances and seasonalities. Environmental Earth Sciences, 82(20), 1-25.
[8] Gebisa, B. T., Dibaba, W. T., & Kabeta, A. (2023). Evaluation of historical CMIP6 model simulations and future climate change projections in the Baro River Basin. Journal of Water and Climate Change, 14(8), 2680-2705.
[9] Giri, S., Mishra, A., Zhang, Z., Lathrop, R. G., & Alnahit, A. O. (2021). Meteorological and hydrological drought analysis and its impact on water quality and stream integrity. Sustainability (Switzerland), 13(15), 1-24.
[10] Guduru, J. U., & Mohammed, A. S. (2024). Hydrological modeling using HEC-HMS model, case of Tikur Wuha River Basin, Rift Valley River Basin, Ethiopia. Environmental Challenges, 17(September), 101017.
[11] Kenea, T. T., & Tafesse, K. E. (2025). Evaluating climate extremes and their association with oods in the Baro Akobo River basin using CMIP6 and Hydrological Modelling.
[12] Mckee, T. B., Doesken, N. J., & Kleist, J. (1993). The relationship of drought frequency and duration to time scales. January, 17-22.
[13] Mohammed, Y., Yimer, F., Tadesse, M., & Tesfaye, K. (2018). Meteorological drought assessment in north east highlands of Ethiopia. International Journal of Climate Change Strategies and Management, 10(1), 142-160.
[14] Nalbantis, I., & Tsakiris, G. (2009). Assessment of hydrological drought revisited. Water Resources Management, 23(5), 881-897.
[15] Orimoloye, I. R., Belle, J. A., Orimoloye, Y. M., Olusola, A. O., & Ololade, O. O. (2022). Drought: A Common Environmental Disaster. Atmosphere, 13(1).
[16] Rafiei, V., Ghahramani, A., An-Vo, D. A., & Mushtaq, S. (2020). Modelling hydrological processes and identifying soil erosion sources in a tropical catchment of the great barrier reef using SWAT. Water (Switzerland), 12(8).
[17] Ribeiro, S., Caineta, J., & Costa, A. C. (2016). Review and discussion of homogenisation methods for climate data. Physics and Chemistry of the Earth, 94, 167-179.
[18] Shukla, S., & Wood, A. W. (2008). Use of a standardized runoff index for characterizing hydrologic drought. Geophysical Research Letters, 35(2), 1-7.
[19] Şimşek, S. D., Çapar, Ö. F., & Turhan, E. (2023). Assessment of Hydrological Drought Index change over long period (1990-2020): The case of İskenderun Gönençay Stream, Türkiye. AIMS Geosciences, 9(3), 441-454.
[20] Sok, K., & Oeurng, C. (2016). Application of HEC-HMS model to assess streamflow and water resources availability in Stung Sangker catchment of Mekong’ Tonle Sap Lake Basin in Cambodia. Preprints, 2016(September), 1-16.
[21] Tareke, K. A., & Awoke, A. G. (2022). Hydrological Drought Analysis using Streamflow Drought Index (SDI) in Ethiopia. Advances in Meteorology, 2022.
[22] USACE. (2013). HEC-HMS 4.0: Hydrologic Engineering Center - Hydrologic Modeling System. United States Army Corps of Engineers, 2. www.hec.usace.army.mil.
[23] WMO. (2017). Guidelines on the Calculation of Climate Normals. WMO-No. 1203, 1203, 29.
[24] Jarraud, M., & Steiner, A. (2012). Summary for policymakers. In Managing the Risks of Extreme Events and Disasters to Advance Climate Change Adaptation: Special Report of the Intergovernmental Panel on Climate Change (Vol. 9781107025066).
Cite This Article
  • APA Style

    Wondimu, S. A. (2025). A Comprehensive Assessment of Meteorological and Hydrological Drought Under Climate Change over the Upper Baro Watershed. Earth Sciences, 14(4), 129-141. https://doi.org/10.11648/j.earth.20251404.11

    Copy | Download

    ACS Style

    Wondimu, S. A. A Comprehensive Assessment of Meteorological and Hydrological Drought Under Climate Change over the Upper Baro Watershed. Earth Sci. 2025, 14(4), 129-141. doi: 10.11648/j.earth.20251404.11

    Copy | Download

    AMA Style

    Wondimu SA. A Comprehensive Assessment of Meteorological and Hydrological Drought Under Climate Change over the Upper Baro Watershed. Earth Sci. 2025;14(4):129-141. doi: 10.11648/j.earth.20251404.11

    Copy | Download

  • @article{10.11648/j.earth.20251404.11,
      author = {Sintayehu Abera Wondimu},
      title = {A Comprehensive Assessment of Meteorological and Hydrological Drought Under Climate Change over the Upper Baro Watershed },
      journal = {Earth Sciences},
      volume = {14},
      number = {4},
      pages = {129-141},
      doi = {10.11648/j.earth.20251404.11},
      url = {https://doi.org/10.11648/j.earth.20251404.11},
      eprint = {https://article.sciencepublishinggroup.com/pdf/10.11648.j.earth.20251404.11},
      abstract = {Drought is a complex natural hazard resulting from meteorological and hydrological phenomena. Meteorological drought, defined by precipitation shortfalls, frequently precedes hydrological drought, decreasing surface and groundwater availability. The Upper Baro Watershed, an important agricultural and hydrological hub in Ethiopia, is becoming more vulnerable to climate change-induced droughts. This article investigates the comprehensive assessment of the meteorological and hydrological drought, focusing on their roles in the hydrological cycle, the transition from meteorological to hydrological drought, and the consequences for water resources management. The Standardized Precipitation Index (SPI) and the Stream Drought Index (SDI) are used to perform a thorough evaluation of the hydrological and meteorological drought characteristics of historical and projected future drought in the upper Baro watershed. Historical model data from 1985 to 2014, along with estimates under the SSP2-4.5 and SSP5-8.5 emission scenarios for the middle of the century (2041-2070) and end of the century (2071-2000). The association between the SPI and SDI indices was studied over 30 years across the basin. Overlapping periods of 3, 6, 9, and 12 months were discovered. This study analyzes the top four climate models, including MPI-ESM1-2-HR, FGOLAS-g3, GFDL-ESM4, and INM-CM4-8. These models are assessed based on the upper Baro watershed. The findings reveal that in the study area, the MPI-ESM1-2-HR and INM-CM4-8 models are the best-performing climate models for the upper Baro watershed under the future climate scenarios SSP2-4.5 and SSP5-8. The comprehensive assessment of the meteorological and hydrological drought under SSP2-4.5 and SSP5-8.5 climate scenarios. The findings show that in mid-century (2041-2071), under the SSP2-4.5 and SSP5-8.5 emission scenarios, moderately wet to severely dry conditions will occur. Additionally, by the end of the century (2071-2100), under the SSP2-4.5 and SSP5-8.5 emission scenarios, moderately dry to severe drought conditions will emerge over the upper Baro watershed. The findings suggest that both the SPI and SDI indices are capable of catching major droughts in the upper Baro watershed over the last 30 years. The study recommended that understanding this link is crucial for successful drought monitoring, forecasting, and mitigation efforts.},
     year = {2025}
    }
    

    Copy | Download

  • TY  - JOUR
    T1  - A Comprehensive Assessment of Meteorological and Hydrological Drought Under Climate Change over the Upper Baro Watershed 
    AU  - Sintayehu Abera Wondimu
    Y1  - 2025/07/14
    PY  - 2025
    N1  - https://doi.org/10.11648/j.earth.20251404.11
    DO  - 10.11648/j.earth.20251404.11
    T2  - Earth Sciences
    JF  - Earth Sciences
    JO  - Earth Sciences
    SP  - 129
    EP  - 141
    PB  - Science Publishing Group
    SN  - 2328-5982
    UR  - https://doi.org/10.11648/j.earth.20251404.11
    AB  - Drought is a complex natural hazard resulting from meteorological and hydrological phenomena. Meteorological drought, defined by precipitation shortfalls, frequently precedes hydrological drought, decreasing surface and groundwater availability. The Upper Baro Watershed, an important agricultural and hydrological hub in Ethiopia, is becoming more vulnerable to climate change-induced droughts. This article investigates the comprehensive assessment of the meteorological and hydrological drought, focusing on their roles in the hydrological cycle, the transition from meteorological to hydrological drought, and the consequences for water resources management. The Standardized Precipitation Index (SPI) and the Stream Drought Index (SDI) are used to perform a thorough evaluation of the hydrological and meteorological drought characteristics of historical and projected future drought in the upper Baro watershed. Historical model data from 1985 to 2014, along with estimates under the SSP2-4.5 and SSP5-8.5 emission scenarios for the middle of the century (2041-2070) and end of the century (2071-2000). The association between the SPI and SDI indices was studied over 30 years across the basin. Overlapping periods of 3, 6, 9, and 12 months were discovered. This study analyzes the top four climate models, including MPI-ESM1-2-HR, FGOLAS-g3, GFDL-ESM4, and INM-CM4-8. These models are assessed based on the upper Baro watershed. The findings reveal that in the study area, the MPI-ESM1-2-HR and INM-CM4-8 models are the best-performing climate models for the upper Baro watershed under the future climate scenarios SSP2-4.5 and SSP5-8. The comprehensive assessment of the meteorological and hydrological drought under SSP2-4.5 and SSP5-8.5 climate scenarios. The findings show that in mid-century (2041-2071), under the SSP2-4.5 and SSP5-8.5 emission scenarios, moderately wet to severely dry conditions will occur. Additionally, by the end of the century (2071-2100), under the SSP2-4.5 and SSP5-8.5 emission scenarios, moderately dry to severe drought conditions will emerge over the upper Baro watershed. The findings suggest that both the SPI and SDI indices are capable of catching major droughts in the upper Baro watershed over the last 30 years. The study recommended that understanding this link is crucial for successful drought monitoring, forecasting, and mitigation efforts.
    VL  - 14
    IS  - 4
    ER  - 

    Copy | Download

Author Information