This study, carried out in the heart of one of the world's most important wetlands, focuses on the modelling of certain physico-chemical parameters of the Bikoro peat bogs in the Congo Basin in the north-west of the Democratic Republic of Congo. To this end, we have characterized the above-mentioned parameters using digital modeling based on satellite and in situ data from five villages that make up the three sectors of this territory. Some of the equipment used includes three GPS (Garminextrex 30), Cybertacker v3.435 on Android, cameras (Samsung Wifi 12x + GPS), passive sensors (Radar). We also used an infrared spectrophotometer. The main results in relation to the 240 samples taken show that the pH of the peat bogs in the Bikoro territory varies between (2.600±0.001) and (5.000±0.004), the electrical conductivity measured varies between [85.48±3.17] μS/cm and [97.99±5. 47] μS/cm, the experimental carbon rate reported in tonnes per hectare is 135.3021, the forest carbon stock derived from WWF LiDar is 137.1484 and the spatial distribution of the temperature of these peatlands indicates that it ranges between (22.39±1.05)°C and (24.79±1.95)°C. The results of this study show that the peat bogs in the Bikoro area are wetlands that are both significantly acidic and carbon sinks.
| Published in | Engineering Science (Volume 9, Issue 3) |
| DOI | 10.11648/j.es.20240903.11 |
| Page(s) | 47-59 |
| Creative Commons |
This is an Open Access article, distributed under the terms of the Creative Commons Attribution 4.0 International License (http://creativecommons.org/licenses/by/4.0/), which permits unrestricted use, distribution and reproduction in any medium or format, provided the original work is properly cited. |
| Copyright |
Copyright © The Author(s), 2024. Published by Science Publishing Group |
Peatland, Experimental Carbon Rate, Carbon Stock, Peatland Ph, Conductivity, Electric
Territory / Locality | Altitude | Latitude - S | Longitude - E |
|---|---|---|---|
Bikoro | 450 m | 00° 43'40 '' | 18° 07'58'' |
Lokolama | 314 m | 00° 17'59.1 '' | 018° 012'16.6'' |
Molungu | 311 m | 00° 59' 12.4'' | 018° 012' 22'' |
Mpangi | 329 m | 00° 57' 00.7 '' | 018° 22' 54.0'' |
Molumbu | 313 m | 01° 09'45.7 '' | 017° 50'10.3'' |
Malwalumba | 318 m | 1° 11'09.8 '' | 017° 51'07.1'' |
Setting physicochemical | N | Minimum | Maximum | Mean | Std. DETOUR |
|---|---|---|---|---|---|
In Situ Depth Peat in meters | 240 | 0.00 | 3.00 | 2.3846 | 0.37935 |
In situ Mass Peat wet (gram) | 240 | 1062.00 | 10655.0000 | 1289.901667 | 1337.9956270 |
Mass of water extracted from peat (gram) | 240 | 122.90 | 9730.50 | 358.8135 | 1337.70329 |
In Situ peat mass dry (gram) | 240 | 891.00 | 958.0000 | 931.088167 | 11.1174826 |
In Situ Temperature Peat in °C | 240 | 22.40 | 25.60 | 23.7981 | 0.90208 |
In Situ Air Temperature in °C | 240 | 24.50000 | 30.00000 | 26.8158333 | 1.7487874 |
In Situ pH Peat | 240 | 2.60000 | 5.00000 | 3.7883333 | 0.72481806 |
In Situ Clarity – Energie Lux | 240 | 404.0000 | 781.0000 | 511.772500 | 92.2733527 |
In Situ Relative Air Humidity % | 240 | 60.2000 | 79.0000 | 71.546667 | 3.7737019 |
In Situ conductivity Electrical (g/µSec/cm) | 240 | 78.9000 | 885.1600 | 101.819667 | 73.1688237 |
In Situ Density Peat dry (g/cm3) | 240 | 0.84 | 1.04 | 0.9379 | 0.06306 |
In Situ Density Peat Hum (g/cm3) | 240 | 1.05 | 11.21 | 1.1701 | 0.84928 |
In Situ Density Peat dried | 240 | 0.0008880000 | 0.0010000000 | 0.0009755583 | 0.0000449479095 |
In Situ Density Peat Humid | 240 | 0.001000000 | 0.00110000 | 0.0010889000 | 0.00002378157228 |
In Situ rate C experimental Peat in t/ha | 240 | 18.54 | 61.25 | 45.1007 | 10.05241 |
WWF LiDAR Forest Carbon stock in t/ha | 240 | 4.89 | 155.64 | 137.1484 | 21.34300 |
Carbon rate exp Reported in t/ha to the Territory | 240 | 55.62 | 183.75 | 135.3021 | 30.15723 |
Satellite ppm daily t H 2 O/ha | 240 | 0.09257 | 9.26686 | 3.1387612 | 2.62299303 |
NDVI Biomass Satellite | 240 | 78.020000 | 83.650000 | 81.08625000 | 2.025318018 |
Satellite Tmoy Air in °C | 240 | 25.460000 | 30.010000 | 28.46542083 | 1.042460199 |
groundwater reserve in tH2O | 240 | 503.6710 | 558.2070 | 519.730358 | 13.2150564 |
Valid N (listwise) | 240 |
Model | Unstandardiz Coefficients | Standardized Coefficients | Sig | ||
|---|---|---|---|---|---|
B | Std Error | Beta | |||
1 | (Constant) | 1831.386 | 3478.971 | 0.050 | |
In Situ Temperature Peat in °C | -20.158 | 128,149 | -0.014 | 0.048 | |
In Situ pH Peat | -16.301 | 159,489 | -0.009 | 0.042 | |
2 | (Constant) | 1564.097 | 2289.604 | 0.50 | |
In Situ Peat Temperature in °C | -11.22 | 96.141 | -0.008 | 0.049 | |
Model | Unstandardiz Coefficients | Standardized Coefficient | Sig | ||
|---|---|---|---|---|---|
B | Std Error | Beta | |||
1 | (Constant) | 182,576 | 190,649 | 0.034 | |
Groundwater Reserve in tH 2 O/ha | -0.168 | 0.368 | -0.030 | 0.065 | |
InSitu Density peat Wet (g/cm3) | -1.192 | 5,590 | -0.014 | 0.083 | |
Satellite PPmm daily tH 2 O/ha | 2,512 | 1,854 | 0.090 | 0.018 | |
Statistics | Bootstrap has | ||||
|---|---|---|---|---|---|
Std. Error | 95% Confidence Interval | ||||
LEED UNIVERSITY WWWF LIDAR Forest Carbon stock in ton /ha | N | 240 | 0 | 240 | 240 |
Minimum | 4.89 | ||||
Maximum | 155.64 | ||||
Mean | 137.1484 | 1.3353 | 134.3399 | 139.6237 | |
Std. DETOUR | 21.34300 | 2.51858 | 16.11291 | 25.85478 | |
Experimental Carbon Rate Reported in ton /ha in the BIKORO Territory | N | 240 | 0 | 240 | 240 |
Minimum | 55.62 | ||||
Maximum | 183.75 | ||||
Mean | 135.3021 | 1.9124 | 131.4503 | 138.9079 | |
Std. DETOUR | 30.15723 | 1.58807 | 26.96900 | 33.18256 | |
Valid N (listwise) | N | 240 | 0 | 240 | 240 |
Model | Unstandardiz Coefficients | Standardized Coefficients | Sig | ||
|---|---|---|---|---|---|
B | Std Error | Beta | |||
1 | (Constant) | -8.394 | 1,915 | 0.000 | |
In Situ Temperature Peat in °C | 1,480 | 0.080 | -766 | 0.000 | |
2 | (Constant) | -6.020 | 2.136 | 0.005 | |
In Situ Peat Temperature in °C | 1.328 | 0.101 | 0.688 | 0.000 | |
In situ clarity Energy Lux | 0.002 | 0.001 | -127 | -0.017 | |
Model | Unstandardiz Coefficients | Standardized Coefficients | Sig | ||
|---|---|---|---|---|---|
B | Std Error | Beta | |||
1 | (Constant) | -9.364 | 4,552 | 0.041 | |
In Situ Temperature Peat 0 Celsius | 1.030 | 0.286 | 0.354 | 0.000 | |
In Situ Temperature Air 0 Celsius | -0.448 | 0.148 | -0.297 | 0.003 | |
IDW | Intellectual Dark Web |
LIDAR | Light Detection And Ranging |
NDVI | Normalized Difference Vegetation Index |
OSFAC | Acronym of Spatial Observatory of Central African Forests (in French) |
OSRNaC | Acronym of Spatial Observatory of Natural Resources and Climate (in French) |
pH | Potential Hydrogen |
PVC | Poly-Chlorure of Vinyl |
| [1] | Thornton, S. A., Cook, S., Astiani, D., Hapsari, K. A., Varkkey, H., Cole, L. E. S., Dargie, G. C., Sjogersten, S., Zawawi, N. A., Page, S. E. "Pushing the limits": experiences of women in tropical peatland research. Marine and Freshwater Research 71 (2019), 170-178. |
| [2] | Loisel, J., Gallego-Sala, A. V., Amesbury, M. J., Magnan, G., Anshari,., Beilman, D. W., Benavides, J. C., Blewett, J., Camill, P., Charman, D. J., Chawchai, S., Hedgpeth, A., Kleinen, A Korhola, D. Large, CA Mansilla, J. Müller, S. Van Bellen, T., West, J. B., Yu, Z., Bubier, J. L., Garneau, M., Moore, T., Sannel, A. B. K., Page, S., Väliranta, M., Bechtold, M., Brovkin, V., Cole, L. E. S., Chanton, J. P., Christensen, T. R., Davies, M. A., De Vleeschouwer, F., Finkelstein, S. A., Frolking, S., Galka, M., Gandois, L., Girkin, N., Harris, L. I., Heinemeyer, A., Hoyt, A. M., Jones, M. C., Joos, S. Juutinen, F., Kaiser, K., Lacourse, T., Lamentowicz, M., Larmola, T., Leifeld, J., Lohila, A., Milner, A. M., Minkkinen, K., Moss, P., Naafs, B. D. A., Nichols, J., O'donnell, J., Payne, T., Philben, M., Piilo, S., Quillet, A., Ratnayake, A. S., Roland, T. P., Sjögersten, S., Sonnentag, O., Swindles, G. T., Swinnen, W., Talbot, J., Treat, C., Valach, A. C. and Wu, J., Expert assessment of future vulnerability of the global peatland carbon sink. Nature Climate Change, 11 (2021) 70-77 p. |
| [3] | Datok, P. Sauvage S., Fabre C., Laraque, A., Ouillons, S., Moukandi N'kaya G. and Sanchez-Perez J-M (2021), Sediment Balance Estimation of the 'Cuvette Centrale' of the Congo River Basin Using the SWAT Hydrological Model, Water 13(10): 1388, May 2021, |
| [4] | Apers, S., De Lannoy, G., Baird, A. J., Cobb, A. R., Dargie G. C., Del Aguila, Pasquel, J., Gruber, A. Hastie, H., hidayat, H., Hirano, T., Hoyt, A. M., Jovani-Sancho, A. J, Katimon, A., Kurnaim, A., Kosterd., M., Lampela, M., Mahanama, S. P. P., Melling, L., Page, S. E., Reichle, R. H., Taufik, M., Vanderborghtt, J., and Bechtold, M. (2021). [Pre-print]. Tropical peatland hydrology simulated with a global land surface model. journal of advances in modeling earth systems. 14, e2021ms002784, |
| [5] | Leroy, F., Gogo, S., Guimbaud, C., Bernard-Jannin, L., Hu, Z. and Laggoun-defarge F., (2027). Vegetation composition controls sensitivity of CO2 and CH4 emissions and doc contraction in peatlands. soil biology and biochemistry, 107 (2017) 164–167. |
| [6] | Page, S., Mishra, S., Agus, F. et al. Anthropogenic impacts on lowland tropical peatland biogeochemistry. Nat Rev Earth Environ 3, 426–443 (2022). |
| [7] | Mishra, S., Page, S. E., Cobb, A. R., Ser Huay Lee, J., Jonay Jovani-Sancho, A., Sjögersten, S., Aswandi, A. J., Wardle, D. A. (2021), degradation of southeast asian tropical peatlands and integrated strategies for their better management and restoration, j appl ecol.: 58: 1370 – 1387. |
| [8] | Davenport, I. J., Mcnico L. I., Mitchard, E. T. A., Dargie, G. C., Ifo, S. A., Milongo, B., Bocko, Y. E., Hawthorne, D., lawson, I. T., Baird, S. E., Page A. J., Lewis S. L. (2020). First Evidence of Peat Domes in the Congo Basin using LiDAR from a Fixed -Wing Drone [First evidence of peat domes in the Congo Basin using a LiDAR sensor onboard a fixed-wing drone]. Remote Sensing. |
| [9] | Vetrita Y., Cochrane, M. A., Suwarsono, Priyatna, M., Sukowati, K. A. D. and Khomarudin M. R. (2021). Evaluating accuracy of four MODIS- derived burned area products for tropical peatland and non- peatland fires. Approximately. Res. Lett. 16 035015 |
| [10] | Lawson, I. T., Honorio coronado, E. N., Andueza, L., Cole, L., Dargie, G. C., Davies, A. L., Laurie, N., Okafor-yarwood, I., Roucoux, K. H. and Simpson, M. (2022). The vulnerability of tropical peatlands to oil and gas exploration and extraction. Progress in Environmental Geography, Vol, Issue 1-4. |
| [11] | Shakun, J. D., Clark P. U., Marcott S. A., Mix A. C., Zengyu, L.., Ottebliesner, B., Schmitter, A. and Bard, E. (2012). Global warming preceded by increasing carbon dioxide concentrations during the last deglaciation. Nature, 484 49–54. |
| [12] | Prather, M. J., Holmes, C. D. and Hsu, J., (2012) "Reactive greenhouse gas scenarios: Systematic exploration of uncertainties and the role of atmospheric chemistry", Geophysical Research Letters, vol. 39, No. 9 L09803, n/a–n/a. |
| [13] | Spracklen, D., Arnold, S., Taylor, C. (2012). Observations of increased tropical rainfall preceded by airpassage over forests. Nature, 489 282–285. |
| [14] | Rodriguez-Galiano, V. F., Ghimire, B., Rogan, J., Chica-Olmo, M. and Rigol-Sanchez, J. P., (2012), "An assessment of the effectiveness of a random forest classifier for land-cover classification". ISPRS J. Photogrammetry. Remote Sens. 67, 93–104. |
| [15] | White, L. J. T., Bazaiba Masudi, L. J. T., Ndongo, E., Doret J., Matondo, R.,. Soudan-Nonault, NGOMANDA, A., Ifo, SA., Ewango, C. E. N., Sonké, B., and Lewis, S. L., (2021). Congo Basin rainforest - invest US$150 million in science. Nature Comment, 598 (2411-414 p). |
| [16] | Garcin, Y. E., Schefuß, E., Dargie, G. C, Hawthorne, D., Lawson, I. T., Sebag, D., Biddulph, G. E., Crezee, B., Bocko, Y. E., Ifo, S. A., Mampouya Wenina, Y. E., Mbemba, M., Ewango, C. E. N., Bola P., Kanyama Tabu J., Tyrrell, G., Young, D. M., Gassier, G., Girkin, N. T., Vane, C. H. Adatte, T., Baird, A. J., Boom, A., Gulliver, P., Morris, P. J., Page, S. E., Sjögersten, S., Lewis, S. L, (2022). Hydroclimatic vulnerability of peat carbon in the central Congo Basin. Nature, 612 277–282. |
| [17] | Young, D. M., Baird, A. J., Gallego-sala, A. V., Loisel, J. (2021). Cautionary tale about using the apparent carbon accumulation rate (aCAR) obtained from peat cores. Sci Rep, 11 9547. |
| [18] | Hawthorne, D., Lawson, I. T., Dargie, G. C., Bocko, Y. E., Ifo, S. A., Garcin, Y., Schefuß, E., Hiles, W., Jovani-Sancho, A. J., Tyrell, G., Biddulph, G. E., Boom, A., Chase, B. M., Gul liver, P., Page, S. E., Roucoux, K. H., Sjögersten, S., Young, D. M., Lewis, S. L. (2023) Genesis and development of an interfluvial peatland in the central Congo Basin since the Late Pleistocene. Quaternary Science Reviews, 305 107992. |
| [19] | Pelletier, L., Strachan, I. B., Garneau, M., and Roulet N, (2014). Carbon release from boreal peatland open water pools: Implication for the contemporary C exchange. Journal of Geophysics Research: Biogeosciences, 119(3), 207–222. |
| [20] | Hansen, A. T., Dolph, C. L., Foufoula-georgiou, E., Fanaly J. C (2018). Contribution of wetlands to nitrate removal at the watershed scale. Nature Geoscience, 11(2), 127–132. |
| [21] |
Evans, C. D., Peacock, M., Baird, A. J., Artz, R. R. E., Burden, A., Callaghan, N., Chapman, P. J., Cooper, H. M., Coyle, M., Craig, E., Cumming, A., Dixon, S., Gauci, V., Grayson, R. P., Helfter, C., Heppell, C. M., Holden, Jones, D. L., Kaduk, J., Levy, P;, Matthews, R., Mcnamara, N. P., Misselbrook, T., Oakley, S., Page, S. E., Rayment, M., Ridley, L. M., Stanley, K. M., Williamson, J. L., Worrall, F., Morrison, R. (2021). Overriding water table control on managed peatland greenhouse gas emissions. Nature. 2021 May; 593(7860): 548-552.
https://doi.org/10.1038/s41586-021-03523-1 Epub 2021 Apr 21 |
| [22] | Pelletier, L., Strachan, I. B., Roulet, N. T., Garneau, M. (2015), Can boreal peatlands with pools be net sinks for CO2 Environmental Research Letters, 10(3), 035002. |
| [23] | Ngoma Buveka, C., Ilanga Onzeli, F., Samu Ki kwemani and EFOTO EALE, L., (2018). Some physicochemical parameters of honeys from four provinces of the Democratic Republic of Congo in relation to their quality and stability, Afrique SCIENCE 14(5) 415–424. |
| [24] | Ngoma Buveka, C., Phongi Kingiela, A., Cimbela kabongo and Butsana bu Nianga, Z., (2022). Incidence of exposure to magnetic fields on the health of households living near very high voltage lines in Kinshasa, Africa SCIENCE 21(3) 44–59. |
| [25] | Ngoma Buveka, C., Cimbela Kabongo J., and Butsana bu Nianga, Z., (2023). Behavior of magnetic fields due to very high voltage lines in residential areas in the West of the Democratic Republic of Congo, Africa SCIENCE 23(4) 37–151. |
| [26] | Kroetsch, D. J, Gen, X. G., Chang, S. X. and Saurette, D. D., (2011). Organic Soils of Canada: Part 1. Wetland Organic soils. Canadian Journal of Soil Science, Volume 91, Number 5. October |
| [27] | Ilanga Onzeli. F., Mooto Ilanga, L., Mulumba Mayaudi, W., Ngoma Buveka, C., and Kabasele Yenga Yenga. A, (2024). Characterization of physical parameters of the Lokolama Peatland in the Democratic Republic of Congo, Africa SCIENCE 24(1) 98–110. |
| [28] | Dargie, G. C., Lewis, S. L., Lawson, I. T., Mitchard, E. T. A, Page, S. E., Bockyo, Y. E., Ifo, S. A., (2017). Extent and carbon storage of the central Congo basin Peatland complex. Nature, (542) 86–90. |
| [29] | Page, S. E., Sjogersten, S., Lewis, S. L., (2022.). Hydroclimatic vulnerability of peat carbon in the central Congo Basin. Nature, volume 612, pages 277–282. |
| [30] | Page, S. E., Mishra, S., Agus, S., Anshari, F., Dargie, G. C., Evers, G., Jauhiainen, S., Jaya, J., Jovani-sancho, A., Laren, A. J., Siogersten, A., Ifo, S., Wijedasa, S. A., Evans, L. S (2022). Anthropogenic impacts on lowland tropical peatland biogeochemistry. Nature Reviews Earth & Environment 3, 426-443. |
| [31] | Kadima, E., Delvaux, D., Sebagenzi, S. N. L., Tack, L., Kabeya, S. M. (2011). Structure and geological history of the Congo Basin: an integrated interpretation of gravity, magnetic and reflection seismic data. Basin Res 23(5): 499–527. |
| [32] | Bocko, Y., Ifo, S., Loumeto, J. J. (2017). Quantification of carbon stocks of three key carbon pools in Central Africa: case of the La Likouala swamp forest (Northern Congo). European Scientific Journal, 13 (5): 438-456. |
| [33] | Girkin, N. T., Turner, B. L., N., Ostle, N., Craigon, J., Sjogersten., S. (2018). Root exudate analogues accelerate CO2 and CH4 production intropical peat. Soil Biology and Biochemistry, 117: 48-55. |
| [34] | Georgiou, S., Mitchard, E. T. A., Crezee, B., Dargie. G. C., Young, D. M., Jovani-Sancho, A. J,, Kitambo, B., Papa, F., Bocko Y. E., Bola, P., Crabtree., D. E., Emba, O. B., Ewango, C. E. N., Girkin, N. T., Ifo, S. A., Kanyama, J. T., Wenina Mampouya, Y. E., Mbemba, J. B. M., Ndjango, N., Palmer, P. I, Sjogerstens, S. L. and Lewis, S. L. (2023). Mapping water levels across a region of the Cuvette Centrale peatland complex. Remote Sensing 15(12): 3099. |
| [35] | Biddulph, G. E., Bocko, Y. E., Bola, P., Crezee, B., Dargie, G. C., Emba, O., Georgiou, S., Girkin, N., Hawthorne, D., Jovani-ancho, aj., tj kanyama, tj., mampouya, w. ., m. Mbemba, M., Sciumbata, M., Tyrrell G.,(the congopeat group of new researchers), (2021). Current knowledge of the Central Cuvette peatland complex and future directions for research. Wood and Forests of the Tropics, 350: 3-14. |
| [36] | Crezee, B., Dargie, G. C., Ewango, C. E. N and Mitchard, A., Boemba, Kanyama, T. J., Bola, P., Ndjango, J. N., Tgirkin, N., Bocko, Y. E., Ifo, S. A., Hubau, W. D., Seidensticker, R., Batumike, G., Imani, A., Cuni-Sanchez, C., Kiahtipes, J., Lebamba, Wotzka, H. Bean. Mapping peat thickness and carbon stocks of the central Congo Basin using field data Aug 2022, In: Nature Geoscience. 15, 8, p. 639. |
| [37] | Gumbricht, T., Roman-Cuesta, R. M., Verchot, L., Herold, M., Wittmann, F., Househlder, E. (2017). An expert system model for mapping tropical wetlands and peatlands reveals South America as the largest contributor. Global Change Biology, 23(9): 3581-3599. |
| [38] | Dargie G. C., Ian Lawson, T., Raydeden, J. TIM, Lera Miles, Taa Mitchard, E. Page, S. E., Bocko, Y. E.,. SUSPENSE L A.,. IFO andLEWIS, S (2019). Congo Basin peatlands: threats and conservation priorities, mitigationMitig Adapt Strategy Glob Change 24: 669–686 |
| [39] | AGO EE et AL., (2015). Carbon dioxide fluxes from a degraded woodland in West Africa and their responses to main environmental factors. Carbon Balance Manage., 10, 1-16. |
| [40] | Keller, J. K. (2011). Wetlands and the global carbon cycle: what might the simulated past tell us about the future? new phytologist, 192(4), 789–792. |
| [41] | Girkin, C. h vane, b. l turner, n. j ostle, b. l turner, s. sjogersten, (2020). Root oxygen mitigates methane fluxes in tropical peatlands. environmental research, 15: 064013. |
| [42] | Sciumbata, M., Wenina, Y. E. M., Mbemba, M, Dargie, G. C. Baird, A. J., Morris, MJ., Ifo, S. A., Aerts, R. Lewis, SL (2023). First estimates of fine root production in tropical peat swamp and terra firme forests of the central congo basin. scientific reports, 13, 12315. |
| [43] | Betbeder, J., Gond, V., Frappart, F., Baghdadi, N., Briant, G., Bartholomé, E. (2014). Mapping of central africa forested wetlands using remote sensing. IEEE journal of selected topics in applied earth observations and remote sensing, 7 (2): 531-542. |
| [44] | Giesen, W., Wijedasa, L. S. and Page, S. E. (2018). Unique Southeast Asian peat swamp forest habitats have relatively few distinctive plant species. Mires and Peat, Volume 22 (2018), Article 01, 1–13, International Mire Conservation Group and International Peatland Society, |
| [45] | Chadburn, S. E. Burke, E. J., Gallego-Sala, A. V., Smith, N. D., Bret-Harte, S., Charman, D. J., Drewer, J., Edgar, C. W., Euskirchen, E. S., Fortuniak, K., Gao, Y., Nakhavali, M., Pawlak, W., Schuur, E. A. G. and s. Westermann, S. (2021). [preprint]. A new approach to simulate peat accumulation, degradation and stability in a global land surface scheme (JULES vn5.8_accumulate_soil) for northern and temperate peatlands. Volume 15, issue 4. GMD, 15, 1633–1657, 2022. |
| [46] | Pulunggono, HH. B., Madani, Y. A, Nurazizah, L. L. and Zulfajrin, M. Prediction and Interpretation of Total N and Its Key Drivers in Cultivated Tropical Peat using Machine Learning and Game Theory., colebes agricultural, 4(1): 46-48, august (2023). |
| [47] | Liu, Y., Jiang, M., Lu, X., Lou, Y. and Liu, B. Carbon, Nitrogen and Phosphorus Contents of Wetland Soils in Relation to Environment Factors in Northeast China. January 2017, Wetlands 37(1) 153-161. |
| [48] | Byun, E., Finkelstein, S. A., Cowling, S. A. et al. Potential carbon loss associated with post-settlement wetland conversion in southern Ontario, Canada. Carbon Balance Manage 13, 6 (2018). |
APA Style
Onzeli, F. I., Ilanga, L. M., Tshiamala, E. K., Yenga Yenga, A. K., Buveka, C. N. (2024). Modelling of Some Physical-Chemical Parameters of the Bikoro Peat Bogs in the Congo Basin in the North-West of the Democratic Republic of Congo. Engineering Science, 9(3), 47-59. https://doi.org/10.11648/j.es.20240903.11
ACS Style
Onzeli, F. I.; Ilanga, L. M.; Tshiamala, E. K.; Yenga Yenga, A. K.; Buveka, C. N. Modelling of Some Physical-Chemical Parameters of the Bikoro Peat Bogs in the Congo Basin in the North-West of the Democratic Republic of Congo. Eng. Sci. 2024, 9(3), 47-59. doi: 10.11648/j.es.20240903.11
AMA Style
Onzeli FI, Ilanga LM, Tshiamala EK, Yenga Yenga AK, Buveka CN. Modelling of Some Physical-Chemical Parameters of the Bikoro Peat Bogs in the Congo Basin in the North-West of the Democratic Republic of Congo. Eng Sci. 2024;9(3):47-59. doi: 10.11648/j.es.20240903.11
@article{10.11648/j.es.20240903.11,
  author = {Faustin Ilanga Onzeli and Lydie Mooto Ilanga and Evariste Kazadi Tshiamala and Albert Kabasele Yenga Yenga and Crispin Ngoma Buveka},
  title = {Modelling of Some Physical-Chemical Parameters of the Bikoro Peat Bogs in the Congo Basin in the North-West of the Democratic Republic of Congo
},
  journal = {Engineering Science},
  volume = {9},
  number = {3},
  pages = {47-59},
  doi = {10.11648/j.es.20240903.11},
  url = {https://doi.org/10.11648/j.es.20240903.11},
  eprint = {https://article.sciencepublishinggroup.com/pdf/10.11648.j.es.20240903.11},
  abstract = {This study, carried out in the heart of one of the world's most important wetlands, focuses on the modelling of certain physico-chemical parameters of the Bikoro peat bogs in the Congo Basin in the north-west of the Democratic Republic of Congo. To this end, we have characterized the above-mentioned parameters using digital modeling based on satellite and in situ data from five villages that make up the three sectors of this territory. Some of the equipment used includes three GPS (Garminextrex 30), Cybertacker v3.435 on Android, cameras (Samsung Wifi 12x + GPS), passive sensors (Radar). We also used an infrared spectrophotometer. The main results in relation to the 240 samples taken show that the pH of the peat bogs in the Bikoro territory varies between (2.600±0.001) and (5.000±0.004), the electrical conductivity measured varies between [85.48±3.17] μS/cm and [97.99±5. 47] μS/cm, the experimental carbon rate reported in tonnes per hectare is 135.3021, the forest carbon stock derived from WWF LiDar is 137.1484 and the spatial distribution of the temperature of these peatlands indicates that it ranges between (22.39±1.05)°C and (24.79±1.95)°C. The results of this study show that the peat bogs in the Bikoro area are wetlands that are both significantly acidic and carbon sinks.
},
 year = {2024}
}
TY  - JOUR
T1  - Modelling of Some Physical-Chemical Parameters of the Bikoro Peat Bogs in the Congo Basin in the North-West of the Democratic Republic of Congo

AU  - Faustin Ilanga Onzeli
AU  - Lydie Mooto Ilanga
AU  - Evariste Kazadi Tshiamala
AU  - Albert Kabasele Yenga Yenga
AU  - Crispin Ngoma Buveka
Y1  - 2024/09/23
PY  - 2024
N1  - https://doi.org/10.11648/j.es.20240903.11
DO  - 10.11648/j.es.20240903.11
T2  - Engineering Science
JF  - Engineering Science
JO  - Engineering Science
SP  - 47
EP  - 59
PB  - Science Publishing Group
SN  - 2578-9279
UR  - https://doi.org/10.11648/j.es.20240903.11
AB  - This study, carried out in the heart of one of the world's most important wetlands, focuses on the modelling of certain physico-chemical parameters of the Bikoro peat bogs in the Congo Basin in the north-west of the Democratic Republic of Congo. To this end, we have characterized the above-mentioned parameters using digital modeling based on satellite and in situ data from five villages that make up the three sectors of this territory. Some of the equipment used includes three GPS (Garminextrex 30), Cybertacker v3.435 on Android, cameras (Samsung Wifi 12x + GPS), passive sensors (Radar). We also used an infrared spectrophotometer. The main results in relation to the 240 samples taken show that the pH of the peat bogs in the Bikoro territory varies between (2.600±0.001) and (5.000±0.004), the electrical conductivity measured varies between [85.48±3.17] μS/cm and [97.99±5. 47] μS/cm, the experimental carbon rate reported in tonnes per hectare is 135.3021, the forest carbon stock derived from WWF LiDar is 137.1484 and the spatial distribution of the temperature of these peatlands indicates that it ranges between (22.39±1.05)°C and (24.79±1.95)°C. The results of this study show that the peat bogs in the Bikoro area are wetlands that are both significantly acidic and carbon sinks.

VL  - 9
IS  - 3
ER  -
Department of Physics and Applied Sciences, National Pedagogical University, Kinshasa, The Democratic Republic of Congo; Department of Electromechanics, University President Joseph Kasa - Vubu, Boma, The Democratic Republic of Congo; Nuclear Safety Department, National Committee for Protection against Ionizing Radiation, Kinshasa, Democratic Republic of Congo
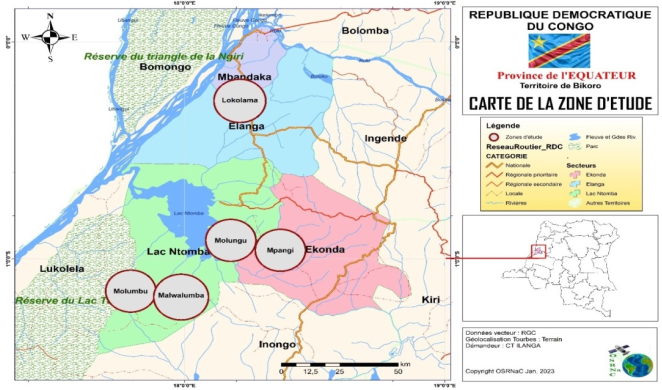
Figure 1. Map of the study area (Source: spatial remote sensing laboratory (OSRNac) UPN, 2022.
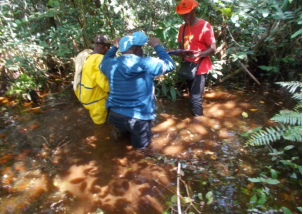
Figure 2. Taking peat cores in the locality of Lokolama, Elanga sector – Bikoro territory.
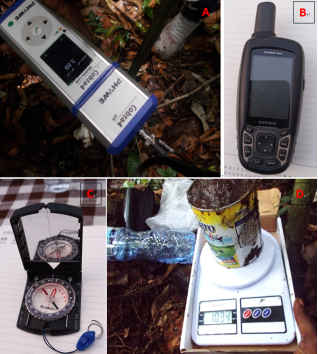
Figure 3. pH meter (A), GPS (B), compass (C) and precision balance (D) used in this study.
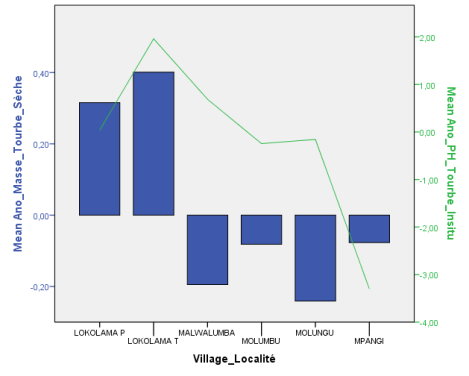
Figure 4. Dry peat mass and in situ peat pH.
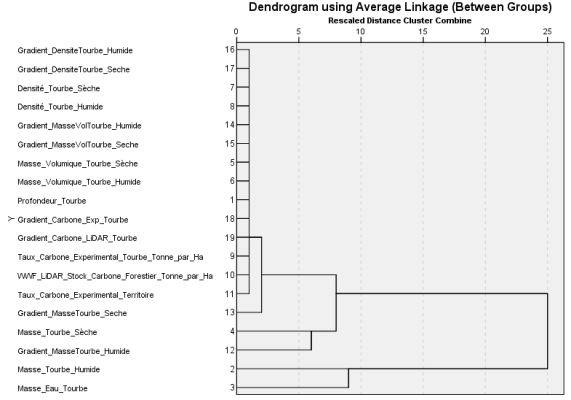
Figure 5. Correlation diagram between variables measured in situ and WWF Lidar data.
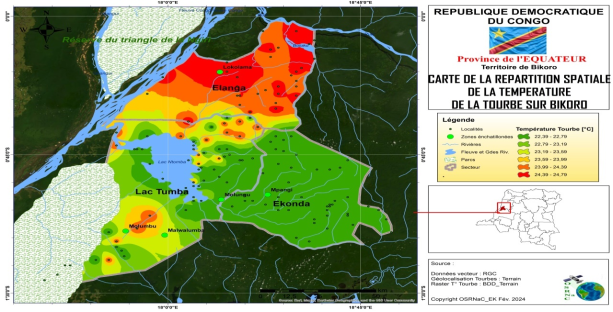
Figure 6. Spatial distribution of peat bog temperature on Bikoro.
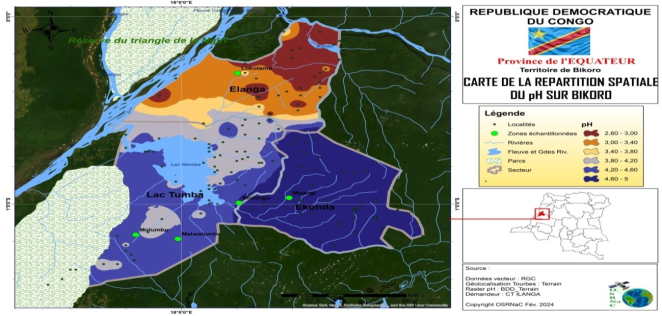
Figure 7. Spatial distribution of pH in the Bikoro Territory.
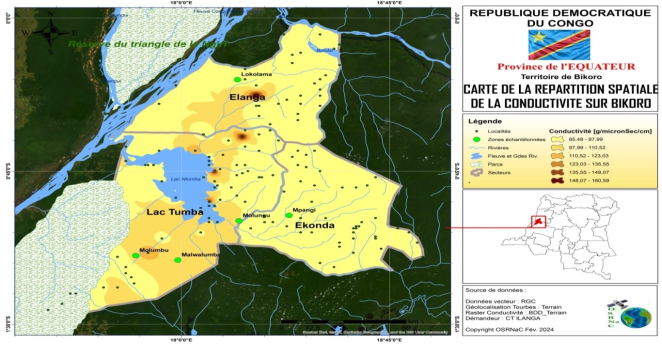
Figure 8. Spatial distribution of electrical conductivity on Bikoro.
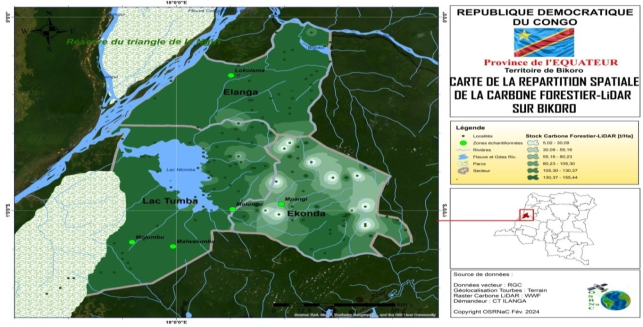
Figure 9. Spatial distribution of forest carbon rate Lidar on Bikoro.
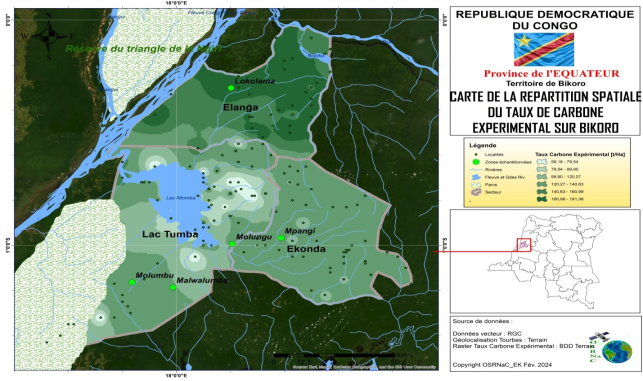
Figure 10. Spatial distribution of the experimental carbon rate on Bikoro.
Information

