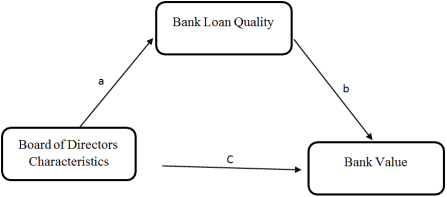
This study examines the relationship between board of directors’ characteristics and bank value and investigates whether bank loan quality mediates this relationship. Data were collected from banks listed on the Egyptian Stock Exchange over a 10-year period (2014–2023). The study uses a Tobin’s Q–based measure as a proxy for bank value. Seven board characteristics are analyzed: board size, CEO duality, board independence, gender diversity, education level, meeting frequency, and CEO experience. Bank loan quality is measured using non-performing loans. The analysis employs the SPSS PROCESS tool with 5000 bootstrap samples to estimate the total, direct, and indirect effects of board characteristics on bank value. Results confirm that bank loan quality significantly mediates the relationship between board characteristics and bank value. Banks with certain board characteristics show different levels of bank value compared to those without these characteristics. When bank loan quality is held constant, the effect of board characteristics on bank value remains significant. This research answers two key questions: How do board characteristics influence bank value? And does bank loan quality transfer the influence of these characteristics on bank value? The study offers practical recommendations for policymakers, bank managers, and investors.
| Published in | Innovation Business (Volume 1, Issue 1) |
| DOI | 10.11648/j.ib.20260101.11 |
| Page(s) | 1-20 |
| Creative Commons |
This is an Open Access article, distributed under the terms of the Creative Commons Attribution 4.0 International License (http://creativecommons.org/licenses/by/4.0/), which permits unrestricted use, distribution and reproduction in any medium or format, provided the original work is properly cited. |
| Copyright |
Copyright © The Author(s), 2026. Published by Science Publishing Group |
Bank Value, Bank Loan Quality, Board of Directors’ Characteristics
Variable | Obs. | Mean | St. Dev. | Min | Max |
|---|---|---|---|---|---|
BVw | 100 | .97176 | .0702938 | .8965862 | 1.167891 |
BODSIZ | 100 | 10.14 | 1.758213 | 6 | 13 |
BODEDU | 100 | 14.97 | 4.712877 | 8 | 26 |
BODMEET | 100 | 8.9 | 3.109126 | 6 | 17 |
CEOEXP | 100 | 34.51 | 6.821675 | 20 | 50 |
Controls variables descriptive statistics | |||||
LNNPLw | 100 | 21.18215 | 1.408994 | 19.47958 | 24.84957 |
SIZEw | 100 | 25.0582 | .834627 | 23.78881 | 26.8342 |
LEVw | 100 | .905927 | .0286485 | .8577171 | .9481288 |
Growthw | 100 | .1981226 | .1376497 | .0143944 | .5325 |
Agew | 100 | 3.488505 | .2534652 | 2.890372 | 3.7612 |
CEDO | Freq. | Percent | Cum. |
|---|---|---|---|
0 | 56 | 56% | 56 |
1 | 44 | 44% | 100 |
Total | 100 | 100 |
BODIND | Freq. | Percent | Cum. |
|---|---|---|---|
0 | 1 | 1% | 1 |
1 | 99 | 99% | 100 |
Total | 100 | 100 |
GENDIV | Freq. | Percent | Cum. |
|---|---|---|---|
0 | 20 | 20% | 20 |
1 | 80 | 80% | 100 |
Total | 100 | 100 |
BVw | CEODO | BODIND | GENDIV | BODSIZ | BODEDU | BODMEET | |
|---|---|---|---|---|---|---|---|
BVw | 1 | ||||||
CEODO | -0.8160 | 1 | |||||
BODIND | -0.7738 | -0.2613 | 1 | ||||
GENDIV | 0.2569 | 0.9208 | 0.6195 | 1 | |||
BODSIZ | -0.3762 | -0.2091 | 0.1804 | 1 | |||
**0.0001 | *0.0368 | ***0.0725 | 0.3807 | ||||
BODEDU | -0.3041 | 0.7283 | 1 | ||||
**0.0021 | 0.3213 | 0.1380 | 0.3058 | **0.0000 | |||
BODMEET | 0.2424 | 0.3925 | 0.3651 | 1 | |||
-0.2064 | 0.6805 | 0.3511 | **0.0151 | **0.0001 | **0.0002 | ||
CEOEXP | 0.3460 | 0.3580 | -0.2115 | ||||
0.5743 | **0.0004 | 0.5092 | **0.0003 | *0.0347 | 0.2240 | 0.6820 | |
LNNPLw | 0.6782 | 0.2577 | -0.3539 | -0.2731 | 0.1859 | ||
**0.0000 | **0.0096 | 0.3387 | 0.3345 | **0.0003 | **0.0060 | ***0.0640 | |
SIZEw | 0.5396 | 0.3174 | -0.2523 | 0.2927 | |||
**0.0000 | 0.9850 | 0.1270 | **0.0013 | **0.0113 | **0.0031 | 0.1454 | |
LEVw | -0.2458 | ||||||
-0.4593 | -0.6992 | -0.2232 | -0.2768 | 0.8836 | -0.2123 | **0.0137 | |
Growthw | 0.2334 | -0.2332 | |||||
-0.9446 | **0.0175 | -0.2696 | **0.0195 | -0.6659 | 0.7780 | 0.6466 | |
Agew | 0.2334 | -0.1712 | 0.3976 | ||||
-0.6386 | **0.0194 | -0.8816 | -0.3490 | -0.5499 | ***0.0886 | **0.0000 |
CEOEXP | LNNPL | SIZEw | LEVw | Growthw | Agew | ||
|---|---|---|---|---|---|---|---|
CEOEXP | 1 | ||||||
LNNPL | 0.3037 | 1 | |||||
**0.0021 | |||||||
SIZEw | 0.4150 | 0.6940 | 1 | ||||
**0.0000 | **0.0000 | ||||||
LEVw | -0.1798 | -0.3405 | 1 | ||||
0.1780 | ***0.0735 | **0.0005 | |||||
Growthw | -0.1774 | 0.1902 | 1 | ||||
-0.5635 | 0.3410 | ***0.0775 | ***0.0581 | ||||
Agew | 0.2828 | 0.3858 | 0.2328 | 0.2454 | 1 | ||
**0.0044 | **0.0001 | 0.2676 | **0.0197 | **0.0139 |
Me (NPL) | Y (Bank value) | |||||
|---|---|---|---|---|---|---|
Coeff. | S.E | P-Value | Coeff. | S.E | P-Value | |
X (BOD SIZ) | a=-.1398 | .0573 | .0166 | C’=-.0040 | .0031 | .2039 |
Me (NPL) | -- | -- | -- | b=.0387 | .0050 | .0000 |
µ1 (SIZE) | 1.0601 | .1406 | .0000 | .0073 | .0084 | .3850 |
µ2 (LEV) | -2.7401 | 2.8695 | .3421 | .4713 | .2184 | .0335 |
µ3 (Growth) | 1.4625 | .6550 | .0282 | -.0033 | .0244 | .8914 |
µ4 (Age) | 1.5741 | .3145 | .0000 | -.1126 | .0194 | .0000 |
Const. | β1=-.7.2595 | 4.6149 | .1191 | β2=-.0255 | .3427 | .9410 |
R2 = 62.66% | R2 =61.27% | |||||
F =29.8745 | F =38.0247 | |||||
P =.0000 | P =.0000 | |||||
Me (NPL) | Y (Bank value) | |||||
|---|---|---|---|---|---|---|
Coeff. | S.E | P-Value | Coeff. | S.E | P-Value | |
X (CEODO) | a=.4791 | .1943 | .0155 | C’=-.0214 | .0085 | .0138 |
Me (NPL) | -- | -- | -- | b=.0435 | .0053 | .0000 |
µ1 (SIZE) | 1.1483 | .1492 | .0000 | .0037 | .0083 | .6570 |
µ2 (LEV) | -1.0661 | 3.2394 | .7428 | .4438 | .2165 | .0432 |
µ3 (Growth) | 1.2332 | .6764 | .0714 | .0085 | .0241 | .7254 |
µ4 (Age) | 1.3653 | .3656 | .0003 | -.1108 | .0193 | .0000 |
Const. | β1=-11.8443 | 4.9638 | .0190 | β2=-.0503 | .3209 | .8757 |
R2 =62.60% | R2 =62.40 | |||||
F =26.0722 | F =26.3968 | |||||
P =.0000 | P =.0000 | |||||
Me (NPL) | Y (Bank value) | |||||
|---|---|---|---|---|---|---|
Coeff. | S.E | P-Value | Coeff. | S.E | P-Value | |
X (BODIND) | a=.1318 | .1876 | .4840 | C’=-.0756 | .0068 | .0000 |
Me (NPL) | -- | -- | -- | b=.0407 | .0051 | .0000 |
µ1 (SIZE) | 1.1366 | .1556 | .0000 | .0083 | .0085 | .3313 |
µ2 (LEV) | -2.2089 | 3.2761 | .5018 | .4715 | .2146 | .0305 |
µ3 (Growth) | 1.5949 | .7040 | .0258 | -.0073 | .0243 | .7631 |
µ4 (Age) | 1.5724 | .3394 | .0000 | -.1155 | .0197 | .0000 |
Const. | β1=-11.2297 | 5.1985 | .0333 | β2=-.0478 | .3221 | .8823 |
R2 =60.04% | R2 =61.58% | |||||
F =63.4129 | F =41.8781 | |||||
P =.0000 | P =.0000 | |||||
Me (NPL) | Y (Bank value) | |||||
|---|---|---|---|---|---|---|
Coeff. | S.E | P-Value | Coeff. | S.E | P-Value | |
X (GENDIV) | a=.2395 | .1996 | .2332 | C’=-.0024 | .0151 | .8729 |
Me (NPL) | -- | -- | -- | b=.0405 | .0051 | .0000 |
µ1 (SIZE) | 1.1752 | .1524 | .0000 | .0079 | .0079 | .3212 |
µ2 (LEV) | -2.0622 | 3.2046 | .5215 | .4914 | .2110 | .0220 |
µ3 (Growth) | 1.4742 | .7070 | .0398 | -.0037 | .0256 | .8840 |
µ4 (Age) | 1.5337 | .3324 | .0000 | -.1158 | .0204 | .0000 |
Const. | β1=-11.8474 | 5.1649 | .0240 | β2=-.1234 | .2967 | .6785 |
R2 =60.43% | R2 =60.48% | |||||
F =30.0794 | F =31.4968 | |||||
P =.0000 | P =.0000 | |||||
Me (NPL) | Y (Bank value) | |||||
|---|---|---|---|---|---|---|
Coeff. | S.E | P-Value | Coeff. | S.E | P-Value | |
X (BODEDU) | a=-.0132 | .0171 | .4434 | C’=-.0018 | .0009 | .0457 |
Me (NPL) | -- | -- | -- | b=.0401 | .0051 | .0000 |
µ1 (SIZE) | 1.1118 | .1559 | .0000 | .0045 | .0092 | .6307 |
µ2 (LEV) | -2.7481 | 3.2299 | .3970 | .4196 | .2296 | .0709 |
µ3 (Growth) | 1.6009 | .6978 | .0240 | .0000 | .0232 | .9996 |
µ4 (Age) | 1.5522 | .3324 | .0000 | -.1175 | .0197 | .0000 |
Const. | β1=-9.7227 | 5.3110 | .0703 | β2=.0685 | .3700 | .8536 |
R2 =60.19% | R2 =61.69% | |||||
F =29.5794 | F =40.7679 | |||||
P =.0000 | P =.0000 | |||||
Me (NPL) | Y (Bank value) | |||||
|---|---|---|---|---|---|---|
Coeff. | S.E | P-Value | Coeff. | S.E | P-Value | |
X (BODMEET) | a=-.0188 | .0351 | .5921 | C’=-.0025 | .0016 | .1362 |
Me (NPL) | -- | -- | -- | b=.0402 | .0050 | .0000 |
µ1 (SIZE) | 1.1346 | .1551 | .0000 | .0074 | .0089 | .4078 |
µ2 (LEV) | -2.9838 | 3.4811 | .3935 | .3915 | .2525 | .1245 |
µ3 (Growth) | 1.5389 | .7060 | .0318 | -.0085 | .0250 | .7351 |
µ4 (Age) | 1.6921 | .4308 | .0002 | -.0993 | .0208 | .0000 |
Const. | β1=-10.5849 | 5.2856 | .0481 | β2=-.0498 | .3510 | .8876 |
R2 =60.15% | R2 =61.31% | |||||
F =28.6347 | F =37.5723 | |||||
P =.0000 | P =.0000 | |||||
Me (NPL) | Y (Bank value) | |||||
|---|---|---|---|---|---|---|
Coeff. | S.E | P-Value | Coeff. | S.E | P-Value | |
X (CEOEXP) | a=-.0144 | .0130 | .2702 | C’=-.0011 | .0006 | .0673 |
Me (NPL) | -- | -- | -- | b=.0399 | .0052 | .0000 |
µ1 (SIZE) | 1.1798 | .1569 | .0000 | .0115 | .0088 | .1947 |
µ2 (LEV) | -2.4806 | 3.2699 | .4500 | .4696 | .2156 | .0319 |
µ3 (Growth) | 1.5520 | .7007 | .0292 | -.0044 | .0229 | .8496 |
µ4 (Age) | 1.6781 | .3612 | .0000 | .1062 | .0202 | .0000 |
Const. | β1=-11.8000 | 5.3801 | .0308 | β2=-.1763 | .3066 | .5667 |
R2 =60.40% | R2 =61.36% | |||||
F =31.9908 | F =28.3792 | |||||
P =.0000 | P =.0000 | |||||
BOD characteristics | Models |
|---|---|
BOD size | Y = β3 + c BODSIZ+ µ1 SIZw+ µ2 LEVw+ µ3 Growthw+ µ4 Agew + e BV |
CEO duality | Y = β3 + c CEODO+ µ1 SIZw+ µ2 LEVw+ µ3 Growthw+ µ4 Agew + e BV |
BODIND | Y = β3 + c BODIND+ µ1 SIZw+ µ2 LEVw+ µ3 Growthw+ µ4 Agew + e BV |
GENDIV | Y = β3 + c GENDIV+ µ1 SIZw+ µ2 LEVw+ µ3 Growthw+ µ4 Agew + e BV |
BODEDU | Y = β3 + c BODEDU+ µ1 SIZw+ µ2 LEVw+ µ3 Growthw+ µ4 Agew + e BV |
BODMEET | Y = β3 + c BODMEET+ µ1 SIZw+ µ2 LEVw+ µ3 Growthw+ µ4 Agew + e BV |
CEOEXP | Y = β3 + c CEOEXP+ µ1 SIZw+ µ2 LEVw+ µ3 Growthw+ µ4 Agew + e BV |
BOD characteristics | Hypothesis | C | t-value | P-value | Sig | Decision |
|---|---|---|---|---|---|---|
BODSIZ | H0.1: There is no relationship between the size of the board of director and Bank value. | -0.0094 | -2.5945 | 0.011 | sig at 5% | NOT supported |
CEODU | H0.2: There in no relationship between CEO Duality and Bank value. | -0.0006 | -0.0442 | 0.9649 | Not significance | Supported |
BODIND | H0.3: There is no relationship between the presence of independent members in directors’ board and Bank value. | 0.0702 | -8.3372 | 0.000 | sig at 10% | NOT supported |
GENDIV | H0.4: There is no relationship between gender diversity and Bank value. | -0.0121 | -0.8428 | 0.4015 | Not significance | supported |
BODEDU | H0.5: There is no relationship between number of the board of directors’ Meetings and Bank value. | -0.0023 | -2.0919 | 0.0391 | sig at 5% | NOT supported |
BODMEET | H0.6: There is no relationship between the board of directors’ education level and bank value. | -0.0032 | -1.8238 | 0.0714 | sig at 5% | NOT supported |
CEOEXP | H0.7: There is no relationship between CEO number of experience years and Bank Value. | -0.0017 | -2.3173 | 0.0227 | sig at 5% | NOT supported |
BOD characteristics | Hypothesis | c | t-value | P-value | Sig | Decision |
|---|---|---|---|---|---|---|
BODSIZ | H03.1: There is no direct relationship between board of directors’ size and bank value. | -0.004 | -1.2794 | 0.2039 | not sig | supported |
CEODU | H03.2: There is no direct relationship between board of CEO duality and bank value. | -0.0214 | -2.5099 | -0.0138 | 5% | Not supported |
BODIND | H03.3: There is no direct relationship between the presence of independent members in the Board of directors and bank value. | -0.0756 | -11.193 | 0 | 1% | Not supported |
GENDIV | H03.4: There is no direct relationship between board of directors’ gender diversity and bank value. | -0.0024 | -0.1604 | 0.8729 | not sig | supported |
BODEDU | H03.5: There is no direct relationship between board of directors’ education levels and bank value. | -0.0018 | -2.0257 | 0.0457 | 5% | Not supported |
BODMEET | H03.6: There is no direct relationship between board of directors’ meeting numbers and bank value. | -0.0025 | -1.5031 | 0.1362 | not sig | supported |
CEOEXP | H03.7: There is no direct relationship between CEO Experience years and bank value. | -0.0011 | -1.8514 | 0.0673 | 10% | Not supported |
BOD characteristics | Hypothesis | P-value | Sig | Decision |
|---|---|---|---|---|
BODSIZ | H02.1: There is no indirect relationship between board of directors’ Size and Bank value through Bank loan quality (non-performing loans). | -0.0054 | 1% | Not supported |
CEODU | H02.2: There is no indirect relationship between CEO duality and Bank value through Bank loan quality (non-performing loans). | 0.0208 | 5% | Not supported |
BODIND | H02.3: There is no indirect relationship between the presence of independent members in board of directors’ and Bank value through Bank loan quality (non-performing loans). | 0.0054 | 1% | Not supported |
GENDIV | H02.4: There is no indirect relationship between board of directors’ gender diversity and Bank value through Bank loan quality (non-performing loans). | -0.0097 | 1% | Not supported |
BODEDU | H02.5: There is no indirect relationship between board of directors’ Education levels and Bank value through Bank loan quality (non-performing loans). | -0.0005 | 1% | Not supported |
BODMEET | H02.6: There is no indirect relationship between board of directors’ Meetings number and Bank value through Bank loan quality (non-performing loans). | -0.0008 | 1% | Not supported |
CEOEXP | H02.7: There is no indirect relationship between CEO Experience years and Bank value through Bank loan quality (non-performing loans). | -0.0006 | 1% | Not supported |
CG | Corporate Governance |
BOD | Board of Directors |
BODSIZ | Board of Directors’ Size |
BODIND | Board of Directors’ Independence |
BODEDU | Board of Directors’ Education Level |
BODMEET | Board of Directors’ Meetings Numbers |
GENDIV | Gender Diversity |
CEODU | Chief Executive Officer Duality |
CEOEXP | Chief Executive Officer Experiences Year |
BV | Bank Value |
FM | Firm Value |
BLQ | Bank Loan Quality |
NPL | Non-performing Loans |
LEV | Financial Leverage |
LSG | Loan Sales Growth |
BSIZ | Bank Size |
BAGE | BANK AGE |
OECD | Organization for Economic Cooperation and Development |
MBS | Mortgage-backed Securities |
CDO | Collateralized Debts Obligations |
PD | Probability of Default |
LGD | Loss Given Default |
EAD | Exposure at Default |
ROA | Return on Assets |
ROE | Return on Equity |
RAROC | Risk-Adjusted Return on Capital |
CAR | Capital Adequacy Ratio |
LLP | Loan Loss Provision |
IFRS | International Financial Reporting Standards |
DCF | Discounted Cash Flow |
EVA | Economic Value Added |
ROI | Return on Investment |
DDM | Dividend Discount Models |
WACC | Weighted Average Cost of Capital |
BSC | Bachelor of Science Degree |
MSC | Master of Science Degree |
PHD | Doctor of Philosophy Degree |
| [1] | Abdelsalam, O., & Weetman, P. (2016). Introducing corporate governance into financial reporting regulation: The case of Egypt. Journal of International Accounting, Auditing and Taxation, 25(1), 35-50. |
| [2] | Abulezz, M. E. (2022). Empirical Research Methods in Accounting, 3rd edition, author, Zagazig, (in Arabic). |
| [3] | Adams, R. B., & Ferreira, D. (2009). Women in the boardroom and their impact on governance and performance. Journal of Financial Economics, 94(2), 291–309. |
| [4] | Adams, R. B., & Mehran, H. (2012). Bank board structure and performance: Evidence for large bank holding companies. Journal of Financial Intermediation, 21(2), 243-267. |
| [5] | Adams, R. B., Hermalin, B. E., & Weisbach, M. S. (2010). The role of boards of directors in corporate governance: A conceptual framework and survey. Journal of Economic Literature, 48(1), 58-107. |
| [6] | Adeusi, S. O., Akeke, N. I., Aribaba, F. O., & Adebisi, O. S. (2013). Corporate governance and firm financial performance: Do ownership and board size matter? Academic Journal of Interdisciplinary Studies. |
| [7] | Allen, L., Saunders, A., & Walter, I. (2001). Consolidation in the banking industry: Causes and consequences. Journal of Banking & Finance, 25(5), 913-939. |
| [8] | Altman, E., & Sabato, G. (2007). Modeling credit risk for SMEs: Evidence from the US market. Abacus, 43(3), 332-357. |
| [9] | Amer, M. (2016). Corporate governance and financial performance: Evidence from Egypt. Journal of Business Research, 10(2), 87-101. |
| [10] | Angbazo, L. (1997). Commercial bank net interest margins, default risk, interest-rate risk, and off-balance sheet banking. Journal of Banking & Finance, 21(1), 55-87. |
| [11] | Beatty, A., & Liao, S. (2011). Do Delays in Expected Loss Recognition Affect Banks’ Willingness to Lend? Journal of Accounting and Economics, 52, 1-20. |
| [12] | Belaid, F. (2014). Corporate governance and firm performance: Evidence from the MENA region. International Journal of Business and Management, 9(8), 12-25. |
| [13] | Carey, M. S., & Gordy, M. B. (2002). The simple intensity-based approach to credit risk modeling. Economic Review, 87(4), 37-48. |
| [14] | Chung, K. H., & Pruitt, S. W. (1994). A simple approximation of Tobin’s q. Financial Management, 23(3), 70-74. |
| [15] | Clair, R. T. (1992). Loan growth and bank risk: Some lessons from Japan. Economic Review, 77(2), 19-34. |
| [16] | Dewi, R. S., Sari, M. P., & Setiawan, D. (2023). Financial distress prediction using machine learning models. International Journal of Economics and Finance, 15(1), 50-67. |
| [17] | Fahlenbrach, R., & Stulz, R. M. (2011). Bank CEO incentives and the credit crisis. Journal of Financial Economics, 99(1), 11–26. |
| [18] | Faleye, O. (2007). Classified boards, firm value, and managerial entrenchment. Journal of Financial Economics, 83(2), 501-529. |
| [19] | Federal reserve board, (2023) review of the reserve’s supervision and regulation of Silicon Valley bank. Washington, D. C. 20551 on April 28, 2023. |
| [20] | Fuadah, L. L., Putra, R. A., & Firmansyah, M. A. (2022). The impact of financial literacy on investment decision-making. International Journal of Business and Economics, 24(3), 100-120. |
APA Style
Omran, K. A. (2026). The Relationship Between Board of Directors Characteristics and Bank Value: Does Bank Loan Quality Matters (Empirical Study on EGX Listed Banks). Innovation Business, 1(1), 1-20. https://doi.org/10.11648/j.ib.20260101.11
ACS Style
Omran, K. A. The Relationship Between Board of Directors Characteristics and Bank Value: Does Bank Loan Quality Matters (Empirical Study on EGX Listed Banks). Innov. Bus. 2026, 1(1), 1-20. doi: 10.11648/j.ib.20260101.11
AMA Style
Omran KA. The Relationship Between Board of Directors Characteristics and Bank Value: Does Bank Loan Quality Matters (Empirical Study on EGX Listed Banks). Innov Bus. 2026;1(1):1-20. doi: 10.11648/j.ib.20260101.11
@article{10.11648/j.ib.20260101.11,
  author = {Kareem Ahmed Omran},
  title = {The Relationship Between Board of Directors Characteristics and Bank Value: Does Bank Loan Quality Matters (Empirical Study on EGX Listed Banks)},
  journal = {Innovation Business},
  volume = {1},
  number = {1},
  pages = {1-20},
  doi = {10.11648/j.ib.20260101.11},
  url = {https://doi.org/10.11648/j.ib.20260101.11},
  eprint = {https://article.sciencepublishinggroup.com/pdf/10.11648.j.ib.20260101.11},
  abstract = {This study examines the relationship between board of directors’ characteristics and bank value and investigates whether bank loan quality mediates this relationship. Data were collected from banks listed on the Egyptian Stock Exchange over a 10-year period (2014–2023). The study uses a Tobin’s Q–based measure as a proxy for bank value. Seven board characteristics are analyzed: board size, CEO duality, board independence, gender diversity, education level, meeting frequency, and CEO experience. Bank loan quality is measured using non-performing loans. The analysis employs the SPSS PROCESS tool with 5000 bootstrap samples to estimate the total, direct, and indirect effects of board characteristics on bank value. Results confirm that bank loan quality significantly mediates the relationship between board characteristics and bank value. Banks with certain board characteristics show different levels of bank value compared to those without these characteristics. When bank loan quality is held constant, the effect of board characteristics on bank value remains significant. This research answers two key questions: How do board characteristics influence bank value? And does bank loan quality transfer the influence of these characteristics on bank value? The study offers practical recommendations for policymakers, bank managers, and investors.},
 year = {2026}
}
TY  - JOUR
T1  - The Relationship Between Board of Directors Characteristics and Bank Value: Does Bank Loan Quality Matters (Empirical Study on EGX Listed Banks)
AU  - Kareem Ahmed Omran
Y1  - 2026/01/31
PY  - 2026
N1  - https://doi.org/10.11648/j.ib.20260101.11
DO  - 10.11648/j.ib.20260101.11
T2  - Innovation Business
JF  - Innovation Business
JO  - Innovation Business
SP  - 1
EP  - 20
PB  - Science Publishing Group
UR  - https://doi.org/10.11648/j.ib.20260101.11
AB  - This study examines the relationship between board of directors’ characteristics and bank value and investigates whether bank loan quality mediates this relationship. Data were collected from banks listed on the Egyptian Stock Exchange over a 10-year period (2014–2023). The study uses a Tobin’s Q–based measure as a proxy for bank value. Seven board characteristics are analyzed: board size, CEO duality, board independence, gender diversity, education level, meeting frequency, and CEO experience. Bank loan quality is measured using non-performing loans. The analysis employs the SPSS PROCESS tool with 5000 bootstrap samples to estimate the total, direct, and indirect effects of board characteristics on bank value. Results confirm that bank loan quality significantly mediates the relationship between board characteristics and bank value. Banks with certain board characteristics show different levels of bank value compared to those without these characteristics. When bank loan quality is held constant, the effect of board characteristics on bank value remains significant. This research answers two key questions: How do board characteristics influence bank value? And does bank loan quality transfer the influence of these characteristics on bank value? The study offers practical recommendations for policymakers, bank managers, and investors.
VL  - 1
IS  - 1
ER  -
Accounting Department, Osim Higher Institute of Administrative Sciences, Giza, Egypt
Information