Research Article | | Peer-Reviewed

Influence of Manure Management Practices on Methane Emissions in Smallholder Dairy System, Northern Tanzania

Received: 9 June 2026     Accepted: 29 June 2026     Published: 22 July 2026
Views:       Downloads:
Abstract

The expansion of smallholder dairy farming in the developing countries is associated with an increase in manure production. However, the poor management of manure leads to an increase in methane gas emissions. This study was designed to evaluate methane gas emission from manure under different manure management practices in the smallholder dairy farms in Arusha City (urban) and Arusha District Council (peri-urban), Northern Tanzania. Data were collected through a semi- structured questionnaire, and the Intergovernmental Panel on Climate Change (IPCC) tier two methodology was used to estimate methane gas emissions from different manure management systems, including solid storage, daily spread, anaerobic digester, composting and slurry. Data on the dairy herds’ structure and the manure management system were analysed using Chi-square. The general linear model (GLM) of the statistical package of social sciences (SPSS) was used to estimate the effect of feed types and manure management systems on manure composition and methane gas emission from different management practices. The result revealed that there were significant differences in nutritional composition across feed types. There was a significant difference in dairy herd structure where urban farmers had more lactating cows, heifers and calves than those farmers in peri-urban areas. Furthermore, feed type significantly influenced manure composition, particularly volatile solids (VS) and total carbon (TC). Additionally, there were significant differences in manure composition across the manure management system in terms of volatile solids, pH, moisture, total organic matter, and total carbon. Methane gas emissions differed significantly across the manure management practices (P <0.05). The daily spread had less emission of 0.14 kg CH4 head-1year-1 which was attributed to aerobic conditions that limit methane emission, while higher emission from other management systems was due to anaerobic conditions that facilitate emissions. In conclusion, a significant variation in methane emissions was found among the manure management systems, with the highest emissions occurring in the slurry management system and the lowest in the daily spread system. The study recommends the anaerobic digestion system than over daily spread system because previous studies showed that anaerobic digester system not only mitigates methane gas emissions among smallholder dairy farmers but also optimizes the value of manure, while daily spread leads to water pollution due to runoff to surface water resources, hence causing waterborne diseases to both humans and animal.

Published in International Journal of Energy and Environmental Science (Volume 11, Issue 4)
DOI 10.11648/j.ijees.20261104.11
Page(s) 65-75
Creative Commons

This is an Open Access article, distributed under the terms of the Creative Commons Attribution 4.0 International License (http://creativecommons.org/licenses/by/4.0/), which permits unrestricted use, distribution and reproduction in any medium or format, provided the original work is properly cited.

Copyright

Copyright © The Author(s), 2026. Published by Science Publishing Group

Keywords

Manure Composition, Methane Emission, Greenhouse Gas, IPCC Guidelines, Anaerobic and Digester

1. Introduction
Methane is a potent greenhouse gas that contributes to the climate change effect. According to intergovernmental panel on climate change (IPCC) this gas adds approximately 14-16% of all global greenhouse gas emissions (1). Its impact is considerable, as it influences human and livestock health by exacerbating climate change-related to temperature, which in turn increases disease outbreak. In response to the trends associated with this gas, the Paris Climate Agreement aims to limit the global temperature rise to below 2°C to mitigate the effects of climate change . As reported by Yue and Gao, human activities are primarily responsible for methane emissions . Among these activities, dairy farming significantly contributes to emissions through enteric fermentation and manure management . The growth of dairy farming is essential to meet the rising demand for animal protein, driven by population growth, improved nutritional awareness, and urbanization . The growth of dairy farming results in higher manure production, which necessitates effective management to ensure environmental safety. In Sub Saharan Africa (SSA) smallholder dairy farmers are the main producers of milk, accounting for approximately 70% of all livestock producers , this indicates significant production of large quantity of manure. According to Tedeschi et al. contribution of ruminant livestock on GHG emission varies geographically , this could be due to differences in manure management systems and climatic condition which in turned yield substantial amount of manure. Smallholder farmers practice different manure management strategies, including solid storage, daily spreading, composting, liquid storage, and the use of anaerobic digesters. Manure management systems contributes 10% of global agricultural emissions, including methane and Nitrous oxide . Both management practices and climatic conditions of the area, such as temperature, moisture, and oxygen levels, affect the methanogenic bacteria activities that produce methane . High temperature in the absence of oxygen favors the decomposition of organic matter by methanogenic bacteria and hence promotes methane production . It has been noted that these bacteria perform well in anaerobic condition at temperature of 5-55°C, with limited methanogenesis above this range . Both the composition and quantity of the manure also influence the amount of methane produced in it . Additionally, the type of feed and its digestibility influences the manure composition through retention of undigested organic material in manure, resulting in emissions during anaerobic breakdown. For example, feeds with lower digestibility because of higher NDF content result in a larger amount of undigested organic matter in cattle faeces; therefore, more digestible feed decreases the volume of volatile solids in manure that can be transformed into methane . Despite the significant contribution of manure management in reduction of the greenhouse gas (GHG) emission, most studies on dairy cows focus on emission from enteric fermentation and mitigation strategies , while methane emission from manure has paid little attention. There is limited information available regarding possibilities of reducing methane emissions from manure managed under smallholder management systems particularly in the tropical environment. Information on manure handling is essential in developing specific mitigation strategies against methane emission. This study evaluated the influence of manure management practices on manure composition and methane emissions from different management systems used by smallholder dairy farmers in urban and peri-urban areas. The findings of this study are useful for development of intervention strategies to address emissions generated from various manure management systems to contribute into the global mission of 30% reduction in GHG emissions by 2030.
2. Materials and Methods
2.1. Description of the Study Area
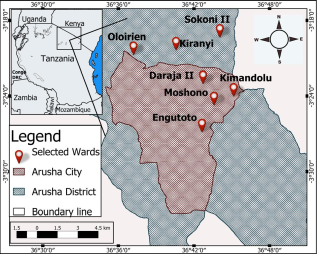
The research was carried out at two locations in Northern Tanzania: Arusha City Council, designated as urban, and Arusha District Council, classified as peri-urban area. The map of the study area was obtained from the National Bureau of Statistics (NBS) is shown in (Figure 1). The Arusha district council is positioned south of the Equator, situated between the latitudes of 3.10° - 4.0°N and longitudes of 34.47°-35.56° E. The area is elevated, ranging from 1375 m to 1400 m above sea level. It receives an average annual rainfall of 880 mm and has a mean temperature of 20°C. The region experiences its lowest temperature of 17°C in July and its highest temperature of 22°C in March . The second location, Arusha city, is found between the latitudes of 2° and 6° south and longitudes of 34.5° and 38.0° east. This area has an elevation ranging from 1130 to 1450 metres above sea level . Additionally, the location receives annual rainfall between 500 mm and 1,200 mm and temperatures ranging from 17°C to 34°C . Smallholder farmers in these areas mostly dominantly adopted intensive dairy farming to raise crossbred dairy breeds like Friesian and Ayrshire crossed with native short-horned Zebu. The area was purposively selected, as it is one of Tanzania's dairy hubs, and there is an ongoing project, namely Enviro-Cow. This project aims to set up climate mitigation strategies by assessing dairy emissions in Africa and enhance resilience towards effects associated with climate change.
Figure 1. A map showing manure sampling areas in Arusha City and Arusha District Councils, Northern Tanzania.
2.2. Study Design
The study employed a cross-sectional design involving field observation and household surveys using structured questionnaires to fulfill the study objective. A total of 100 smallholder dairy farmers, evenly distributed between two sites (50 from each), were interviewed. The household head interview was conducted in Swahili, the national language of Tanzania, to ensure clear communication and avoid language barriers. The questionnaire included both closed and open-ended questions to fulfill the study's objectives and included key information on herd structure, feed types, manure collection, and manure management systems.
2.3. Sampling Procedure
A two-stage purposive sampling design was employed, where the first stage was the selection of one hundred (100) smallholder dairy farmers recruited from the Enviro-cow project in both sites. In the second stage, 50 smallholder dairy farmers (25 from each site) were further selected for feed and manure sample collection. This selection considered the variation in feed types and manure management systems at both sites to make the sample representative. During the field survey, notable differences were observed between the two sites, where urban farmers predominantly used crop residues rather than grasses due to accessibility, such as maize stover, bean straws, banana leaves, stems and peels and potato peels. On the other hand, urban farmers relied on grasses, especially natural grasses collected along roadside and nearby farms. A total of fifty (50) forage samples (grasses and crop residues) and 50 samples of concentrates were collected. From the same households where feeds were sampled, about fifty (50) manure samples were collected (one sample per household, representing different manure management systems). Samples were collected from different management systems as follows; 12 samples were from solid storage, 11 from daily spread, and 10 from anaerobic digester, 9 from slurry, and 8 from composting. The number of samples varies across the management system due to the actual distribution of the management system observed during surveys.
2.4. Feed Sampling, Collection and Preparation
Feed samples were collected at the end of the dry season and the beginning of the rainy season, representing the transition period. Samples were collected from the same household where the manure sample was collected in order to observe the effect of feed on manure composition. From a feed offered to dairy cows, including forages and concentrates, a sample of at least 200 g was collected per household. Forages were collected directly from the feed troughs. A total of 50 feed samples (25 from each site), comprised of 27 samples of grasses and 23 crop residues, were collected. The proportion of forage types varied by location whereby, in urban areas, 48% were grasses and 52% were crop residues, while in peri- urban areas, 64% were grasses, and 36% were crop residues. Additionally, 50 concentrate samples, one sample per households, were collected, where concentrate feed was composed of maize bran, cottonseed cake and sunflower seed cake. During forage sampling, each sample was weighed using a portable weighing scale to record initial field weight and then packed into a well-labeled envelope. Samples were air- dried at a room temperature at the National artificial insemination Centre (NAIC) Arusha. After air drying, a sample was reweighed to determine air-dried weight. After preparation, samples were sent to the Tanzania Veterinary Laboratory Agency (TVLA) in Dar- es Salaam for chemical composition analysis and Sokoine University of Agriculture (SUA) in Morogoro, Tanzania.
2.5. Laboratory Analysis of Feed
Feed samples were analyzed for chemical composition such as dry matter (DM), crude protein (CP), neutral detergent fibre (NDF), and acid detergent fibre (ADF) using the Near Infrared Spectroscopy (NIRS) method at the Tanzania Veterinary Laboratory Agency (TVLA) in Dar es Salaam, Tanzania as outlined by Corson et al. . In vitro dry matter digestibility (IVDMD) and in vitro organic matter digestibility (IVOMD) were assessed using the procedures of Tilley and Terry at Sokoine University of Agriculture (SUA) in Morogoro, Tanzania .
2.6. Manure Sampling Procedure
The standard procedure for sample collections was followed accordingly. For solid storage and the slurry management system, a sample of manure was scooped from four places within the heap and slurry pit, then mixed together to obtain a homogenous sample. Moreover, for the daily spread system, a sample of manure was taken directly from the cowshed within one day before field application, and for the anaerobic digester system, stored digested slurry was stirred first, and then the sample was collected. A sample weighing 250g was collected from each management system, placed into zip bags, and appropriately labelled. For safe transportation, each sample was labeled and stored in a cool box with an ice pack. Prior to laboratory analysis, samples were kept in a freezer to control microbial activity that could interfere with results.
2.7. Laboratory Analysis of Manure
The total solids and volatile solids were determined using the Official Methods of Analysis from AOAC International, 21st edition, 2019. Volatile solids were calculated by subtracting the weight of the inorganic sample from the dried sample and then dividing the result by the weight of the dried sample after ignition at 600°C, as described by APHA . Total carbon and total organic matter were assessed using the Walkley-Black method . The pH of the manure was measured with standard buffer solutions of pH 4.0 and 7.0, as per the guidelines from the American Society for Testing and Materials . Total nitrogen content was determined using the Kjeldahl method, while moisture levels were determined by drying the samples in an oven at 105°C for 24 hours. Manure composition parameters were analysed in order to observe the methane emission potential exhibited by manure from different manure management systems. These parameters were also analyzed to determine their association with feed type.
2.8. Methane Gas Emission Estimation
The emissions from the manure management system were calculated using the IPCC Tier 2 approach. The animal information data and manure management system were imported into the equation; default data from IPCC 2006, such as the maximum methane production capacity of manure (Bo), were also used due to the absence of country-specific data. The necessary data for calculating methane emissions included manure characteristics, such as the volatile solids (VS) produced per animal, whose proportion is converted into methane; maximum methane production capacity per volatile solids in the manure (Bo); the proportion of manure management system (MS); the specific manure management system; and the methane conversion factor (MCF) related to the temperature of the location as guided by IPCC . The study area had different temperatures, which resulted in different values of MCF applied to each management system. The MCF was 4% for solid storage in both urban and peri-urban, 0.5 for daily spread in both urban and peri-urban, 10% for anaerobic digester in both urban and peri-urban, 1% for composting in both peri-urban and urban, and for slurry it was 40.5% in peri-urban and 67.6% in urban. These variables were incorporated into the model. Due to the absence of country-specific data, the default values for IPCC (2006) for maximum methane producing capacity of manure (Bo) set as 0.13 m3 CH4/kg VS for dairy cattle, were used.
The equation (1)
CH4Emission/head/year=VS*365*Bo*0.67*∑s(MCF/100*MS)(1)
Where; CH4 emission = annual methane emission in kg per animal per year (kg CH4 animal-1 year-1), VS = daily volatile solid excreted per animal, 365 = conversion factor for calculating annual volatile solid, Bo = maximum methane producing capacity for manure(m3CH4 kg-1VS); 0.67=density of methane gas to convert from m3 to kg, MCF = methane conversion factor for manure management system by region (site) temperature; MS; fraction of manure handled in a management system in climate region. Daily volatile solid used for estimating methane was calculation according to the IPCC tier two 2006 equation. The volatile solid obtained from manure analysis were not used because they represent VS in manure not VS excreted by dairy cow per day which is required by equation for methane estimation.
The equation (2)
VS,=DMI*(1.04-DIETDI/100)*0.92(2)
Where:
VS = daily volatile solid excreted by animal kg VS·head-1·day-1
DMI, = daily feed intake per animal in, kg DM·head-1·day-1
DIEDI = average digestibility of feed
2.9. Statistical Analysis
All data were analysed using SPSS software version 26. Chi-square was used to analyse the manure management system distribution across the location and dairy herd structure. The analysis aimed to assess the association between the location and herd structure as well as the location and manure management system. One-way analysis of variance (ANOVA) was used to assess the significant difference in the nutritional composition of feed across the feed. The effect of the manure management system, type of feed and their interaction on the physical and chemical composition of manure and methane yield from different manure management systems was analyzed using the general linear model (GLM) procedure of SPSS. The GLM used type III sum of squares, where this mode allows fair comparison between groups for unbalanced data. The least significance difference (LSD) pairwise comparison was used to assess the mean difference between manure management systems, feed types, and their interaction. The variable was considered significant at (P<0.05).
3. Results and Discussions
3.1. Dairy Herd Structure
The dairy herd structure in the study sites revealed that there was significant difference in average herd size of lactating cows between peri-urban and urban areas, with urban areas having a greater mean number of lactating cows per household than peri-urban areas. Moreover, the mean number of heifers varied significantly, across Urban and Peri-urban areas, with the former having a greater mean number per household. There were no significant differences for the dry cows’ number between the two locations. Additionally, the mean number of calves in the urban area was larger than that in the peri-urban area, indicating a substantial difference in calves between the two locations.
Table 1. Dairy herd structure in study area.

Location

Dairy herd structure

Peri-urban (mean± SE)

Urban (mean± SE)

P- value

Lactating cows

2.02± 0.10

2.57± 0.21

0.0237

Heifers

0.32± 0.1

0.8± 0.1

0.0023

Dry cows

0.65± 0.3

0.86± 0.5

0.3671

Calves

0.69± 0.14

1.09± 0.14

0.0449

SE=standard error
3.2. Feed Type Nutritional Composition
The main feed resources in the study area were grasses, which include native grasses, which were dominant, and some improved pastures; crop residues, both cereals such as maize stovers, banana stems and leaves and beans straws, which were dominant; and concentrate, which is composed of maize bran, sunflower seed cake and cotton seed cake. The findings showed that there were significant differences in feed nutritional composition across the feed types. In comparison to grass and crop residue, concentrates were shown to contain higher levels of dry matter (DM) and crude protein (CP). The neutral detergent fibre (NDF) and acid detergent fibre (ADF) of crop residue were higher than those of grasses and concentrates. Concentrates also showed higher invitro dry matter digestibility (IVDMD) and invitro organic matter digestibility (IVOMD) than crop residues and grasses. Significant differences were observed at p<0.05.
Table 2. Nutritional composition of feed resources.

Nutritional composition

FEED TYPES

Grass (Mean ± SE)

Crop Residues (SE)

Concentrates (Mean ± SE)

(p-value)

DM

39.52 ± 3.2c

50.7 ± 4.2b

88.38 ± 0.2a

0.001

CP

4.50 ± 0.3c

6.07 ± 0.5b

12.91 ± 0.3a

0.001

NDF

56.33 ± 0.6c

61.63 ± 1.3b

29.34 ± 0.8a

0.001

ADF

31.71 ± 0.9c

37.83 ± 1.2b

13.69 ± 0.5a

0.001

IVDMD

58.82 ± 1.3c

51.45 ± 1.8b

79.25 ± 1.2a

0.001

IVOMD

54.69 ± 1.3c

44.41 ± 3.2b

78.99 ± 1.5a

0.001

DM=dry matter digestibility, CP=crude protein, NDF=Neutral detergent fibre, ADF=Acid detergent fibre, IVDMD=Invitro dry matter digestibility, IVOMD=Invitro organic matter digestibility, (a-c) Means with different superscript letters within a column differ significantly at (p<0.05).
3.3. Manure Management System
The manure management system indicated that solid storage was the predominant system among smallholder dairy farmers in both urban and peri-urban areas, with 25% and 18%, respectively, although the difference was not statistically significant (Table 3). Daily spreading was also a widely adopted practice, yet it was not statistically significant. Other systems, such as composting, slurry, and anaerobic digestion, were less frequently practiced.
Table 3. Manure management system in study area.

Manure management system

Location

Urban (n)

Peri-urban (n)

Total (N)

P-value

Solid storage

25

18

43

0.157

Daily spread

10

15

25

0.248

Composting

4

5

8

0.727

Slurry

4

4

9

1.00

Anaerobic digester

7

8

15

0.779

3.4. Effect of Manure Management Systems, Feed Type, and Interaction on Manure Composition and Methane Gas Emission
Manure composition and methane gas emissions were assessed in relation to feed type, manure management system, and their interplay (Table 4). The results demonstrated that both feed type and manure management system had a substantial impact on the composition, such as volatile solid (VS), moisture, total organic matter (TOM), and total carbon (TC), whereas feed type had a significant effect only on VS and TC. There were no interaction effects between feed type and manure management system on the composition of manure.
Table 4. Influence of manure management practice and feed type on manure composition.

Manure management systems

Feed type

P-value

Parameter

SS

DS

C

SL

AD

S. E. M

Grass+conc

Crop residues+conc

S. E. M

MMS

feed type

n

12

11

9

8

10

27

23

TS

26.379a

20.27b

25.83a

18.28bc

13.69

9.960

19.82

21.96

0.985

0.000

0.203

VS

15.882b

18.126b

13.846b

11.484b

10.49a

0.753

12.51a

15.621

0.111

0.007

0.027

pH

8.266b

7.952b

8.27b

7.279a

8.188b

0.079

7.91

8.083

0.079

0.002

0.226

Moisture

73.62b

79.731ab

74.168b

81.719ab

86.306a

0.985

80.18

78.039

0.985

0.000

0.203

TOM

18.518a

14.884ab

13.165ab

11.820b

12.813b

0.753

12.362

16.118

0.753

0.009

0.009

TC

10.742a

8.634ab

7.635b

6.856b

7.432b

0.436

7.17

9.349

0.436

0.019

0.059

TN

1.193

1.196

1.395

0.88

2.865

0.204

1.36

1.649

0.2045

0.054

0.504

In this table (a-e) Means with different superscript letters within a row differ significantly (p<0.05). SEM=Standard error of the mean, MMS=Manure management system, SS=solid storage, DS=daily spread, C=Composting, SL=slurry, AD=Anaerobic digester, TS=Total solid, VS=Volatile solid, TOM=total organic matter, Tc=Total carbon, TN=total nitrogen, Conc=concentrate
3.5. Methane Emission from Different Manure Management Systems
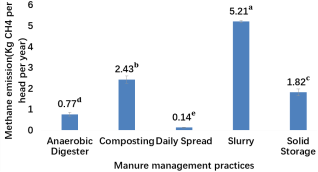
The findings in Figure 2 described the methane emission trend with the management system in the study area. The emissions trend was significant across the management system, where daily spread had a low emission of 0.14 kg methane/head per year, while slurry system exhibited a higher emission of 5.21 kg methane/head per year as compared to other management systems.
Figure 2. Methane gas emissions from different manure management systems among smallholder dairy farmers.
4. Discussions
4.1. Dairy Herd Structure
Smallholder dairy farmers at the household level exhibit varying herd structures of dairy cows in urban and peri-urban location. Urban farmers tend to have more lactating cows and heifers compared to their peri-urban counterparts. This disparity may be attributed to economic factors. Peri-urban farmers participate in farming activities as a supplement to dairy farming, which restricts the resources they can allocate to dairy production. In contrast, urban farmers primarily rely on dairy farming as their main source of income and engage in crop farming vegetables as supplement to dairy farming, allowing them to invest more resources in expanding their herd size. This finding is consistent with the study conducted in Ethiopia as reported by . Herd structure have different feed requirements, where the lactating dairy cows feed intake is higher which leads to higher manure production hence methane emission, while other groups have low feed intake due to less body requirements hence lower emission. Study by Huhtanen et al reported positive correlation between manure emission and feed intake .
4.2. Nutritional Composition of Feed Resources
Feed resources such as grasses, crop residues and concentrates exhibited significant differences in nutritional composition. The higher dry matter in concentrates than in both grasses and crop residues observed in this study could be attributed to the low moisture in concentrates while grasses and crop residue. The current study findings of 39% DM for grass and 88% for concentrates align with those reported findings for natural grasses and concentrate wheat bran, which were 38% and 89% DM respectively . The current study reported a higher CP of 12.9% for concentrates than crop residues and grasses. This could be due to the richness in nitrogen content as they consist of protein-rich ingredients such as sunflower seed cake and maize bran. The findings are in line with Mtengeti et al. who reported higher concentrate CP percentages ranging from 12 to 25 for maize bran and sunflower seed cake at different months of the year . Moreover, the current study observed a higher CP of 6.07% in crop residues than grasses (4.5%). This might be due to the inclusion of legume residues, which usually have high nitrogen content, hence increasing the CP% in crop residues. The finding aligns with the study by Bayissa and Kassahun, who reported CP content of 6% for crop residues , but they also reported a higher CP for grasses, which range from 8-12%. This value is higher than the current study finding (4.5%). The reason could be stage of harvest and management. The current study reported higher NDF of 61.63% and ADF of 37.83% for crop residues and a lower NDF of 56.33%, and ADF of 31.71% for grass. This probably could be due to higher fibre and lignin content present in crop residues compared to grasses. The study finding is in the range reported by Mukasafari et al. who reported NDF of 30.3 to 69.3% and ADF of 25.9 to 50.2 for crop residues, and NDF of 35.4-70.4%, and ADF of 21.5-45.5% for grasses . In contrast, concentrates are made from non-structured plant parts instead of seeds and byproducts of grains, which are naturally lower in fibre content, hence lower NDF and ADF.
The higher IVDMD and IVOMD in concentrates might be due to low fibre content, which facilitates digestibility, while the lower IVDMD and IVOMD in crop residues might be due to higher fibre content, which usually undergos maturity with time, hence lower digestibility. The current study observed an IVDMD of 58.8% in grass, lower than the 64.87% reported by other study , which may be due to a higher NDF value in the current study. Additionally, the current study observed an IVOMD of 54.69% for grasses and 44.41% for crop residues. The value for grasses is higher than the value reported by Mukasafari et al. who reported 31.8% to 37.6% for grasses, where crop residues align in the range of 31.3% to 46.1% .
Feed types occupy different nutritional compositions that relate to the manure chemical composition, which are the potential elements for methane emission when subjected to a management system that favors microbial activities . Feed with lower digestibility, such as crop residues, is not easily degraded by the animal and therefore retains more undegradable material in the faeces, resulting in higher methane emissions under anaerobic conditions . Conversely, manure from low-quality, high fiber can limit methanogenesis if it contains less nitrogen . In this context, feeding strategies can help mitigate emissions by minimizing degradable materials in manure that methanogenic microbes can digest.
4.3. Influence of Manure Management System and Feed Type on Manure Composition
The study revealed MMS and feed types significantly influenced manure composition, in particular, volatile solids, pH, total carbon, and moisture are the elements that are the key to methane emissions . The daily spread system showed higher VS of 89% compared to other manure management systems. This might be due to the presence of feed materials that are undigested in manure, which are not decomposed, or the presence of intact organic materials in manure. This value is higher than 54.05% volatile solid in DM . The difference in this value might be attributed to the feed type and quality. The AD system had the lowest VS of 10.49% due to microbial breakdown of organic materials occurring in anaerobic conditions, since digested materials contain less VS compared to the others. This is consistent with Sommer et al. who observed reduced methane emissions by 90% due to less volatile solids . Slurry exhibits a lower VS of 11% than DS and SS. This value is higher than the 2.4-2.95% VS reported by Zom and Groenestein,. The difference might be due to the variation in stages of degradation in the volatile solid at which the sample was collected for analysis. The lower pH of 7.28 for slurry may be due to a moisture content that favors microbes. The finding agrees with Cerón-Vivas et al. who reported a pH of 7 for the same management , while solid storage had a slightly higher pH of 8 due to the presence of aeration in a heap. This agrees with other study performed by other researcher for solid storage . A higher moisture content of 81.7% was observed in the slurry management system and a lower 73% in the SS system. This finding agrees with Hu et al. who reported a moisture content of 75% and 79% . Moreover, high total organic matter and total carbon were observed in solid storage and lowest in slurry and AD. This might be due to the less microbial decomposition in SS due to aerobic and semi-anaerobic in the inner part of this system and higher in slurry and AD . The finding is in line with the study by Larney et al. who reported total organic matter and total carbon range from 14-92% and 6.9-50% in fresh cattle manure, respectively .
Feed type also influences manure composition, where cows fed with crop residues plus concentrates produces manure with higher volatile solids than cows fed on grass with concentrates. The reason might be due to lower digestibility of crop residue, which retains a high undigested material in the feces . Moreover, a high total carbon of 9.35, corresponding to a C: N of 5.27 for grass plus concentrate diets and 5.67 for crop residue plus concentrate diets was observed. The reason might be lower digestibility, which may retain carbon in manure. The finding aligns with Külling et al. who reported a C: N ratio of 5-9 for fresh manure from grass-fed cows and, for hay-fed cows, C: N of 11-15 for stored manure . The difference could be due to the inclusion of concentrates and legumes in crop residues, which raises the nitrogen content in manure and lowers the C: N ratio.
4.4. Influence of Manure Management System on Methane Gas Emission
This study revealed that manure management systems influenced methane gas emissions, and significant variation in emissions across the management systems was observed at (P < 0.001). A higher methane emission of 5.21 kg CH4 head-1year-1 was observed in slurry management than the other. The reason might be due to the higher methane conversion factor of this system due to anaerobic conditions than other management systems. The system has a higher MCF due to conditions like moisture content, and readily degradable organic matter that favors methanogenesis through methanogenic microbes. These findings almost agree with the study reported a 5.48 kg CH4 per head per year . Composting had a higher emission of 2.4 kg CH4 per head per year than SS and DS but lower than slurry. This probably could be due to volatile solid manure despite the system having a lower methane conversion factor. The study finding is higher than the reported 0.27 kg CH4 per head per year . This difference might be attributed to the difference in volatile solids excreted in the manure attributed to lower feed digestibility. A study by Jiang et al. supported the emissions of this system, Its reported that, limited oxygen supply leads to methane production in composting systems . Low emission of 1.82 kg CH4 per head per year was observed from solid storage compared to slurry and composting. The reason could be the lowered methane conversion factor rather than the slurry system. Additionally, the emissions from solid storage could be attributed to limited oxygen supply, which limits microbial activities . The finding agrees with IPCC, where the value of less than 2 kg CH4 per head per year was reported for solid storage, . Similarly, Gupta et al. reported emissions of 0.8-3.3 kg per head per year, which is higher than IPCC estimates, but the range aligns with this study . The anaerobic digester system emitted 0.77 kg CH4 per head per year, which was higher than the daily spread. This could be due to a higher volatile solid which has the potential for methane emission. This figure is lower than 1.24 kg methane per head per year reported in Bangladesh . The difference could be due to variation in manure volatile solid content, which determine methane emission potential or different calculations approach. Study by Maldaner et al. also reported lower methane emissions from the AD system, though he did not highlight the figure . Lastly, the daily spread had low emissions compared to all the other management systems observed in the study. This is because the system exhibits a complete aerobic condition, which limits microbial activity, hence giving a lower methane conversion factor. This value is higher than 0.014 kg CH4 per head per year as reported by Million et al. . The difference could be due to higher volatile solids in manure attributed to feed type.
5. Conclusions and Recommendation
A significant variation in methane gas emissions was found across the manure management systems, with the highest emissions occurring in the slurry management system and the lowest in the daily spread system and anaerobic digester system. The study recommends the anaerobic digestion system rather than the daily spread system, even though daily spread exhibited lower emissions than the anaerobic digester. This is because, from the previous studies, anaerobic digester systems not only mitigate methane gas emissions but also optimize the value of manure, while daily spread leads to water pollution due to run off to water sources, hence causing waterborne diseases for both humans and animals. The study suggests controlled experiments on farms and on stations to determine the influence of manure management systems and feed types on methane.
Abbreviations

AD

Anaerobic Digester

ADF

Acid Detergent Fibre

ANOVA

Analysis of Variance

C

Composting

CH4

Methane

CONC

Concentrate

CP

Crude Protein

DIEDI

Diet Digestibility

DM

Dry Matter

DMI

Dry Matter Intake

DS

Daily Spread

GLM

General Linear Model

ILRI

International Livestock Research Institute

IPCC

Intergovernmental Panel on Climate Change

IVDMD

Invitro Dry Matter Digestibility

IVOMD

Invitro Organic Matter Digestibility

MCF

Methane Conversion Factor

MMS

Manure Management System

MST

Fraction of Manure to Be Managed in a Management System

NDF

Neutral Detergent Fibre

SE

Standard Error

SL

Slurry

SS

Solid Storage

SSA

In Sub-Saharan African

SUA

Sokoine Universirty of Agriculture

TALIRI

Tanzania Livestock Research Institute

TVLA

Tanzania Veterinary Laboratory Agency

VS

Volatile Solid

X2

Chi Square

Acknowledgments
The authors would want to express their profound gratitude to the Enviro-Cow Project for funding this research study.
Author Contributions
Sabina Dawite Haally: Conceptualization, Data curation, Investigation, Methodology, Visualization, Writing – original draft
David Dawson Maleko: Conceptualization, Methodology, Supervision, Validation, Writing – review & editing
Ismail Saidi Selemani: Conceptualization, Formal Analysis, Investigation, Methodology, Validation, Writing – review & editing
Eliamoni Titus Lyatuu: Visualization, Writing – review & editing
Raphael Mrode: Visualization, Writing – review & editing
Chang'a Edwin Peter: Writing – review & editing
Conflicts of Interest
The authors declare no conflicts of interest.
References
[1] Tedeschi, L. O., Abdalla, A. L., Alvarez, C., Anuga, S. W., Arango, J., Beauchemin, K. A.,. & Kebreab, E. (2022). Quantification of methane emitted by ruminants: a review of methods. Journal of Animal Science, 100(7), skac197.
[2] Rogelj, J., Den Elzen, M., Höhne, N., Fransen, T., Fekete, H., Winkler, H., Schaeffer, R., Sha, F., Riahi, K., and Meinshausen, M., 2016. Paris agreement climate proposals need a boost to keep warming well below 2 C. Nature 534, 631.
[3] YUE, X., and GAO, Q. (2018). Contributions of natural systems and human activity to greenhouse gas emissions. Advances in Climate Change Research, 9(4), 243-252.
[4] Scott, A., and Blanchard, R. (2021). The Role of Anaerobic Digestion in Reducing Dairy Farm Greenhouse Gas Emissions. Sustainability, 13(5), 2612.
[5] Khade, S. B., Khillare, R. S., and Dastagiri, M. B. (2021). Global livestock development: Policies and vision. The Indian Journal of Animal Sciences, 91(9), 770-779.
[6] Hakuzimana, J., Munyambonera, D. J., and de Dieu Habimana, J. (2021). The Carbon Footprint Of Smallholder Dairy Farming In Sub-Saharan Africa: A Review. International Journals of Sciences and High Technologies, 25(1), 476-506.
[7] Herrero, M., Henderson, B., Havlík, P., Thornton, P. K., Conant, R. T., Smith, P., Wirsenius, S., Hristov, A. N., Gerber, P., Gill, M., Butterbach-Bahl, K., Valin, H., Garnett, T., and Stehfest, E., (2016). Greenhouse gas mitigation potentials in the livestock sector. Nat. Clim. Chang. 6, 452-461.
[8] Batstone, D. J., Keller, J., Angelidaki, I., Kalyuzhnyi, S. V., Pavlostathis, S. G., Rozzi, A., Sanders, W. T. M., Siegrist, H., Vavilin, V. A., 2002. The IWA anaerobic digestion model no 1 (ADM1). Water Sci. Technol. 45, 65-73.
[9] Arikan, O. A., Mulbry, W., and Lansing, S. (2015). Effect of temperature on methane production from field-scale anaerobic digesters treating dairy manure. Waste Management, 43, 108-113.
[10] Ratnaningsih, Widyatmoko H and Yananto T (2009) The Potential of Biogas Formation in the Biodegradation Process of a Mixture of Fresh Organic Waste and Cow Manure in an Anaerobic Reactor Batch Trisakti University Journal 5 (1): 20-26.
[11] Gerber, P. J., Hristov, A. N., and Henderson, B. (2013). Technical options for the mitigation of direct methane and nitrous oxide emissions from. Animal: an international journal of animal bioscience, 7, (Suppl 2).
[12] Powers, W., Auvermann, B., Cole, N. A., Gooch, C., Grant, R., Hatfield, J., and Powell, J. M. (2014). Chapter 5: quantifying greenhouse gas sources and sinks in animal production systems. Quantifying greenhouse gas fluxes in agriculture and forestry: methods for entity-scale inventory. Technical Bulletin, (1939).
[13] Weisbjerg, M. R., Terkelsen, M., Hvelplund, T., Lund, P., and Madsen, J. (2019). Increased productivity in Tanzanian cattle is the main approach to reduce methane emission per unit of product. Tanzania Journal of Agricultural Sciences, 18(1).
[14] Wassie, S. E., Wilkes, A., Tadesse, M., Assefa, B., Abu, M., and Solomon, D. (2022). Enteric methane emission estimates for cattle in Ethiopia from 1994 to 2018. South African Journal of Animal Science, 52(3), 346-365.
[15] Feyissa, A. A., Senbeta, F., Tolera, A., Diriba, D., and Boonyanuwat, K. (2023). Enteric methane emission factors of smallholder dairy farming systems across intensification gradients in the central highlands of Ethiopia. Carbon Balance and Management, 18(1), 23.
[16] Kihupi, N. I., Tarimo, A. K., Masika, R. J., Boman, B., and Dick, W. A. (2015). Trend of growing season characteristics of semi-arid Arusha District in Tanzania. International Journal of Biology, 7(9), 45.
[17] Thadeo, S. M. (2014). Economics of urban households’ cooking fuel consumption in Arusha city, Tanzania (Doctoral dissertation, Sokoine University of Agriculture).
[18] Fausta J, M. (2008). Solid waste management in urban areas: the case of Arusha municipality, Tanzania (Doctoral dissertation, Kampala International University, College of engineering.
[19] Corson, D. C., Waghorn, G. C., Clark, D. A., and Lardner, R. M. (1999). Improving pasture production and quality in New Zealand dairy systems. Proc. N. Z. Grassland Assoc. 61, 45-50.
[20] Tilley, J. M. A., and Terry, R. A. (1963). A two-stage technique for the in vitro digestion of forage crops. J. Br. Grassl. Soc. 18, 104-111.
[21] American Public Health Association (APHA) (2017). Standard Methods for the Examination of Water and Wastewater, 23rd ed. APHA, Washington, DC, USA.
[22] Juo, A. S. R. (1979). Selected Methods for Soil and Plant Analysis. IITA Manual Series No. 1. International Institute of Tropical Agriculture (IITA), Ibadan, Nigeria.
[23] ASTM International (2017). ASTM D3174-12: Standard Test Method for Ash in the Analysis Sample of Coal and Coke from Coal. ASTM International, West Conshohocken, PA, USA.
[24] Intergovernmental Panel on Climate Change (IPCC) (2006). 2006 IPCC Guidelines for National Greenhouse Gas Inventories, Volume 4: Agriculture, Forestry and Other Land Use. IGES, Hayama, Japan. Available at:
[25] Berhe, A., Balehegn, M., Abera, S., Kiros, D., & Beyene, G. (2024). Assessment of GHG Emission from Dairy Cattle Manure Management Practices in Rural and Urban Dairy Production in Enderta District and Mekelle City, Northern Ethiopia. East African Journal of Veterinary and Animal Sciences, 8(1), 1-10. tainability and society, 7(1), 10.
[26] Gizaw, S., Abera, M., Muluye, M., Hoekstra, D., Gebremedhin, B., &Tegegne, A. (2016). Smallholder dairy farming systems in the highlands of Ethiopia: System-specific constraints and intervention options.
[27] Huhtanen, P., Krizsan, S. J., & Ramin, M. (2021). A meta?analysis of faecal output and nutrient composition, and potential methane emission from manure of dairy cows. Animal Feed Science and Technology, 282, 115120.
[28] Gashaw, M., & Defar, G. (2017). Livestock feed resources, nutritional value and their implication on animal productivity in mixed farming system in Gasera and Ginnir Districts, Bale Zone, Ethiopia. International Journal of Livestock Production, 8(2), 12-23.
[29] Mtengeti, E. J., Phiri, E. C. J. H., Urio, N. A., Mhando, D. G., Mvena, Z., Ryoba, R.,. & Reksen, O. (2008). Forage availability and its quality in the dry season on smallholder dairy farms in Tanzania. Acta Agriculturae Scand Section A, 58(4), 196-204.
[30] Bayissa, T., Belay, D., & Kassahun, D. (2022). Chemical composition of major livestock feed resources in the medium and low agroecological zones in the mixed farming system of Haru District, Ethiopia. Heliyon 8(2022) e09012.
[31] Mukasafari, M. A., Mutimura, M., Wredle, E., & Gonda, H. L. (2025). Nutritional quality of feed resources used by smallholder dairy farmers in the Northern Province of Rwanda. Tropical Animal Health and Production, 57(7), 301.
[32] IPCC. (2019). 2019 Refinement to the 2006 IPCC Guidelines for National Greenhouse Gas Inventories: Volume 4: Agriculture, Forestry and Other Land Use. Chapter 10: Emissions from Livestock and Manure Management.
[33] Møller, H. B., Moset, V., Brask, M., Weisbjerg, M. R., & Lund, P. (2011). Enteric and manure-derived methane and nitrogen emissions as well as metabolic energy losses in cows fed balanced diets based on maize, barley or grass hay. Journal of Dairy Science, 94(11), 5392-5403.
[34] Yohaness, M. T. (2010). Biogas potential from cow manure: (Master’s thesis). Swedish University of Agricultural Sciences, Uppsala, Sweden.
[35] Leitner, S., Ring, D., Wanyama, G. N., Korir, D., Pelster, D. E., Goopy, J. P.,. & Merbold, L. (2021) Effect of feeding practices and manure quality on CH4 and N2O emissions from uncovered cattle manure heaps in Kenya. Waste Management, 126, 209-220.
[36] Erebo, D. L. (2021). Biogas Production from Mixture of Fruit Peels Co-Digestion with Cattle Manure Under Anaerobic Condition. American Journal of Modern Energy, 7(6), 92-98.
[37] Sommer, S., Petersen, S. & Møller, H. Algorithms for calculating methane and nitrous oxide emissions from manure management. Nutrient Cycling in Agroecosystems 69, 143-154 (2004).
[38] Zom, R. L. G., & Groenestein, C. M. (2015). Excretion of volatile solids by livestock to calculate methane production from manure (TC-O_20). In RAMIRAN 2015: 16th International Conference Rural-Urban Symbiosis, proceedings. Hamburg, Germany.
[39] Cerón-Vivas, A., Cáceres, K. T., Rincón, A., & Cajigas, Á. A. (2019). Influence of pH and the C/N ratio on the biogas production of wastewater. Revista Facultad de Ingeniería Universidad de Antioquia, (92), 70-79.
[40] Hilgert, J. E., Amon, B., Amon, T., Belik, V., Dragoni, F., Ammon, C., and Herrmann, C. (2022). Methane emissions from livestock slurry: Effects of storage temperature and changes in chemical composition. Sustainability, 14(16), 9934.
[41] Budiyono, B., and Pratiwi, M. E. (2013). THE INFLUENCE OF FERMENTATION METHOD, FEED COMPOSITION, VARIATIONS IN THE INITIAL pH OF FERMENTATION AND FEED DILUTION TO THE BIOGAS PRODUCTION FROM VINASSE. Alchemy Jurnal Penelitian Kimia, 9(2).
[42] Hu, E., Sutitarnnontr, P., Tuller, M., and Jones, S. B. (2018). Modeling temperature and moisture dependent emissions of carbon dioxide and methane from drying dairy cow manure. Frontiers of Agricultural Science and Engineering, 5(2), 280-286.
[43] Amon, B., Kryvoruchko, V., Amon, T., and Zechmeister-Boltenstern, S. (2006). Methane, nitrous oxide and ammonia emissions during storage and after application of dairy cattle slurry and influence of slurry treatment. Agriculture, ecosystems & environment, 112(2-3), 153-162.
[44] Larney, F. J., Ellert, B. H., and Olson, A. F. (2005). Carbon, ash and organic matter relationships for feedlot manures and composts. Canadian journal of soil science, 85(2), 261-264.
[45] Appuhamy, J. A. D. R. N., Moraes, L. E., Wagner-Riddle, C., Casper, D. P., and Kebreab, E. (2018). Predicting manure volatile solid output of lactating dairy cows. Journal of Dairy Science, 101(2), 1513-1525.
[46] Külling, D. R., Menzi, H., Sutter, F., Lischer, P., and Kreuzer, M. (2003). Ammonia, nitrous oxide and methane emissions from differently stored dairy manure derived from grass-and hay-based rations. Nutrient Cycling in Agroecosystems, 65, 13-22.
[47] Million, T., Hailegabriel, A., Ulfina, G., Temesgen, J., Molla, S. F. W., and Zewdie, W. (2024). Status and management practices of cattle manure within commercial dairy Farms in selected sites of the central highlands of Ethiopia. LIVESTOCK RESEARCH RESULTS, 104.
[48] Jiang, T., Schuchardt, F., Li, G., Guo, R., and Zhao, Y. (2011). Effect of C/N ratio, aeration rate and moisture content on ammonia and greenhouse gas emission during the composting. Journal of Environmental Sciences, 23(10), 1754-1760.
[49] Gupta, P. K., Jha, A. K., Koul, S., Sharma, P., Pradhan, V., Gupta, V., Sharma, C., and Singh, N. (2007). Methane and nitrous oxide emission from bovine manure management practices in India. Environmental Pollution, 146(1), 219-224.
[50] Khanam, J. S., Huque, K. S., Huda, N., and Bashar, M. K. (2019). Management approach of livestock manure in present farming system of Bangladesh. Asian Journal of Medical and Biological Research, 5(1), 63-70.
[51] Maldaner, L., Wagner-Riddle, C., VanderZaag, A. C., Gordon, R., and Duke, C. (2018). Methane emissions from storage of digestate at a dairy manure biogas facility. Agricultural and forest meteorology, 258, 96-107.
Cite This Article
  • APA Style

    Haally, S. D., Maleko, D. D., Selemani, I. S., Lyatuu, E. T., Mrode, R., et al. (2026). Influence of Manure Management Practices on Methane Emissions in Smallholder Dairy System, Northern Tanzania. International Journal of Energy and Environmental Science, 11(4), 65-75. https://doi.org/10.11648/j.ijees.20261104.11

    Copy | Download

    ACS Style

    Haally, S. D.; Maleko, D. D.; Selemani, I. S.; Lyatuu, E. T.; Mrode, R., et al. Influence of Manure Management Practices on Methane Emissions in Smallholder Dairy System, Northern Tanzania. Int. J. Energy Environ. Sci. 2026, 11(4), 65-75. doi: 10.11648/j.ijees.20261104.11

    Copy | Download

    AMA Style

    Haally SD, Maleko DD, Selemani IS, Lyatuu ET, Mrode R, et al. Influence of Manure Management Practices on Methane Emissions in Smallholder Dairy System, Northern Tanzania. Int J Energy Environ Sci. 2026;11(4):65-75. doi: 10.11648/j.ijees.20261104.11

    Copy | Download

  • @article{10.11648/j.ijees.20261104.11,
      author = {Sabina Dawite Haally and David Dawson Maleko and Ismail Saidi Selemani and Eliamoni Titus Lyatuu and Raphael Mrode and Chang’a Edwin Peter},
      title = {Influence of Manure Management Practices on Methane Emissions in Smallholder Dairy System, Northern Tanzania},
      journal = {International Journal of Energy and Environmental Science},
      volume = {11},
      number = {4},
      pages = {65-75},
      doi = {10.11648/j.ijees.20261104.11},
      url = {https://doi.org/10.11648/j.ijees.20261104.11},
      eprint = {https://article.sciencepublishinggroup.com/pdf/10.11648.j.ijees.20261104.11},
      abstract = {The expansion of smallholder dairy farming in the developing countries is associated with an increase in manure production. However, the poor management of manure leads to an increase in methane gas emissions. This study was designed to evaluate methane gas emission from manure under different manure management practices in the smallholder dairy farms in Arusha City (urban) and Arusha District Council (peri-urban), Northern Tanzania. Data were collected through a semi- structured questionnaire, and the Intergovernmental Panel on Climate Change (IPCC) tier two methodology was used to estimate methane gas emissions from different manure management systems, including solid storage, daily spread, anaerobic digester, composting and slurry. Data on the dairy herds’ structure and the manure management system were analysed using Chi-square. The general linear model (GLM) of the statistical package of social sciences (SPSS) was used to estimate the effect of feed types and manure management systems on manure composition and methane gas emission from different management practices. The result revealed that there were significant differences in nutritional composition across feed types. There was a significant difference in dairy herd structure where urban farmers had more lactating cows, heifers and calves than those farmers in peri-urban areas. Furthermore, feed type significantly influenced manure composition, particularly volatile solids (VS) and total carbon (TC). Additionally, there were significant differences in manure composition across the manure management system in terms of volatile solids, pH, moisture, total organic matter, and total carbon. Methane gas emissions differed significantly across the manure management practices (P 4 head-1year-1 which was attributed to aerobic conditions that limit methane emission, while higher emission from other management systems was due to anaerobic conditions that facilitate emissions. In conclusion, a significant variation in methane emissions was found among the manure management systems, with the highest emissions occurring in the slurry management system and the lowest in the daily spread system. The study recommends the anaerobic digestion system than over daily spread system because previous studies showed that anaerobic digester system not only mitigates methane gas emissions among smallholder dairy farmers but also optimizes the value of manure, while daily spread leads to water pollution due to runoff to surface water resources, hence causing waterborne diseases to both humans and animal.},
     year = {2026}
    }
    

    Copy | Download

  • TY  - JOUR
    T1  - Influence of Manure Management Practices on Methane Emissions in Smallholder Dairy System, Northern Tanzania
    AU  - Sabina Dawite Haally
    AU  - David Dawson Maleko
    AU  - Ismail Saidi Selemani
    AU  - Eliamoni Titus Lyatuu
    AU  - Raphael Mrode
    AU  - Chang’a Edwin Peter
    Y1  - 2026/07/22
    PY  - 2026
    N1  - https://doi.org/10.11648/j.ijees.20261104.11
    DO  - 10.11648/j.ijees.20261104.11
    T2  - International Journal of Energy and Environmental Science
    JF  - International Journal of Energy and Environmental Science
    JO  - International Journal of Energy and Environmental Science
    SP  - 65
    EP  - 75
    PB  - Science Publishing Group
    SN  - 2578-9546
    UR  - https://doi.org/10.11648/j.ijees.20261104.11
    AB  - The expansion of smallholder dairy farming in the developing countries is associated with an increase in manure production. However, the poor management of manure leads to an increase in methane gas emissions. This study was designed to evaluate methane gas emission from manure under different manure management practices in the smallholder dairy farms in Arusha City (urban) and Arusha District Council (peri-urban), Northern Tanzania. Data were collected through a semi- structured questionnaire, and the Intergovernmental Panel on Climate Change (IPCC) tier two methodology was used to estimate methane gas emissions from different manure management systems, including solid storage, daily spread, anaerobic digester, composting and slurry. Data on the dairy herds’ structure and the manure management system were analysed using Chi-square. The general linear model (GLM) of the statistical package of social sciences (SPSS) was used to estimate the effect of feed types and manure management systems on manure composition and methane gas emission from different management practices. The result revealed that there were significant differences in nutritional composition across feed types. There was a significant difference in dairy herd structure where urban farmers had more lactating cows, heifers and calves than those farmers in peri-urban areas. Furthermore, feed type significantly influenced manure composition, particularly volatile solids (VS) and total carbon (TC). Additionally, there were significant differences in manure composition across the manure management system in terms of volatile solids, pH, moisture, total organic matter, and total carbon. Methane gas emissions differed significantly across the manure management practices (P 4 head-1year-1 which was attributed to aerobic conditions that limit methane emission, while higher emission from other management systems was due to anaerobic conditions that facilitate emissions. In conclusion, a significant variation in methane emissions was found among the manure management systems, with the highest emissions occurring in the slurry management system and the lowest in the daily spread system. The study recommends the anaerobic digestion system than over daily spread system because previous studies showed that anaerobic digester system not only mitigates methane gas emissions among smallholder dairy farmers but also optimizes the value of manure, while daily spread leads to water pollution due to runoff to surface water resources, hence causing waterborne diseases to both humans and animal.
    VL  - 11
    IS  - 4
    ER  - 

    Copy | Download

Author Information
  • Department of Animal, Aquaculture and Range Sciences, Sokoine University of Agriculture, Morogoro, Tanzania;Department of Research and Innovation Technology, Tanzania Livestock Research Institute (TALIRI), Mbeya, Tanzania

  • Department of Animal, Aquaculture and Range Sciences, Sokoine University of Agriculture, Morogoro, Tanzania

  • Department of Animal, Aquaculture and Range Sciences, Sokoine University of Agriculture, Morogoro, Tanzania

  • Department of Livestock Genetics, Nutrition and Feed Resources, International Livestock Research Institute (ILRI), Dar es Salaam, Tanzania

  • Department of Livestock Genetics, Nutrition and Feed Resources, International Livestock Research Institute (ILRI), Nairobi, Kenya

  • Department of Research and Innovation Technology, Tanzania Livestock Research Institute (TALIRI), Mbeya, Tanzania

  • Abstract
  • Keywords
  • Document Sections

    1. 1. Introduction
    2. 2. Materials and Methods
    3. 3. Results and Discussions
    4. 4. Discussions
    5. 5. Conclusions and Recommendation
    Show Full Outline
  • Abbreviations
  • Acknowledgments
  • Author Contributions
  • Conflicts of Interest
  • References
  • Cite This Article
  • Author Information