Review Article | | Peer-Reviewed

Unlocking Peru's Potential for Carbon Neutrality: Overcoming Challenges and Seizing Opportunities

Received: 25 April 2026     Accepted: 27 May 2026     Published: 24 August 2026
Views:       Downloads:
Abstract

Peru's transition towards carbon neutrality is both a critical environmental need and a complex challenge. As one of the most climate-vulnerable countries in Latin America, Peru faces mounting pressure to reduce greenhouse gas (GHG) emissions while maintaining economic growth and energy security. This study examines the current state of Peru's energy transition and analyzes the principal sources of national emissions, with particular emphasis on the land-use, land-use change, and forestry (LULUCF) sector, which is the country's largest contributor to GHG emissions. The research is based on a comprehensive review of national climate policies, nationally determined contributions (NDCs), government strategies, and institutional reports from international organizations on decarbonization. The study evaluates the main mitigation pathways proposed to achieve Peru's climate targets, including expanding renewable energy technologies, electrifying the transport sector, improving energy efficiency, and enhancing land-use management practices. Particular attention is given to the role of climate finance and institutional coordination, drawing on recommendations from the Inter-American Development Bank (IDB), the Ministry of Environment (MINAM), and other stakeholders involved in Peru's low-carbon transition. The analysis demonstrates that, although Peru possesses significant renewable energy potential, mainly wind and solar, and strategic opportunities for sustainable growth, achieving a 40% reduction in GHG emissions by 2030, over its 60 mitigation measures, and carbon neutrality by 2050 will require substantial investment, technological innovation, stronger governance frameworks, and long-term policy stability. The findings highlight that the success of Peru's decarbonization pathway will depend not only on technological deployment but also on effective policy implementation, cross-sectoral collaboration, and sustained financial support. This study contributes to the understanding of Peru's energy transition challenges and provides insights for strengthening climate policy and advancing a resilient, low-carbon future.

Published in International Journal of Energy and Environmental Science (Volume 11, Issue 4)
DOI 10.11648/j.ijees.20261104.14
Page(s) 106-124
Creative Commons

This is an Open Access article, distributed under the terms of the Creative Commons Attribution 4.0 International License (http://creativecommons.org/licenses/by/4.0/), which permits unrestricted use, distribution and reproduction in any medium or format, provided the original work is properly cited.

Copyright

Copyright © The Author(s), 2026. Published by Science Publishing Group

Keywords

Energy Policies, Greenhouse Gases, Renewable Energy, Energy Transition, Decarbonization

1. Introduction
Climate change requires that humans control their behaviour. Transformative activities from fossil fuels to sustainable energy sources are needed to guarantee a transition that mitigates environmental degradation, fosters resilience and strengthens justice. In response to this complication, in 2015, governments decided to implement their Nationally Determined Contributions (NDCs) to decarbonize the country by the middle of the century and progressively improve them through more stringent mechanisms. Peru is not blind to this reality and has proposed a set of targets to reduce GHG emissions by 40% by 2030 and to fully decarbonize by 2050; however, the paths to achieve these targets are unclear, which is why the Climate Action Tracker has qualified Peruvian climate targets overall as "insufficient".
Peru's current energy mix depends heavily on fossil fuels. Despite deploying clean energy resources to reach local and global goals, barriers persist, reducing the country's ability to achieve an effective and sustainable transition. This research provides insights for a low-carbon future in the context of climate change. Additionally, it examines difficulties, especially regarding financial access to the sixty-three measures outlined in the updated NDC plan of 2023, as reported by the International Development Bank and the Energy Ministry. Furthermore, the significant potential of renewable energy, new policy frameworks, and emerging technologies have been emphasized.
2. Overview of Emissions and Climate Policy
2.1. Carbon Emissions Around the World
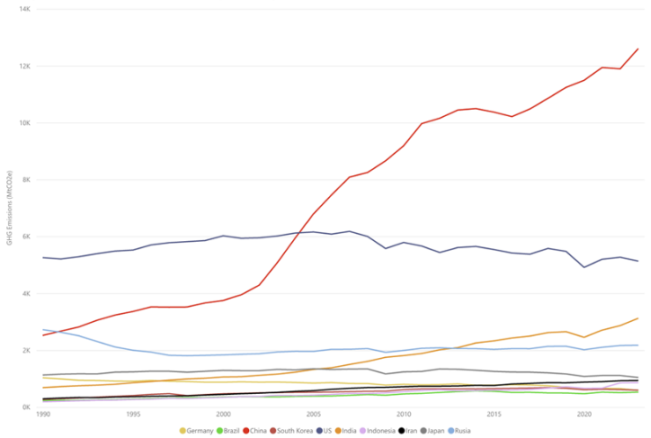
At the end of 2023, 40,417.9 million tons of carbon dioxide equivalent (MtCO2e) had been emitted. Asia is the main region which accounted for almost 52% of these emissions, with China, the largest pollutant (12,603.5 MtCO2e), followed by India, Japan, and Indonesia (5,021.6 MtCO2e). The second group comprises Europe, the CIS, and the Middle East, with Germany, Russia, and Iran having the highest values in each region. On the other hand, North America and South and Central America (S&C America) had the lowest values globally (4.4% and 4%, respectively). Notably, the US share has reached 81.5%, making it the second-largest emitter globally after China (5,130.1 MtCO2e). In contrast, Brazil produced 525 MtCO2e, making it the second-largest emitter in South and Central America, after Argentina (Figure 1).
Figure 1. Global CO2 emissions. Source: .
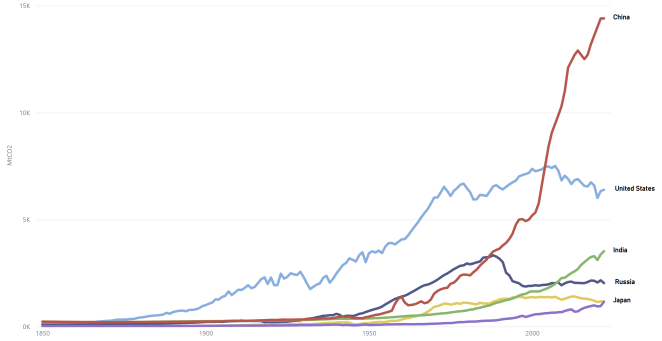
Regarding CO2 emissions from the Industrial Revolution until 1886 (Figure 2), the UK was the first global emitter, reaching 321.1 MtCO2 that year. In 1887, for the first time, the US became the top emitter, driven by industrialization and population growth . Nonetheless, events such as World War I and the Great Depression temporarily altered this trend. Europe, Russia, and Canada also experienced rapid growth until the 1980s, while the UK showed stabilization. During the 20th century, the US. continued to dominate emissions worldwide, but emerging Asian countries, such as China, began to appear on the landscape. The start of the 21st century (2005) was remarkable because it marked China's economic expansion and its emergence as a top CO2 emitter, almost doubling the US value (12,000 MtCO2 vs 5,080 MtCO2).
There is a heated debate in community science regarding who is responsible for reducing emissions; in this regard, indicators are proposed to, in some sense, compare and assign compromises to reduce emissions . Emissions per person, for example, are often recognized as a fairer metric for comparing countries . Five main groups can be highlighted: countries such as the US, Canada, Russia, Australia, China, and Saudi Arabia have higher per capita CO2 emissions in 2022 (more than 10 tons per person); in contrast, many European countries, China, Iran, Japan, and South Africa presented medium to high values (between 5–10 tons per person). Mexico, Chile, and Argentina in Latin America; France and the UK in Europe; and in Asia, Uzbekistan, Indonesia, and Thailand are the prominent representatives that experienced (between 2–5 tons per person). Medium to lower values of this metric (1–2 tons per person) are found in some Latin American countries, such as Peru, Colombia, and Costa Rica. Most African countries, Asian countries (Pakistan, Myanmar, Nepal, and Sri Lanka), Vanuatu in Oceania, and Haiti in Central America have per capita emissions of less than 1 ton per person. Bahrain, Brunei, and the United Arab Emirates have the highest per-capita emissions globally, measured in tons per person.
Figure 2. Global historical emissions. Source:.
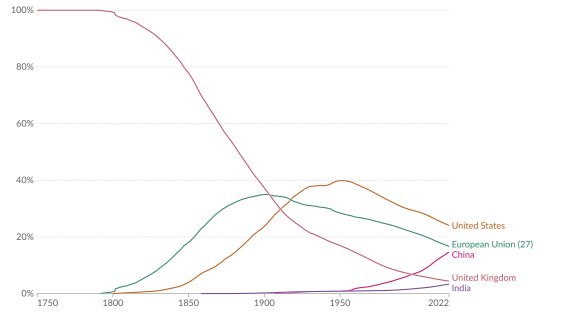
Notably, more prosperous countries with higher per-capita emissions are listed above; consequently, the association with wealth is not entirely incorrect. This is exemplified by Chancel, who reported that the top 10% of emitters in a given region pollute more than the rest of the region . However, complemented by other metrics, those who need to take further action or have the responsibility to reduce emissions to meet the global temperature goal. For instance, cumulative emissions are frequently used as a metric for assessing countries' roles. Furthermore, researchers have concluded that global temperatures are correlated with a proportional climate response to cumulative emissions . Figure 3 shows the United States' most significant cumulative response, followed by the European Union and China.
Figure 3. Share of global cumulative CO2 emissions. Source:.
2.2. Peruvian Carbon Emissions
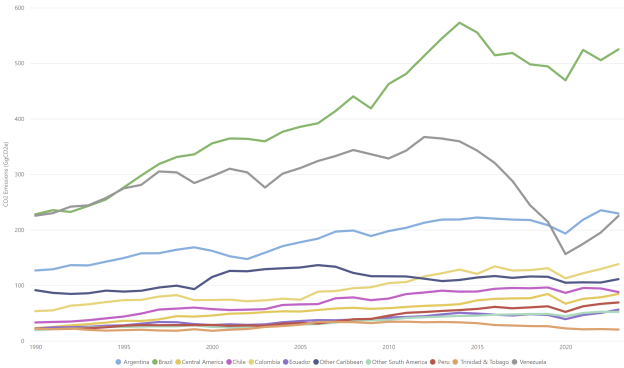
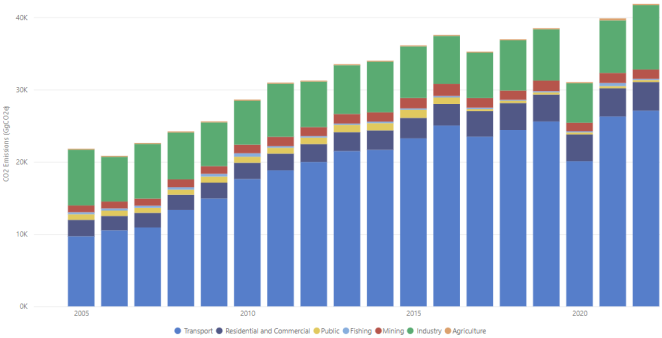
In 2023, Peruvian emissions reached 69.2 MtCO2e, accounting for 0.2% of the regional share, one of South America's lowest values (Figure 4). This growth was 212.1% in 1990 and 3.9% in 2022, respectively. Carbon dioxide (CO2) emissions in 2022, depicted by the National Energy Balances, totaled 41,858.2 Gigagrams of CO2 (GgCO2), representing a 7.7% increase from 2021 . Despite the introduction of new fuels (e.g., gasohol), the transport sector has remained the most polluting since 2005; however, in 2020, emissions were affected by the COVID-19 pandemic. Road transport has been the leading emitter in this sector due to the intensive use of diesel and LPG, with values of 15,677.8 GgCO2 and 2185.7 GgCO2, respectively. Significantly, programs related to natural gas (NG) vehicle conversion have increased the utilization of this fuel in the last decade.
Figure 4. CO2 emissions in Central and South America. Source:.
Turbo produced 830.8 GgCO2 in air transport, whereas maritime and rail reached approximately 463.3 GgCO2, mainly due to their dependence on diesel and motor gasoline. Industry is the second-largest emitter, accounting for more than 21% of the total. Households and mining experienced intermediate values, producing 3,958.8 GgCO2 and 1,298.5 GgCO2, respectively. The remaining sectors, such as public, fishing, and agriculture, have values below 1%. In agriculture, emissions remained stable until 2020. Nonetheless, in 2021, emissions doubled from the 2020 level, reaching 278.3 GgCO2 (Figure 5).
Figure 5. CO2 emissions by sector in Peru. Source:.
According to the IPCC guidelines, emissions are categorized into the following sectors: (i) energy (stationary and mobile combustion), (ii) industrial processes and product use (PIUP), (iii) waste (solid waste and sewage), (iv) land use, land-use change, forestry (LULUCF), and agriculture . These emissions are reported in the National Inventory of GHG and the GHG Sectoral Report .
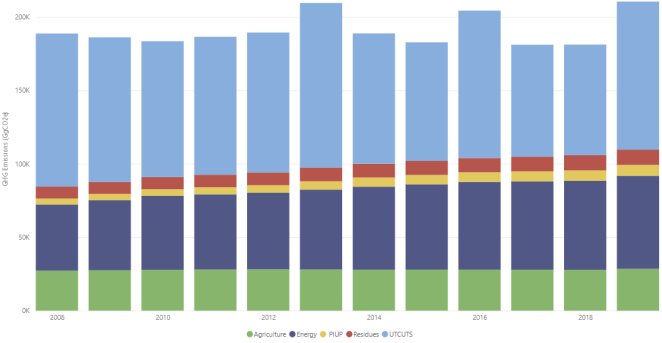
In 2019, the country’s net emissions were 210,404.42 GgCO2e, distributed among CO2, CH4, N2O and HFC (159,395.34 GgCO2e of CO2, 39,014.02 GgCH4, 11,085.16 GgN2O, and 909.91 GgHFC). The largest CO2 emissions are from LULUCF, whereas agricultural activities, including livestock production, generate the highest CH4 and N2O emissions. HFC emissions correspond entirely to their use in refrigeration and air conditioning, which are quantified in the PIUP sector.
Regarding the distribution of net emissions by sector, the LULUCF sector is the leading emitter, accounting for 47.90% of the country's total GHG emissions at 100,794.05 GgCO2e. In this sector, the primary emission source is subcategory 3B2 Cropland, at 62,542.20 GgCO2e. Within this total, 62,555.94 GgCO2e emanates from converting forestland and pastures to crops, whereas -13.74 GgCO2e represents removal resulting from changes in carbon stocks within the living biomass reservoir. The second-largest contributor to GHG emissions is the energy sector, accounting for 63,238.17 GgCO2e, or 30.06% of the country's net emissions. Within this sector, the transport subcategory is the primary source of emissions, accounting for 25,646.28 GgCO2e.
Together, the LULUCF and energy sectors accounted for 77.96% of Peru's total GHG emissions in 2019. Agriculture contributed 28,478.34 GgCO2e, accounting for 13.54% of the total emissions. Waste accounted for 10,418.38 GgCO2e (4.95%), and PIUP contributed 7,475.47 GgCO2e (3.55%). Figure 6 shows the evolution of emissions from 2008 to 2019.
Figure 6. GHG emissions reported by INGEI. Source: .
2.3. The Peruvian Climate Policy
In September 2015, Peru presented its Intended Nationally Determined Contribution (iNDC) to the United Nations Summit on Sustainable Development. The country contemplates an unconditional 20% reduction in GHG emissions relative to the GHG emissions projected for 2030 under a business-as-usual (BaU) scenario. It considers a conditional scenario with an additional 10% reduction in emissions, contingent upon the availability of external financing and favorable conditions . In 2016, Peru ratified the Paris Agreement and reaffirmed its commitment to the iNDCs (through Supreme Decree N° 058-2016-RE), which became Peru's NDCs. In this document, emissions for 2030 are stated at 298.3 MtCO2e, accompanied by a reduction of 89.4 MtCO2e, representing a 30% decrease relative to 1990 levels. Currently, these commitments have been updated, and the government undertakes that GHGs will not exceed 208.8 MtCO2e by 2030 under the unconditional target, reaching a maximum of 179.0 MtCO2e as soon as conditions for foreign external financing and favourable circumstances are me which is known as the conditional goal . However, the process involved a series of stages and simultaneously required the participation of numerous individuals.
This section provides a comprehensive overview of the key documents, actions, and events related to managing global climate change and environmental issues, with a specific focus on the Peruvian context.
In 1992, at the Earth Summit held in Rio de Janeiro, Peru signed the United Nations Framework Convention on Climate Change (UNFCCC), adopting it through legislative Resolution No. 26185 . Three years later, the first Conference of the Parties (COP) occurred in Berlin. In 2001, Peru presented its First National Communication on Climate Change, and a year later, it ratified the Kyoto Protocol (DS 080-2002-RE). COP 15, held in Copenhagen, had as its main milestone the mobilization of large sums of money to reduce the effects of climate change. At COP 20 in Lima in 2014, the "Lima Call for Climate Action" was adopted to recognize adaptation measures in the presentation of NDCs and to propose a new negotiating document for the next COP. At COP21 in Paris, the Paris Agreement was adopted to address global warming, with the goal of keeping the global average temperature below 2°C above preindustrial levels. The agreement also emphasizes efforts to limit this increase to 1.5°C. Meanwhile, Peru submitted its Intended Nationally Determined Contributions (iNDCs) to the UNFCCC.
At the local level, the Ministry of the Environment (MINAM) was established in 2008 and is responsible for the National Commission on Climate Change. A year later, the National Environmental Policy was approved; this was the first mechanism to incentivize the implementation of mitigation measures and GHG management . The National Environmental Action Plan (PLANAA) 2011-2021, approved by DS 014-2011-MINAM, has emerged as a long-term national planning instrument that sets out an environmental vision for 2021. The goal is to reduce deforestation from 54 million hectares to zero . The National Climate Change Strategy (ENCC) was introduced in 2003 and was updated in 2015. It was approved by DS 011-2015-MINAM, which directs Peru's efforts to combat climate change in a comprehensive, transversal, and multisectoral manner, with a 2021 vision . This strategy provides guidelines to public institutions, economic agents, and citizens. They aimed to design and implement actions for low-carbon, climate-resilient development. In addition, four key implementation approaches have been established: institutional strengthening and governance, stakeholder education and training, research on climate change and technological development, and financing .
One of the most important milestones was the enactment of the Framework Law on Climate Change, approved by Law No. 30754, on April 17, 2018, which was intended to reduce the country's vulnerability through principles and approaches and the dissemination of public policies for the management of climate change adaptation and mitigation measures . Table 1 illustrates the country's most critical documents and laws over time, which have aimed to establish strategies and create a framework for addressing climate change (Table 1).
Table 1. The most important Peruvian climate Documents/Law.

Document-Law

Year

Objective

First Communication on Climate Change

2001

Report greenhouse gas (GHG) emissions and vulnerabilities across various sectors.

National Climate Change Strategy

2003

Reduce the impacts of Climate Change through vulnerability and emission control programs.

National Environmental Policy

2009

Through DS-012-2009-MINAM, environmental planning included sectoral, regional, and local policies.

General Environmental Law

2009

Law N° 28611 proposes basic rules and principles to ensure a healthy, balanced, and adequate environment.

Climate Change Adaptation and Mitigation Action Plan (PAAMCC)

2010

Proposal of MINAM plans to combat Climate Change in the short and medium term.

Second National Communication on Climate Change

2010

Show the Inventory of emissions, mitigation, and adaptation policies and strategies that the country must follow to address climate change.

National Environmental Action Plan 2011-2021 (PLANAA)

2011

DS-014-2011-MINAM proposes a long-term plan for environmental aspects and priority actions, including the goals to be achieved by 2021.

Risk Management and Climate Change Adaptation Plan in the Agricultural Sector (2012-2021)

2012

Through RM No. 265-2012-AG, strategies, policies, proposals and actions for risk reduction and adaptation measures in the agricultural sector are provided.

Third National Communication on Climate Change

2013

Improve and develop national capacities for incorporating Climate Change into the country's overall scope.

Framework Law on Climate Change (Law No. 30754)

2018

Reduce the country's vulnerability to climate change, capitalize on low-carbon growth opportunities, and fulfil the government's international commitments under the UNFCCC.

Communication Strategy for our Climate Challenge (NDC) 2021-2025

2021

Contribute to understanding the "Our Climate Challenge" to modify society's behaviour in favour of climate action.

Peru's National Adaptation Plan

2021

To guide climate change adaptation planning, increase adaptive capacity and enable opportunities for improvement.

NDC Update Report to the UNFCCC

2021

Announce the increase in ambition to reduce GHG emissions from 30% to 40% by 2030.

Source:
3. Energy Transition Pathways with Profound Revolution
3.1. Status and Challenges
In 2023, the government proposed a second biennial update to achieve its objectives by 2030. In this report, 63 mitigation activities are proposed to achieve the emission targets shown in Table 2. These actions aim to reduce approximately 71,248 MtCO2e, strongly focused on the energy sector. More than half concentrate on stationery and mobile combustion, indicating that particular attention has been given to electricity generation, fuel extraction, and use in the manufacturing and construction industries, as well as in transport. In this article, the initial letter E identifies the energy measures, which have a total potential reduction of 16,936 MtCO2e by 2030. Within this sector, the stationary measures include the first 24 activities. E1 is the most important measure, and renewable energy can cut emissions by 5.3%.
Furthermore, the stationary measures included can be divided into three main groups: i) renewable energy, ii) energy efficiency, and iii) fuel change. The other 14 measures focused on promoting energy efficiency and improving the quality of public and private transport. By replacing polluting fuels such as diesel and gasoline with electricity or natural gas, and by upgrading rail infrastructure, the government aims to enhance domestic transportation.
In the PIUP sector, the updated plan includes two measures to decarbonize heavy industries, including iron, steel, and cement. These measures could reduce 1,833 MtCO2e by 2030. The agricultural sector has focused primarily on sustainable and quality production; the six mitigation measures can be grouped into three main emission reduction groups: i) livestock, ii) rice cultivation, and iii) permanent crops. These activities represent those with the greatest potential in this sector. However, consolidating institutional frameworks, information production, and capacity-building efforts still requires improvement. The government has dictated six measures in the LULUCF sector to reduce carbon emissions by 2030. These measures focus on forest management due to significant greenhouse gas (GHG) emissions. The primary subcategories of GHG emissions within the LULUCF sector include conversion of forestland to agricultural land, forest management activities, and conversion of forestland to grassland. Mitigation actions proposed conservation, management, sequestration and reforestation, among others. The potential of these measures is almost four times that of the transport sector and accounts for more than three-fifths of the sector's total contribution, at 44,990 MtCO2e.
On the other hand, the waste sector seeks to attack two principal areas: i) waste disposal and ii) wastewater treatment. The first aims to close gaps in final solid waste disposal and to recover municipal solid waste through composting. In addition to the potential to generate electricity from biogas produced in landfills, four mitigation actions aim to reduce 0.588 MtCO2e by 2030. The second aim was to reduce the amount of CO2 released when water dissolves organic matter. Four strategies with a mitigation potential of 0.360 MtCO2e were proposed.
Despite the government's proposed mitigation measures, the conditions necessary to maximize their potential remain inadequate. These include the regulatory, technological, and economic capacities of institutions, information, and societal involvement. While support for normative frameworks has been identified as lacking across all sectors, people's participation is also essential to achieving the 2030 objectives. Ultimately, people's acceptability serves as a solid check on government mandates . Regarding economics, investments in technology and infrastructure are necessary, along with the capacity to operate and maintain the measures outlined in Table 2. Finally, strengthening professional capacities can facilitate the operation and wastewater treatment plants (WWTPs) maintenance and inspections of sanitation facilities.
Table 2. Conditions necessary to maximize the effects of mitigation measures.

Challenges

Energy

Industry

Agriculture

LULUCF

Residues

Regulatory

X

X

X

X

X

Technological

X

X

X

X

Economical

X

X

Institutional Capacity

X

X

X

X

Information production

X

X

X

Inclusion of society/market

X

X

3.2. Energy Transition Pathways
In 2021, to support the Peruvian Climate Change National Strategy (CCNS), the Peruvian Government, the International Development Bank (IDB), the Environmental Ministry (MINAM), and other institutions developed a study to achieve carbon neutrality by 2050, which depicts the benefits and costs of the constructed pathways. The methodology was based on robust decision-makers and close collaboration with stakeholders. The analysis consisted of utilizing many sectoral models to characterize different sectors through 2 development scenarios: i) the baseline scenario, and ii) the carbon neutrality scenario and comparing them. To construct these scenarios, assumptions about population growth and the economy were used, with average annual increases of 0.5% and 3.6%, respectively.
The baseline scenario follows historical trends and does not account for the 2015 NDC or any additional measures implemented after 2018. The assumptions considered in this scenario are presented in Table 3.
Table 3. Assumptions considered in the path to 2050.

Sector

Assumptions

Energy

Low penetration of renewable energies.

Hydroelectric and fossil-base plants installations.

A limited number of wind and solar plants.

Transport

Constant fossil fuel consumption.

Maintains the fleet of IC vehicles and does not encourage non-motorized mobility

AFOLU

Increased deforestation and livestock.

No promotion of sustainable forest management concessions, and the number of concessions granted remains unchanged.

Lack of logistical support for agricultural producers.

Residues

The volume of untreated solid waste increases in proportion to the country's population, and no action is taken to increase wastewater treatment, which also increases with population growth.

PIUP

Industrial effluents also rise with the country's economic growth, which in turn increases sectoral emissions.

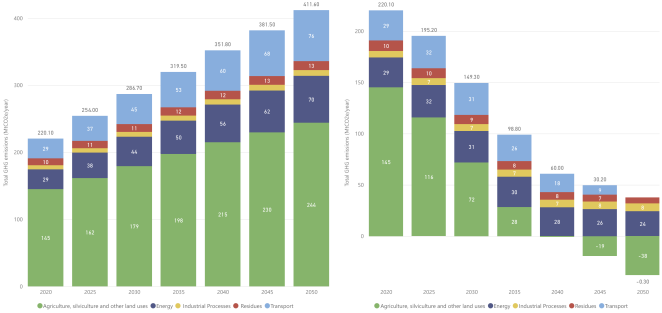
Under these assumptions, this study aimed to achieve carbon neutrality by 2050. Passing from 220.1 MtCO2e in 2020 to non-emissions in 2050, the most significant savings are achieved in the AFOLU sector; however, if actions are not taken, emissions will reach 411.6 MtCO2e in 2050 (Figure 9). Compared with the baseline scenario, transport activities potentially reach the second most significant reduction in GHG emissions by 2050, with almost 76 MtCO2e. The energy, waste, and PIUP sectors collaborate to achieve carbon neutrality, aiming to collectively reduce approximately 55 MtCO2e by 2050 (Figure 7).
Figure 7. Annual emissions in the baseline (left) and carbon neutrality (right) scenarios. Source:.
From an economic standpoint, implementing carbon-neutrality activities is projected to yield net benefits of 139.5 million US dollars. The most important contributor to expenses is the transport sector, accounting for approximately 66% of the proposed budget, fortifying efforts to achieve carbon neutrality.
3.2.1. Different Sectors I: Energy and Transportation
The sectoral analysis was performed using the assumptions outlined above and across three timeframes: short-term (2021-2025), medium-term (2026-2035), and long-term (2036-2050).
Energy
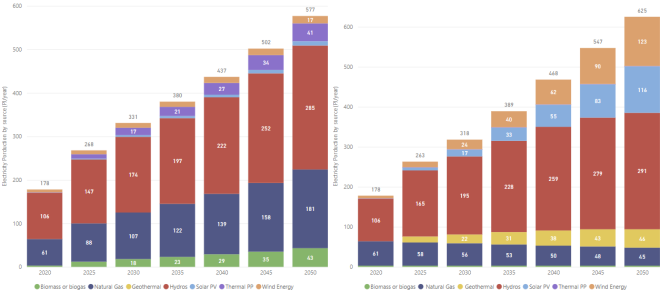
In the short term, electricity production from renewable sources (geothermal, wind, hydro, and solar) is expected to increase from 65% to 77% between 2020 and 2025. The biomass production remained constant. Notably, electricity production from thermoelectric plants was reduced by 3 PJ relative to the estimated 2020 levels. In addition, owing to lowered domestic consumption, oil and gas exports increase slightly over time. In the medium term, electricity production from renewable sources is expected to increase to 84%, with greater generation from wind and solar plants, as well as from small-scale hydroelectric plants already planned (up to 100 MW, with a water edge to avoid large reservoirs). Non-conventional renewable plants are often operated in conjunction with battery energy storage.
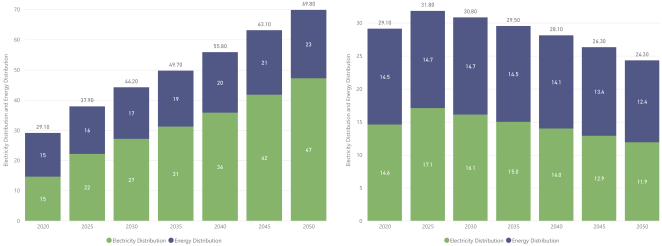
Figure 8. Electric mix evolution in the baseline (left) and carbon neutrality (right) scenarios. Source: .
Moreover, 100% of large-scale non-conventional renewable energy sources are considered to have energy storage, and 50% of rooftop solar plants also utilize this technology. Production from thermal plants is expected to match current values, and electricity production from natural gas is reduced to 8 PJ. In the long term, the proportion of electricity produced from solar and wind energy was 90%. In addition, rooftop solar energy is growing faster than large-scale solar energy, mainly owing to declining costs and reduced installation space (Figure 8).
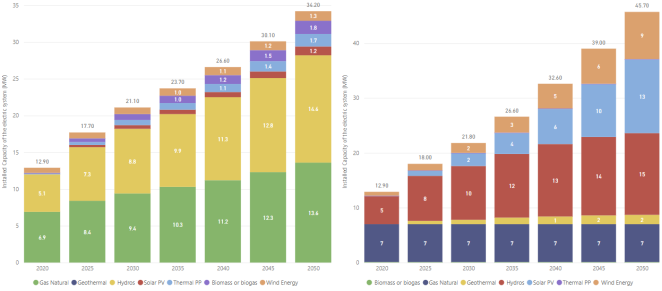
Regarding the installed capacity of the plants, in the carbon-neutrality scenario, there is no short-term change, or any change is limited. An increase of 5.1 GW of renewables (3.1 GW of hydroelectric, 1.4 GW of non-conventional renewables, and 0.6 GW of geothermal energy) is assumed by 2025. However, thermal and natural gas plants are currently at their current values. In the medium term, the installed capacity of hydro plants and non-conventional renewables increased by 8.7 GW compared with 2025 (3.4 GW of hydropower, 4.7 GW of non-conventional renewables, and 0.6 GW of geothermal energy). In the long term, the total installed capacity reaches 45.8 GW, which is 11.6 GW above the baseline scenario. By 2050, renewable plants (conventional and non-conventional) are expected to constitute 85% of the total electricity system capacity (Figure 9). Notably, the deployment of smart grids will be progressively promoted until 2050, ensuring the resilience of the Peruvian energy system.
The energy mix also shows modifications in the carbon-neutrality scenario. There were no significant short-term changes, with greater dependence on natural gas (57%), oil (22%), and renewable sources (21%). In the medium term, the transformation process enabled a 25% increase in the use of renewables and firewood. Biomass production remained constant. In addition, energy consumption decreases by 20% relative to the baseline scenario due to improvements in end-use efficiency, the use of new construction materials, and reduced exports. In the long term, a reduction of almost 35% in energy consumption is projected, partly due to material substitution. The penetration of new, more efficient technologies and changes in induced factors (for example, through hourly rates) or end-consumer habits are consolidated. These changes also respond to processes such as more sustainable urban planning and environmentally friendly technologies. By 2050, 34% of Peru's energy will be produced from renewable sources, with hydropower accounting for 14%. Energy production from natural gas, coal, and oil remains relatively constant compared to current values, and its share is expected to decrease from 84% in 2020 to 67% in 2050. At the same time, the study considers advances in energy efficiency without specifying what these advances are.
Figure 9. Installed capacity in the baseline (left) and carbon neutrality (right) scenarios. Source: .
The environmental aspect (Figure 10) was also considered; consequently, the energy sector projected annual GHG emissions of 24 MtCO2e by the mid-century. Compared with the 70 MtCO2e of the baseline scenario in the same year, the carbon neutrality scenario shows a decrease of approximately 46 MtCO2e by 2050; however, the reduction would be only 5 MtCO2e.
Figure 10. Annual emissions in the energy sector in the baseline (left) and carbon neutrality (right) scenarios. Source: .
Transport
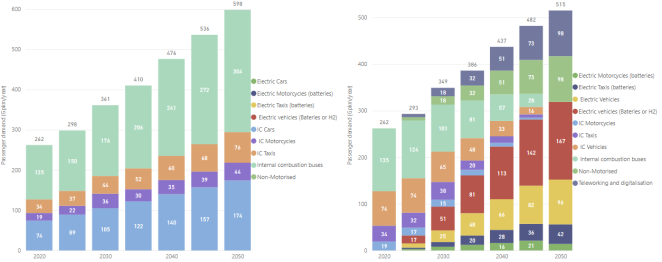
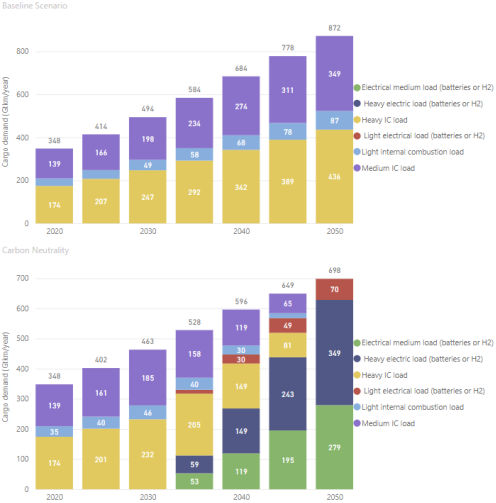
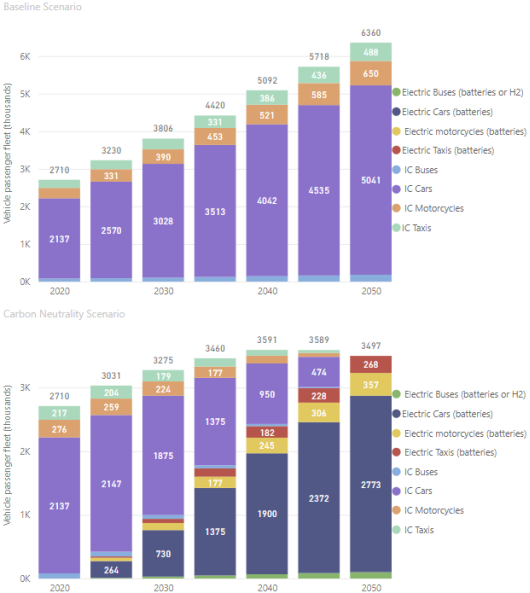
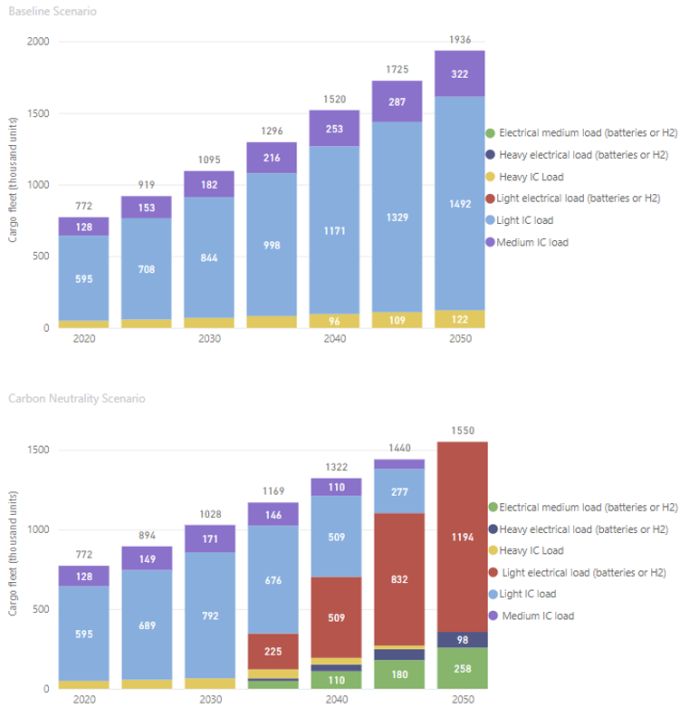
The way people and freight are transported is undergoing a significant transformation. It estimates a linear reduction in passenger demand (pkm) of approximately 15% by 2050, driven by improvements in road infrastructure. A linear modal shift towards non-motorized mobility (pedestrian and bicycle) is made, reducing passenger demand by approximately 15% by 2050. In addition, teleworking, and an increase in the digitization of procedures are considered, contributing to a reduced demand of roughly 15% by 2050 (Figure 13). For cargo transport, demand is expected to be 20% lower by 2050, primarily due to public infrastructure investments that reduce transport distances. Cargo demand is estimated to be supplied at 2020 levels, with 50% heavy cargo, 40% medium cargo, and 10% light cargo (Figure 11).
At the same time, the scenario accounts for the gradual electrification of private, public, and cargo fleets through 2050. In the short term, from 2021 to 2025, the transport system is expected to continue operating under fossil fuels. In the case of passenger transport, the electrification process begins, and the availability of technologies is considered. On the other hand, no changes are expected in cargo transport due to the limited technological options available. By 2025, at least 10% of cars are expected to be electric, 15% of motorcycles will be zero-emission, 10% of buses will be emission-free, and 10% of taxis will be electrified. In the medium term, 50% of passenger mobility demand will be met by electric transport (electric cars, motorcycles, buses, and taxis) by the end of the period.
Figure 11. Technologies to meet passenger demand in the baseline. (left) and carbon neutrality (right) scenarios. Source: .
Figure 12. Technologies to meet load demand in the baseline (top) and carbon neutrality (bottom) scenarios. Source: .
Figure 13. Composition of the fleet of passengers in the baseline (up) and carbon neutrality (down) scenarios. Source:.
Figure 14. Cargo fleet composition in the baseline (top) and carbon neutrality (bottom) scenarios. Source:.
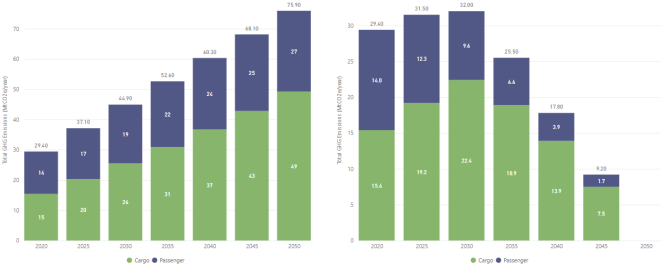
From 2030, the country's cargo will be transported with electric trucks. It is estimated that approximately 20% of cargo demand will be met by zero-emission trucks (powered by batteries or hydrogen) by 2035 (Figure 12). In the long term, 100% of passenger and cargo demand is met by zero-emission technologies (batteries or hydrogen) (Figure 13). Environmentally, by 2050, GHG emissions will reach carbon neutrality, starting from 29.3 MtCO2e, followed by a slight increase over the next decade (32 MtCO2e in 2030), during which electrification begins (Figure 14).
3.2.2. Different Sectors II: AFOLU, Residues and Industry
Agriculture, silviculture, and other land uses (AFOLU)
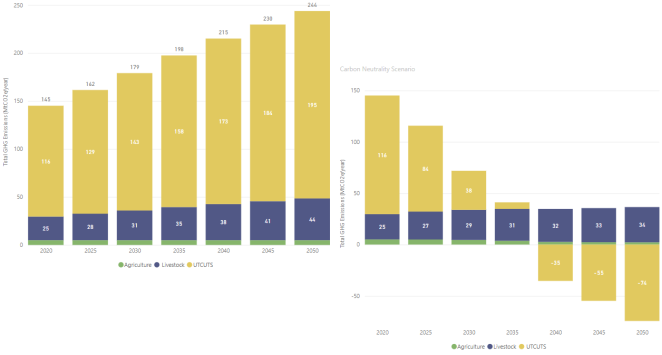
In agriculture, the replacement of 50% of inorganic fertilizers with organic alternatives, the adoption of 20% of silvopastoral systems in the Amazon, and the management of 20% of high-Andean natural pastures are notable efforts in the sector. Additionally, changes in meat consumption are also notable. Regarding LULUCF, land rights. agroforestry systems and support platforms are required. By 2040, 1.7 million ha will be sustainable, and 14 million ha under forest management will exist, thereby restoring natural habitats. By 2050, 2 million ha will serve for restoration and commercial activities. By 2050, deforestation is likely to decrease by approximately 90%.
In the short term, emissions are reduced by about 46 MtCO2e relative to the baseline scenario and by 29 MtCO2e relative to 2020. In the medium term, emissions decrease by approximately 169 MtCO2e relative to the baseline scenario and by 117 MtCO2e relative to 2020. In the long term, net emissions fell from 145 MtCO2e in 2020 to just under -38 MtCO2e; this change is even more remarkable when comparing net emissions in the baseline scenario (around 244 MtCO2e) with those in the carbon neutrality scenario (about -38 MtCO2e) (Figure 18).
Figure 15. Annual emissions in the transport sector in the baseline (left) and carbon neutrality (right) scenarios. Source:.
Waste
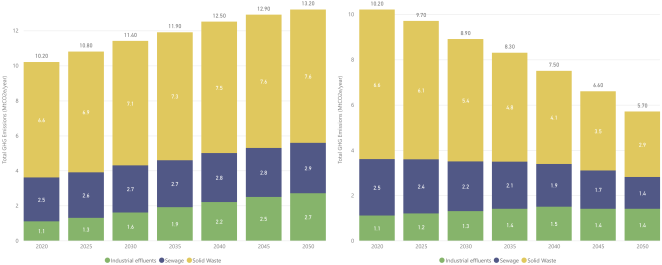
As a starting point, it is assumed that solid waste generation will be reduced by 25% by 2050, based on the base-scenario projections. It is estimated that 50% of the remaining tonnage generated will be recycled, implying that only 37% of the waste projected in the baseline scenario in 2050 will be deposited in a landfill (Figure 16). At the same time, treated wastewater will increase to 50% of these facilities by 2050, and industrial effluents will be treated, ranging from 15% in the short term to 50% in the long term. These measures will reduce GHG emissions in this sector (Figure 17). Consequently, by 2050, the carbon neutrality scenario projects annual GHG emissions of less than 6 MtCO2e, compared to just over 13 MtCO2e in the baseline scenario for the same year. This implies reductions of 7.5 MtCO2e by mid-century and 4.5 MtCO2e compared to the estimated 2020 values.
Figure 16. Annual emissions of the AFOLU sector in the baseline (left) and carbon neutrality (right) scenarios. Source:.
Figure 17. Annual emissions from the baseline (left) and carbon neutrality (right) scenarios. Source:.
Industrial Processes and Product Use (PIUP)
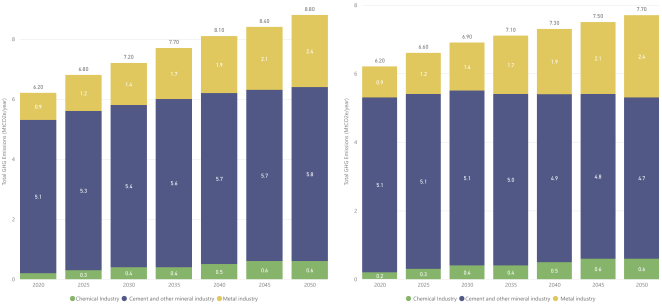
It is estimated that the clinker factor will decrease over time, ranging from 0.77 in 2020 to 0.6 in 2050, based on Latin American values and the goals established in the technological roadmap for the transition to the low-emission cement industry. This action reduces clinker consumption in 2050 to 8.7 Mt; 2.2 Mt less than the value projected in the base scenario. Reducing the clinker factor would result in annual GHG emissions of 8.8 MtCO2e, with the cement industry contributing significantly (1 MtCO2e) (Figure 18).
Figure 18. Annual emissions of the PIUP sector in the baseline (left) and carbon neutrality (right) scenarios. Source:.
4. Investment and Support
Nationally Determined Contributions were designed to be instruments to guarantee the accomplishment of the Paris Agreement . The Peruvian NDC was set at 178 MtCO2e by 2030, subject to national and international investment . While several political mandates and measures have been issued, more investment is needed in each sector to achieve climate goals. Estimations indicate that the required financing is almost 120 billion US$, based on 2020 values, of which more than 75% is needed to implement 30 mitigation measures in the energy sector . At the same time, it is essential to highlight that LULUCF, the country's most crucial emitter, requires lower financing than other sectors (16%) but will lead to deeper reductions by 2030.
Consequently, national strategies must focus primarily on these actions. Financing sources identified by the Peruvian government include multilateral and bilateral sources, such as the Green Climate Fund and the Adaptation Fund . Meanwhile, bilateral sources highlight the Global Alliance for Climate Change and the Danish International Development Agency, among others. Moreover, national, and private sources have been mapped to help increase the chances of financing and the practical implementation of NDCs. Among these, public-private partnerships, tax, development finance corporations, and green bonds have been identified.
Despite the availability of financial mechanisms, Peru faces several challenges in ensuring the sustainable implementation of its Nationally Determined Contributions (NDCs). Limited access to global financing, internal financial gaps, a lack of private-sector participation and capacity, and institutional barriers are among the problems. For instance, one drawback is that international loan financing requires on-time repayment and additional interest and is often directed to projects that yield benefits . However, opportunities are present, including leveraging carbon markets, capacity building and technical assistance, and blended finance and innovative instruments.
5. Discussion
The Peruvian GHG contribution of the energy sector, in contrast to industrialized countries, is relatively reduced; therefore, actions should be pointed out to the LULUCF sector, in which emissions are disproportionately significant. Peru should adopt a comprehensive strategy for land and energy to decarbonize effectively, rather than focusing only on energy. Past research on developing economies highlights land management and natural resources as key in climate change mitigation.
Unlike the more predictable decarbonization pathways linked to energy technologies, land-based mitigation carries higher uncertainty. By 2050, the AFOLU sector could reach significant emissions and even negative emissions. Nonetheless, good governance, land tenure, and implementation capacity are required for success, and these factors are often overlooked in models. Thus, results might overestimate mitigation potential if institutional barriers aren't properly considered.
The analysis of the energy sector reveals rapid expansion of renewable energy, particularly in electricity generation, with high solar and wind penetration projected by 2050. This trajectory aligns with global decarbonization scenarios, like those by the IEA, emphasizing electrification and renewables as key. However, the continued use of fossil fuels indicates an uneven transition across sectors. Similar patterns occur in emerging economies, with faster decarbonization of electricity than transportation and industry, highlighting the need for better sectoral policy integration to achieve full decarbonization.
The transport sector, identified as one of the largest contributors to emissions reductions, is projected to transition fully to zero-emission technologies by 2050. In pursuit of aligning with international decarbonization objectives, data from developing nations indicate that obstacles such as infrastructure deficiencies, elevated costs, and institutional fragmentation impede electrification initiatives. Ignoring informal transport in Peru overlooks key factors, making forecasts overly optimistic unless based on models including infrastructure and socio-economic factors.
From a policy standpoint, the results show a distinct gap between Peru's climate commitments and the conditions necessary for their implementation. The country has a comprehensive regulatory framework, including strategies and laws, but faces significant challenges in regulation, finance, and institutions. This reflects the broader 'implementation gap' in climate governance in the Global South, where policy often doesn't translate into action. Reliance on conditional targets linked to international funding underscores the importance of global climate finance, yet also introduces uncertainty, as future mitigation depends partly on external aid.
An important limitation in this study concerns the representation of social and behavioral dynamics. Although societal participation is acknowledged, these aspects are not explicitly modelled, a common limitation criticized for focusing on techno-economic factors and neglecting human response, social acceptance, and the impacts of it in political decisions. Recent work by Trutnevyte stresses the importance of including multiple perspectives, uncertainties, and stakeholders. In Peru, where social issues like energy access, inequality, and local acceptance are vital, integrating these factors is especially significant.
Furthermore, the modelling approach underpinning the analyzed pathways has several methodological limitations. The lack of transparency in assumptions and parameters limits reproducibility, and the lack of uncertainty analysis reduces robustness. Research shows that scenario-based studies often chart fixed trajectories with limited alternatives. More flexible and transparent models are needed that incorporate uncertainty, support sensitivity analysis, and engage stakeholders. Future studies should focus on creating integrated frameworks that incorporate energy, land-use, behavioral, and social factors, with an emphasis on uncertainty and diverse scenarios. These tools aim to improve stakeholder engagement and decision-making. Currently, Peru faces energy transition challenges that demand intersectoral collaboration to close the gaps in planning and implementation. Closing this gap requires overcoming structural, institutional, and social barriers to facilitate effective decarbonization.
6. Conclusions
Peru's path to carbon neutrality faces challenges from global climate initiatives and the country's economic growth. International focus on emissions underscores the critical need for sector-specific measures to combat warming as Peru seeks to align its climate ambitions with international commitments . The country faces numerous challenges and significant opportunities.
One of the most pressing challenges is addressing emissions from the Land Use, Land-Use Change, and Forestry sector . Surprisingly, this sector remains the largest contributor to Peru's carbon footprint, surpassing the transportation and energy sectors. This underscores the urgent need for targeted mitigation strategies. To address this challenge, Peru has submitted 63 measures to mitigate the impacts of climate change. The Peruvian government's commitment to reducing greenhouse gas (GHG) emissions is evident in its updated Nationally Determined Contributions (NDCs), which set an ambitious target of reducing emissions by 40% by 2030. Achieving this target requires a collaborative effort from all sectors, with an emphasis on reducing deforestation, expanding renewable energy, and improving energy efficiency. While technical solutions are vital, financing plays a critical role in Peru's energy transition. Significant funding is needed to modernize infrastructure, expand renewable energy projects, and implement energy efficiency measures. Mobilizing both public and private investment is crucial, especially by utilizing international climate funds like the Green Climate Fund (GCF) and attracting foreign capital.
Progress in renewable energy, such as solar and wind, faces obstacles from fossil-fuel dependence and social barriers, needing policy reforms and investment in sustainable infrastructure and clean technology. Electrifying transport, carbon pricing, and improving energy efficiency are key to reducing Peru's emissions by 2050, as noted in the IDB and MINEM Report. Climate policy in Peru needs stronger enforcement, funding, and stakeholder engagement to meet NDCs. Integrating these into national plans, with international support, can accelerate the transition.
Finally, Peru is in its initial stages of the fight against climate change. While the challenges are significant, the opportunities for a sustainable and resilient future are also present. Enhancing policy frameworks, leveraging the country's vast renewable energy potential, and securing necessary investments are viable ways for Peru to achieve carbon neutrality.
Abbreviations

MINEM

Ministry of Energy and Mines

MINAM

Ministry of Environment

NDCs

Nationally Determined Contributions

IC

Internal Combustion

IPCC

Intergovernmental Panel on Climate Change

GCF

Green Climate Fund

LULUCF

Land-use, Land-use Change and Forest

NDC

Nationally Determined Contributions

PIUP

Industrial Processes and Product Use

UNFCCC

United Nations Framework Committee on Climate Change

PLANAA

Plan Nacional de Accion Ambiental

Author Contributions
Aaron Omar Colina-Calvo: Conceptualization, Formal Analysis, Investigation, Methodology, Vizualization, Writing –original draft
Hugo Avila Vargas: Formal Analysis, Supervision, Validation, Writing – review & editing
Conflicts of Interest
The authors declare no conflicts of interest.
References
[1] The History of Carbon Dioxide Emissions | World Resources Institute n.d.
[2] Climate Watch. Peru Climate Change Data | Emissions and Policies 2023. Available from:
[3] Who is really to blame for climate change? n.d. Available from:
[4] Hickel J. Quantifying national responsibility for climate breakdown: an equality-based attribution approach for carbon dioxide emissions in excess of the planetary boundary. Lancet Planet Health 2020; 4: e399–404.
[5] Yu S, Gao X, Ma C, Zhai L. Study on the Concept of Per Capita Cumulative Emissions and Allocation Options. Advances in Climate Change Research 2011; 2: 79–85. Available from:
[6] Per capita, national, historical: how do countries compare on CO2 metrics? - Our World in Data n.d.
[7] Chancel L. Global carbon inequality over 1990–2019. Nature Sustainability.
[8] Steinacher M, Joos F. Transient Earth system responses to cumulative carbon dioxide emissions: Linearities, uncertainties, and probabilities in an observation-constrained model ensemble. Biogeosciences 2016; 13: 1071–103.
[9] MacDougall AH, Friedlingstein P, MacDougall AH, Friedlingstein P. The Origin and Limits of the Near Proportionality between Climate Warming and Cumulative CO2 Emissions. J Clim 2015; 28: 4217–30.
[10] Share of global cumulative CO₂ emissions n.d. Available from:
[11] Ministerio de Energia y Minas, Area de Planeamiento Energetico 2024. Balance Nacional de Energia 2021. Available from:
[12] Ministerio de Energia y Minas, Area de Planeamiento Energetico 2025. Balance Nacional de Energia 2021. Available from:
[13] Energy Institute. Statistical Review of World Energy 2024. Avalilable from:
[14] IPCC. 2006 IPCC Guidelines for National Greenhouse Gas Inventories, 2006. Available from:
[15] MINAM, 2024. Inventario Nacional de Gases de Efecto Invernadero 2000-2019. Available from:
[16] MINEM, 2023. Reporte Annual de Gases de Efecto Invernadero del sector energia 2019, 2023.
[17] Ministerio del Ambiente. El Perú y el Cambio Climatico, Tercera Comunicacion Nacional del Peru. 2016. Available from:
[18] Gobierno del Peru. Contribuciones Nacionalmente Determinadas a nivel nacional del Peru 2020. Available from:
[19] MINEM. Direccion General de Asuntos Ambientales Energeticos 1993. Available from:
[20] MINAM, 2025. Politica Nacional: Estrategia Nacional ante el Cambio Climateico al 2050. Available from:
[21] Gobierno del Peru. Contribuciones Determinadas a Nivel Nacional del Peru: Reporte de Actualizacion Periodo 2021-2030.
[22] Grupo de Trabajo Multisectorial para la implementación de las NDC (GTM-NDC). Dirección General de Cambio Climatico y Desertificación 2018. Available from:
[23] Ministerio del Ambiente. Ley Marco sobre Cambio Climatico - Informes y publicaciones - Ministerio del Ambiente - Plataforma del Estado Peruano 2019. Available from:
[24] Nilsson A, Hansla A, Heiling JM, Bergstad CJ, Martinsson J. Public acceptability towards environmental policy measures: Value-matching appeals. Environ Sci Policy 2016; 61: 176–84.
[25] Grelle S, Hofmann W. When and Why Do People Accept Public-Policy Interventions? An Integrative Public-Policy-Acceptance Framework. Perspect Psychol Sci 2024; 19: 258–79.
[26] Quirós-Tortós J, Godínez-Zamora G, Gerardo De La Torre Ugarte D, Heros C, Lazo Lazo J, Ruiz E, et al. Costos y beneficios de la carbono-neutralidad en Perú: Una evaluación robusta. Costos y Beneficios de La Carbono-Neutralidad En Perú: Una Evaluación Robusta 2021. Available from:
[27] Pauw WP, Castro P, Pickering J, Bhasin S. Conditional nationally determined contributions in the Paris Agreement: foothold for equity or Achilles heel? Climate Policy 2020; 20: 468–84.
[28] Gobierno del Peru. Tercer Informe Bienal de Actualizacion ante la Convencion Marco de las Naciones Unidas sobre el Cambio Climatico 2023. Available from:
[29] Global climate action needs trusted finance data. Nature 2021; 589: 7.
[30] UNFCC. Adoption of the Paris Agreement 2015. Available from:
[31] Ministerio del Ambiente. Inventario Nacional de Gases de Efecto Invernadero 2023. Available from:
Cite This Article
  • APA Style

    Colina-Calvo, A. O., Vargas, H. A. (2026). Unlocking Peru's Potential for Carbon Neutrality: Overcoming Challenges and Seizing Opportunities. International Journal of Energy and Environmental Science, 11(4), 106-124. https://doi.org/10.11648/j.ijees.20261104.14

    Copy | Download

    ACS Style

    Colina-Calvo, A. O.; Vargas, H. A. Unlocking Peru's Potential for Carbon Neutrality: Overcoming Challenges and Seizing Opportunities. Int. J. Energy Environ. Sci. 2026, 11(4), 106-124. doi: 10.11648/j.ijees.20261104.14

    Copy | Download

    AMA Style

    Colina-Calvo AO, Vargas HA. Unlocking Peru's Potential for Carbon Neutrality: Overcoming Challenges and Seizing Opportunities. Int J Energy Environ Sci. 2026;11(4):106-124. doi: 10.11648/j.ijees.20261104.14

    Copy | Download

  • @article{10.11648/j.ijees.20261104.14,
      author = {Aaron Omar Colina-Calvo and Hugo Avila Vargas},
      title = {Unlocking Peru's Potential for Carbon Neutrality: Overcoming Challenges and Seizing Opportunities},
      journal = {International Journal of Energy and Environmental Science},
      volume = {11},
      number = {4},
      pages = {106-124},
      doi = {10.11648/j.ijees.20261104.14},
      url = {https://doi.org/10.11648/j.ijees.20261104.14},
      eprint = {https://article.sciencepublishinggroup.com/pdf/10.11648.j.ijees.20261104.14},
      abstract = {Peru's transition towards carbon neutrality is both a critical environmental need and a complex challenge. As one of the most climate-vulnerable countries in Latin America, Peru faces mounting pressure to reduce greenhouse gas (GHG) emissions while maintaining economic growth and energy security. This study examines the current state of Peru's energy transition and analyzes the principal sources of national emissions, with particular emphasis on the land-use, land-use change, and forestry (LULUCF) sector, which is the country's largest contributor to GHG emissions. The research is based on a comprehensive review of national climate policies, nationally determined contributions (NDCs), government strategies, and institutional reports from international organizations on decarbonization. The study evaluates the main mitigation pathways proposed to achieve Peru's climate targets, including expanding renewable energy technologies, electrifying the transport sector, improving energy efficiency, and enhancing land-use management practices. Particular attention is given to the role of climate finance and institutional coordination, drawing on recommendations from the Inter-American Development Bank (IDB), the Ministry of Environment (MINAM), and other stakeholders involved in Peru's low-carbon transition. The analysis demonstrates that, although Peru possesses significant renewable energy potential, mainly wind and solar, and strategic opportunities for sustainable growth, achieving a 40% reduction in GHG emissions by 2030, over its 60 mitigation measures, and carbon neutrality by 2050 will require substantial investment, technological innovation, stronger governance frameworks, and long-term policy stability. The findings highlight that the success of Peru's decarbonization pathway will depend not only on technological deployment but also on effective policy implementation, cross-sectoral collaboration, and sustained financial support. This study contributes to the understanding of Peru's energy transition challenges and provides insights for strengthening climate policy and advancing a resilient, low-carbon future.},
     year = {2026}
    }
    

    Copy | Download

  • TY  - JOUR
    T1  - Unlocking Peru's Potential for Carbon Neutrality: Overcoming Challenges and Seizing Opportunities
    AU  - Aaron Omar Colina-Calvo
    AU  - Hugo Avila Vargas
    Y1  - 2026/08/24
    PY  - 2026
    N1  - https://doi.org/10.11648/j.ijees.20261104.14
    DO  - 10.11648/j.ijees.20261104.14
    T2  - International Journal of Energy and Environmental Science
    JF  - International Journal of Energy and Environmental Science
    JO  - International Journal of Energy and Environmental Science
    SP  - 106
    EP  - 124
    PB  - Science Publishing Group
    SN  - 2578-9546
    UR  - https://doi.org/10.11648/j.ijees.20261104.14
    AB  - Peru's transition towards carbon neutrality is both a critical environmental need and a complex challenge. As one of the most climate-vulnerable countries in Latin America, Peru faces mounting pressure to reduce greenhouse gas (GHG) emissions while maintaining economic growth and energy security. This study examines the current state of Peru's energy transition and analyzes the principal sources of national emissions, with particular emphasis on the land-use, land-use change, and forestry (LULUCF) sector, which is the country's largest contributor to GHG emissions. The research is based on a comprehensive review of national climate policies, nationally determined contributions (NDCs), government strategies, and institutional reports from international organizations on decarbonization. The study evaluates the main mitigation pathways proposed to achieve Peru's climate targets, including expanding renewable energy technologies, electrifying the transport sector, improving energy efficiency, and enhancing land-use management practices. Particular attention is given to the role of climate finance and institutional coordination, drawing on recommendations from the Inter-American Development Bank (IDB), the Ministry of Environment (MINAM), and other stakeholders involved in Peru's low-carbon transition. The analysis demonstrates that, although Peru possesses significant renewable energy potential, mainly wind and solar, and strategic opportunities for sustainable growth, achieving a 40% reduction in GHG emissions by 2030, over its 60 mitigation measures, and carbon neutrality by 2050 will require substantial investment, technological innovation, stronger governance frameworks, and long-term policy stability. The findings highlight that the success of Peru's decarbonization pathway will depend not only on technological deployment but also on effective policy implementation, cross-sectoral collaboration, and sustained financial support. This study contributes to the understanding of Peru's energy transition challenges and provides insights for strengthening climate policy and advancing a resilient, low-carbon future.
    VL  - 11
    IS  - 4
    ER  - 

    Copy | Download

Author Information
  • Department of Sciences, National University of Engineering, Lima, Peru

    Biography: Aaron Omar Colina-Calvo holds a Master's degree in Renewable Energy and Clean Technologies from the University of Manchester and a bachelor's degree in Electrical Engineering from the Universidad Nacional Mayor de San Marcos, Peru. Moreover, he holds a Diploma in Electricity Regulation from ESAN University, Peru.

    Research Fields: Energy systems, energy modelling, electricity, sustainability, renewable energy.

  • Department of Electrical and Electronic Engineering, National University of San Marcos, Lima, Peru

    Biography: Hugo Avila Vargas has held various positions in the Faculty of Electronic and Electrical Engineering of UNMSM, such as: Director of the School of Electrical Engineering, for more than 8 years, Vice Dean of Research and Postgraduate for 3 years, he is currently Director of the Department of Electrical Engineering, from August 2024 to date, and Professor of several courses, he has also carried out work in the Telecommunications sector, for the entry of telephone operators: CLARO, MOVISTAR AND ENTEL, USE OF THE 4G SYSTEM.

    Research Fields: Electrical engineering, energy systems, renewable energy, project management, energy economics.