
Solar eclipses provide unique opportunities to study how the ionosphere responds to rapid changes in the ionization rate. The partial solar eclipse of January 26, 2009, and the partial solar eclipse of March 20, 2015, offered opportunities to understand ionospheric electron density variations along the annularity path during solar minimum and geomagnetic quiet periods. For this analysis, various ground-based GPS stations located along the annularity line were selected and divided into three major regions: namely, Bahir Dar, Arbaminch, and Robe stations. We analyzed the temporal and spatial vertical total electron content (VTEC) variations before, during, and after these events, while comparing the observed changes between the two eclipse periods. On January 26, the eclipse day, a noticeable depression in VTEC is observed during the eclipse interval, which began at 04: 57 UT, reached its maximum obscuration (55 - 65% coverage) at 07: 59: 44 UT, and ended around 09: 55 UT. This reduction corresponds to the temporary decrease in solar radiation reaching the Earth’s ionosphere. The VTEC variations observed over the Bahir Dar station during January 25-27, 2009, clearly demonstrate the ionospheric response. On the non-eclipse days (January 25 and 27, 2009), the TEC followed a normal diurnal trend, increasing after sunrise, peaking around midday, and decreasing toward night. In contrast, on the eclipse day, the TEC curve shows a pronounced depression during the eclipse interval. The comparison of TEC variation on consecutive days reveals that, on the reference day of 19 March 2015 (before the eclipse), the maximum VTEC was approximately 26 TECU. In contrast, on 20 March 2015 (the eclipse day), the maximum VTEC was approximately 24 TECU. This clearly demonstrates the effect of the partial solar eclipse on March 20, 2015, over BDR. The VTEC variations observed at the BDR station on 20 March 2015 show an approximate 20% reduction, corresponding to the temporary decrease in solar radiation reaching Earth's ionosphere.
| Published in | International Journal of High Energy Physics (Volume 12, Issue 1) |
| DOI | 10.11648/j.ijhep.20261201.12 |
| Page(s) | 9-19 |
| Creative Commons |
This is an Open Access article, distributed under the terms of the Creative Commons Attribution 4.0 International License (http://creativecommons.org/licenses/by/4.0/), which permits unrestricted use, distribution and reproduction in any medium or format, provided the original work is properly cited. |
| Copyright |
Copyright © The Author(s), 2026. Published by Science Publishing Group |
Solar Eclipse, VTEC, Geomagnetic Storm, Ionospheric Variability
UT | Universal Time |
GPS | Global Positioning System |
VTEC | Vertical Total Electron Content |
EUV | Extreme Ultraviolet |
Kp | Planetary K-index |
Dst | Disturbance Storm Time index |
ARMI | Arbaminch |
BDR | Bahir Dar |
| [1] | Okoh, D., et al., Total Electron Content Variations Over Abuja During the Annular Solar Eclipse of September 1, 2016. |
| [2] | Cooper, C., et al., Measurement of ionospheric total electron content using single-frequency geostationary satellite observations. Radio Science, 2019. 54(1): p. 10-19. |
| [3] | Guo, L., et al. Ionospheric response to the total solar eclipse of 22 july 2009 as deduced from VLBI and GPS Data. in Proceedings of the Sixth General Meeting of the International VLBI Service for Geodesy and Astrometry. 2010. |
| [4] | Correia, E., et al., Characterization of the ionosphere response to the X1. 3 solar event occurred on 30 March 2022. Advances in Space Research, 2025. |
| [5] | Wang, S., et al., Analysis of the consecutive X-ray flares effects on the lower ionosphere. Space Weather, 2025. 23(8): p. e2025SW004471. |
| [6] | Jenan, R., T. L. Dammalage, and S. K. Panda, Ionospheric total electron content response to September-2017 geomagnetic storm and December-2019 annular solar eclipse over Sri Lankan region. Acta Astronautica, 2021. 180: p. 575-587. |
| [7] | Prölss, G., Physics of the Earth’s space environment: an introduction. 2012: Springer Science & Business Media. |
| [8] | Tariku, Y. A., Patterns of GPS-TEC variation over low-latitude regions (African sector) during the deep solar minimum (2008 to 2009) and solar maximum (2012 to 2013) phases. Earth, Planets and Space, 2015. 67(1): p. 35. |
| [9] | Davies, K., Ionospheric radio propagation. Vol. 80. 1965: US Department of Commerce, National Bureau of Standards. |
| [10] | Dessler, A., J. T. Houghton, and M. J. Rycroft, Cambridge atmospheric and space science series. (No Title), 2001. |
| [11] | Kelley, M. C., The Earth's ionosphere: Plasma physics and electrodynamics. Vol. 96. 2009: Academic press. |
| [12] | Huang, Z. and R. Roussel-Dupré, Total electron content (TEC) variability at Los Alamos, New Mexico: A comparative study: FORTE-derived TEC analysis. Radio science, 2005. 40(06): p. 1-23. |
| [13] | Uga, C. I., et al., Variation in total electron content over Ethiopia during the solar eclipse events. Radio Science, 2024. 59(4): p. e2023RS007830. |
| [14] | Aa, E., et al., 2-D total electron content and 3-D ionospheric electron density variations during the 14 October 2023 annular solar eclipse. Journal of Geophysical Research: Space Physics, 2024. 129(3): p. e2024JA032447. |
| [15] | Jose, L., et al., Response of the equatorial ionosphere to the annular solar eclipse of 15 January 2010. Journal of Geophysical Research: Space Physics, 2020. 125(8): p. e2019JA027348. |
| [16] | Athwart, D. O., B. Ndinya, and P. Baki, Effects of 15th January 2010 Annular Solar Eclipse on Traveling Ionospheric Disturbances and Equatorial Plasma Bubbles over Low Latitude Regions of East Africa. Advances in Astronomy, 2022. 2022(1): p. 5263997. |
| [17] | Adeniyi, J., et al., Signature of the 29 March 2006 eclipse on the ionosphere over an equatorial station. Journal of Geophysical Research: Space Physics, 2007. 112(A6). |
| [18] | Da Silva, A., et al., A multi-instrumental and modelling analysis of the ionospheric responses to the solar eclipse of December 14, 2020, over the Brazilian region. |
| [19] | Hoque, M. M., et al., Ionospheric response over Europe during the solar eclipse of March 20, 2015. Journal of Space Weather and Space Climate, 2016. 6: p. A36. |
| [20] | Sanyal, A., et al., Investigation of the Ionospheric Effects of the Solar Eclipse of April 8, 2024 Using Multi-Instrument Measurements. Atmosphere, 2025. 16(2): p. 161. |
| [21] | Silwal, A., et al., Global positioning system observations of ionospheric total electron content variations during the 15th January 2010 and 21st June 2020 solar eclipse. Radio Science, 2021. 56(5): p. e2020RS007215. |
| [22] | Tilahun, A. M., et al., Equatorial ionospheric VTEC perturbations during the 21 June 2020 solar eclipse. Earth and Space Science, 2025. 12(12): p. e2025EA004366. |
| [23] | Kumar, S., et al., Changes in the D region associated with three recent solar eclipses in the South Pacific region. Journal of Geophysical Research: Space Physics, 2016. 121(6): p. 5930-5943. |
| [24] | Ciraolo, L., et al., Calibration errors on experimental slant total electron content (TEC) determined with GPS. Journal of geodesy, 2007. 81(2): p. 111-120. |
| [25] | Mayer, C., et al., Extreme ionospheric conditions over Europe observed during the last solar cycle. 2008. |
| [26] | Jain, A., et al., TEC response during severe geomagnetic storms near the crest of equatorial ionization anomaly. Indian J. Radio Space Phys, 2010. 39: p. 11-24. |
| [27] | Ismail, M., Total Electron Content (TEC) and Estimation of Positioning Error Using Malaysia Data. |
| [28] | Yasyukevich, Y. V., A. Mylnikova, and A. Polyakova, Estimating the total electron content absolute value from the GPS/GLONASS data. Results in Physics, 2015. 5: p. 32-33. |
| [29] | Kersley, L., et al., Total electron content-A key parameterin propagation: measurement and usein ionospheric imaging. Annals of Geophysics, 2004. 47(2-3 Sup.). |
| [30] | Wanninger, L., Effects of the equatorial ionosphere on. GPS world, 1993. |
| [31] | Ya’acob, N., M. Abdullah, and M. Ismail, Determination of GPS total electron content using single layer model (SLM) ionospheric mapping function. International Journal of Computer Science and Network Security, 2008. 8(9): p. 154-160. |
| [32] | Zhao, B., et al. Characteristics of the ionospheric total electron content of the equatorial ionization anomaly in the Asian-Australian region during 1996–2004. in Annales Geophysicae. 2009. Copernicus Publications Göttingen, Germany. |
| [33] | Lay, E. H., et al., New lightning-derived vertical total electron content data provide unique global ionospheric measurements. Space Weather, 2022. 20(5): p. e2022SW003067. |
| [34] | Fedrizzi, M., et al., Mapping the low-latitude ionosphere with GPS. GPS WORLD, 2002. 13(2): p. 41-47. |
| [35] | Ogwala, A., et al. Diurnal, seasonal and solar cycle variation in total electron content and comparison with IRI-2016 model at Birnin Kebbi. in Annales Geophysicae. 2019. Copernicus Publications Göttingen, Germany. |
| [36] | Chen, C., et al., Ionospheric responses on the 21 August 2017 solar eclipse by using three-dimensional GNSS tomography. Earth, Planets and Space, 2022. 74(1): p. 173. |
| [37] | Gómez, D. D., Ionospheric response to the December 14, 2020 total solar eclipse in South America. Journal of Geophysical Research: Space Physics, 2021. 126(7): p. e2021JA029537. |
| [38] | Paul, A., et al. Response of the equatorial ionosphere to the total solar eclipse of 22 July 2009 and annular eclipse of 15 January 2010 as observed from a network of stations situated in the Indian longitude sector. in Annales geophysicae. 2011. Copernicus Publications Göttingen, Germany. |
| [39] | Abraha, G., A. Msganaw, and T. Kassa, Solar activity and geomagnetic storm effects on gps ionospheric tec over Ethiopia. Momona Ethiopian Journal of Science (MEJS), 2019. 11(2): p. 276-300. |
| [40] | Mendillo, M., Storms in the ionosphere: Patterns and processes for total electron content. Reviews of Geophysics, 2006. 44(4). |
| [41] | Srigutomo, W., et al., Decrease of total electron content during the 9 March 2016 total solar eclipse observed at low latitude stations, Indonesia. Annales Geophysicae Discussions, 2019. 2019: p. 1-12. |
| [42] | Chakraborty, S., et al., Modeling of the lower ionospheric response and VLF signal modulation during a total solar eclipse using ionospheric chemistry and LWPC. Astrophysics and Space Science, 2016. 361(2): p. 72. |
| [43] | Vaishnav, R., et al., Ionospheric response to solar EUV radiation variations using GOLD observations and the CTIPe model. Journal of Geophysical Research: Space Physics, 2024. 129(1): p. e2022JA030887. |
| [44] | Resende, L. C., et al. A multi-instrumental and modeling analysis of the ionospheric responses to the solar eclipse on 14 December 2020 over the Brazilian region. in Annales Geophysicae. 2022. Copernicus Publications Göttingen, Germany. |
| [45] | Alizadeh, M. M., et al., Remote sensing ionospheric variations due to total solar eclipse, using GNSS observations. Geodesy and Geodynamics, 2020. 11(3): p. 202-210. |
| [46] | Liu, J., et al., Ionospheric response to the 21 May 2012 annular solar eclipse over Taiwan. Journal of Geophysical Research: Space Physics, 2019. 124(5): p. 3623-3636. |
| [47] | Lei, J., et al., Long-lasting response of the global thermosphere and ionosphere to the 21 August 2017 solar eclipse. Journal of Geophysical Research: Space Physics, 2018. 123(5): p. 4309-4316. |
| [48] | Abadi, P., et al., Observations of Ionospheric Conditions Over Pontianak During The Partial Solar Eclipse. Indonesian Journal of Aerospace, 2024. 22(2): p. 85-94. |
| [49] | Paulino, I., et al., Ionospheric responses to the 14 October 2023 annular solar eclipse over Brazil: A case study of fixed-frequency isoline variations. EGUsphere, 2026. 2026: p. 1-16. |
| [50] | Harjosuwito, J., et al. Ionosonde and GPS total electron content observations during the 26 December 2019 annular solar eclipse over Indonesia. in Annales Geophysicae. 2023. Copernicus Publications Göttingen, Germany. |
| [51] | Singh, R., et al., D-region ionosphere response to the total solar eclipse of 22 July 2009 deduced from ELF-VLF tweek observations in the Indian sector. Journal of Geophysical Research: Space Physics, 2011. 116(A10). |
| [52] | Eshkuvatov, H., et al., Variations in Ionospheric Total Electron Content and Scintillation at GPS stations in Uzbekistan and China during the Annular Solar Eclipse on June 21, 2020. Physics of the Dark Universe, 2025. 48: p. 101892. |
| [53] | Afraimovich, E., E. Kosogorov, and O. Lesyuta, Effects of the August 11, 1999 total solar eclipse as deduced from total electron content measurements at the GPS network. Journal of atmospheric and solar-terrestrial physics, 2002. 64(18): p. 1933-1941. |
| [54] | Hassan, Z., et al., Investigating Ionospheric TEC Variations in Solar and Geomagnetic Influences Across Solar Activity Phases. Advances in Space Research, 2026. |
| [55] | Le, H., et al., Anomaly distribution of ionospheric total electron content responses to some solar flares. Earth and Planetary Physics, 2019. 3(6): p. 481-488. |
| [56] | Homam, M., The correlation between total electron content variations and solar activity. 2015. |
| [57] | Hargreaves, J. K., The solar-terrestrial environment: an introduction to geospace-the science of the terrestrial upper atmosphere, ionosphere, and magnetosphere. 1992: Cambridge university press. |
APA Style
Ayalew, D., Gizachew, S., Habtamu, M. (2026). Investigation of Solar Eclipse-induced Variations in Total Electron Content over Ethiopia During 26 January 2009 and 20 March 2015. International Journal of High Energy Physics, 12(1), 9-19. https://doi.org/10.11648/j.ijhep.20261201.12
ACS Style
Ayalew, D.; Gizachew, S.; Habtamu, M. Investigation of Solar Eclipse-induced Variations in Total Electron Content over Ethiopia During 26 January 2009 and 20 March 2015. Int. J. High Energy Phys. 2026, 12(1), 9-19. doi: 10.11648/j.ijhep.20261201.12
@article{10.11648/j.ijhep.20261201.12,
  author = {Debrie Ayalew and Shambel Gizachew and Melkamu Habtamu},
  title = {Investigation of Solar Eclipse-induced Variations in Total Electron Content over Ethiopia During 26 January 2009 and 20 March 2015},
  journal = {International Journal of High Energy Physics},
  volume = {12},
  number = {1},
  pages = {9-19},
  doi = {10.11648/j.ijhep.20261201.12},
  url = {https://doi.org/10.11648/j.ijhep.20261201.12},
  eprint = {https://article.sciencepublishinggroup.com/pdf/10.11648.j.ijhep.20261201.12},
  abstract = {Solar eclipses provide unique opportunities to study how the ionosphere responds to rapid changes in the ionization rate. The partial solar eclipse of January 26, 2009, and the partial solar eclipse of March 20, 2015, offered opportunities to understand ionospheric electron density variations along the annularity path during solar minimum and geomagnetic quiet periods. For this analysis, various ground-based GPS stations located along the annularity line were selected and divided into three major regions: namely, Bahir Dar, Arbaminch, and Robe stations. We analyzed the temporal and spatial vertical total electron content (VTEC) variations before, during, and after these events, while comparing the observed changes between the two eclipse periods. On January 26, the eclipse day, a noticeable depression in VTEC is observed during the eclipse interval, which began at 04: 57 UT, reached its maximum obscuration (55 - 65% coverage) at 07: 59: 44 UT, and ended around 09: 55 UT. This reduction corresponds to the temporary decrease in solar radiation reaching the Earth’s ionosphere. The VTEC variations observed over the Bahir Dar station during January 25-27, 2009, clearly demonstrate the ionospheric response. On the non-eclipse days (January 25 and 27, 2009), the TEC followed a normal diurnal trend, increasing after sunrise, peaking around midday, and decreasing toward night. In contrast, on the eclipse day, the TEC curve shows a pronounced depression during the eclipse interval. The comparison of TEC variation on consecutive days reveals that, on the reference day of 19 March 2015 (before the eclipse), the maximum VTEC was approximately 26 TECU. In contrast, on 20 March 2015 (the eclipse day), the maximum VTEC was approximately 24 TECU. This clearly demonstrates the effect of the partial solar eclipse on March 20, 2015, over BDR. The VTEC variations observed at the BDR station on 20 March 2015 show an approximate 20% reduction, corresponding to the temporary decrease in solar radiation reaching Earth's ionosphere.},
 year = {2026}
}
TY  - JOUR
T1  - Investigation of Solar Eclipse-induced Variations in Total Electron Content over Ethiopia During 26 January 2009 and 20 March 2015
AU  - Debrie Ayalew
AU  - Shambel Gizachew
AU  - Melkamu Habtamu
Y1  - 2026/05/26
PY  - 2026
N1  - https://doi.org/10.11648/j.ijhep.20261201.12
DO  - 10.11648/j.ijhep.20261201.12
T2  - International Journal of High Energy Physics
JF  - International Journal of High Energy Physics
JO  - International Journal of High Energy Physics
SP  - 9
EP  - 19
PB  - Science Publishing Group
SN  - 2376-7448
UR  - https://doi.org/10.11648/j.ijhep.20261201.12
AB  - Solar eclipses provide unique opportunities to study how the ionosphere responds to rapid changes in the ionization rate. The partial solar eclipse of January 26, 2009, and the partial solar eclipse of March 20, 2015, offered opportunities to understand ionospheric electron density variations along the annularity path during solar minimum and geomagnetic quiet periods. For this analysis, various ground-based GPS stations located along the annularity line were selected and divided into three major regions: namely, Bahir Dar, Arbaminch, and Robe stations. We analyzed the temporal and spatial vertical total electron content (VTEC) variations before, during, and after these events, while comparing the observed changes between the two eclipse periods. On January 26, the eclipse day, a noticeable depression in VTEC is observed during the eclipse interval, which began at 04: 57 UT, reached its maximum obscuration (55 - 65% coverage) at 07: 59: 44 UT, and ended around 09: 55 UT. This reduction corresponds to the temporary decrease in solar radiation reaching the Earth’s ionosphere. The VTEC variations observed over the Bahir Dar station during January 25-27, 2009, clearly demonstrate the ionospheric response. On the non-eclipse days (January 25 and 27, 2009), the TEC followed a normal diurnal trend, increasing after sunrise, peaking around midday, and decreasing toward night. In contrast, on the eclipse day, the TEC curve shows a pronounced depression during the eclipse interval. The comparison of TEC variation on consecutive days reveals that, on the reference day of 19 March 2015 (before the eclipse), the maximum VTEC was approximately 26 TECU. In contrast, on 20 March 2015 (the eclipse day), the maximum VTEC was approximately 24 TECU. This clearly demonstrates the effect of the partial solar eclipse on March 20, 2015, over BDR. The VTEC variations observed at the BDR station on 20 March 2015 show an approximate 20% reduction, corresponding to the temporary decrease in solar radiation reaching Earth's ionosphere.
VL  - 12
IS  - 1
ER  -
Department of Physics, Debre Markos University, Debremarkos, Ethiopia
Department of Physics, College of Natural and Computational Science, Debremarkos, Ethiopia
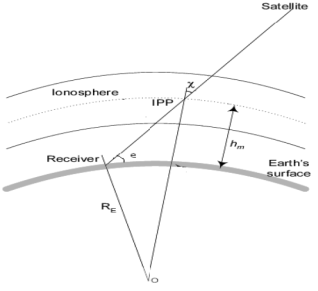
Figure 1. To determine its total electron content, the ionosphere is modeled as a thin shell at a nominal height of 400 kilometers [34].
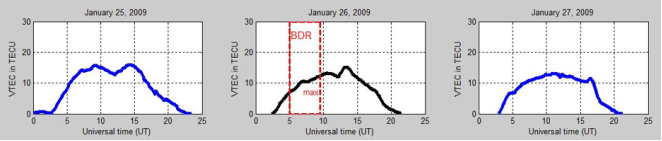
Figure 2. The variations in VTEC at the BahirDar station during the days before, during, and after the partial solar eclipse on January 26, 2009.
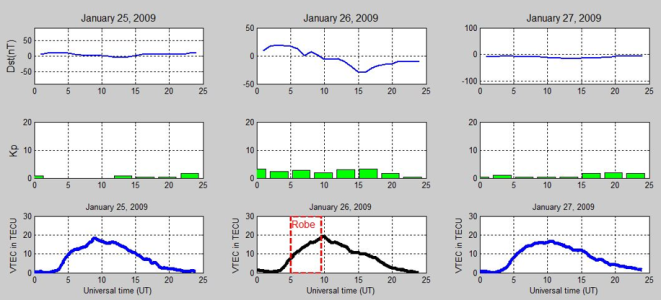
Figure 3. This shows the diurnal variations of the vertical total electron content (VTEC) and geomagnetic disturbance (with Dst and Kp indices) at Robe station during the days surrounding the partial solar eclipse of January 26, 2009.
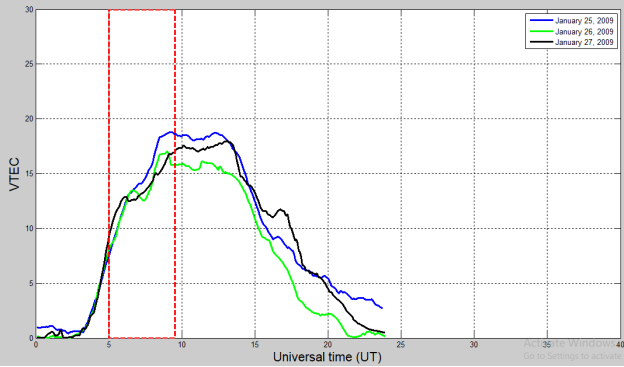
Figure 4. Shows the diurnal variations of the vertical total electron content (VTEC) at the Arbaminch station during the days surrounding the partial solar eclipse of January 26, 2009.
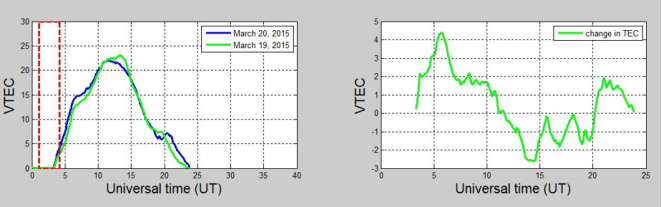
Figure 5. Shows a comparison of vertical total electron content (VTEC) variations and the differences in TEC before and during the solar eclipse on March 20, 2015, at Robe station.
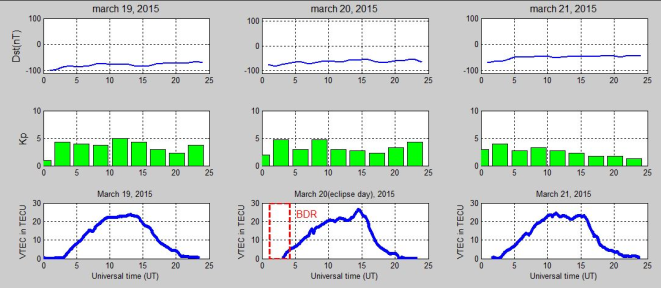
Figure 6. Shows the diurnal variations of the vertical total electron content (VTEC) and geomagnetic disturbance with DST and KP indices at Bahir Dar station during the days surrounding the partial solar eclipse of March 20, 2015.
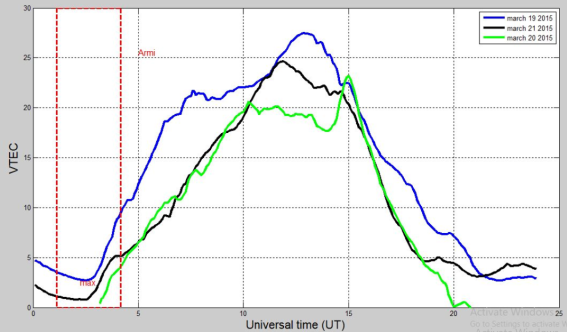
Figure 7. Shows the diurnal variations of the VTEC at Arba Minch station during the days surrounding the partial solar eclipse of March 20, 2015.

Information



 Share This Article
 Twitter
 Linked In
 Facebook
 Copy
Copy Download